Back to articles
Special Issue on CIC33: Color and Imaging Conference 2025
Volume: 8 | Article ID: 000404
Image
Can Gloss and Translucency Be Captured in an Explainable Low-Dimensional Space?
  DOI :  10.2352/J.Percept.Imaging.2025.8.000404  Published OnlineOctober 2025
Abstract
Abstract

One central challenge in modeling material appearance perception is the creation of an explainable and navigable representation space. In this study, we address this by training a StyleGAN2-ADA deep generative model on a large-scale, physically based rendered dataset containing translucent and glossy objects with varying intrinsic optical parameters. The resulting latent vectors are analyzed through dimensionality reduction, and their perceptual validity is assessed via psychophysical experiments. Furthermore, we evaluate the generalization capabilities of StyleGAN2-ADA on unseen materials. We also explore inverse mapping techniques from latent vectors reduced by principal component analysis back to original optical parameters, highlighting both the potential and the limitations of generative models for explicit, parameter-based image synthesis. A comprehensive analysis provides significant insights into the latent structure of gloss and translucency perception and advances the practical application of generative models for controlled material appearance generation.

Supplementary Material S1
Subject Areas :
Views 0
Downloads 0
 articleview.views 0
 articleview.downloads 0
  Cite this article 

Hassan Askary, Muhammad Hamza Zafar, Davit Gigilashvili, "Can Gloss and Translucency Be Captured in an Explainable Low-Dimensional Space?in Journal of Perceptual Imaging,  2025,  pp 1 - 15,  https://doi.org/10.2352/J.Percept.Imaging.2025.8.000404

 Copy citation
  Copyright statement 
This work is licensed under the Creative Commons Attribution 4.0 International License. To view a copy of this license, visit http://creativecommons.org/licenses/by/4.0/.
  Article timeline 
  • received May 2025
  • accepted October 2025
  • PublishedOctober 2025

Preprint submitted to:
jpi
Journal of Perceptual Imaging
J. Percept. Imaging
J. Percept. Imaging
2575-8144
Society for Imaging Science and Technology
1.
Introduction
The ability of human observers to recognize materials and their properties only by visual assessment is an ongoing field of research [1, 8]. Humans are able to recognize materials across many conditions, such as shape, viewing angle, lighting direction, spectral power distribution, and so on [25, 46]. Although this ability is essential to performing many daily activities, such as determining whether a fruit is edible, its exact mechanisms remain poorly understood [9, 24, 34]. To understand material perception and to produce the desired appearance, models are required that can map this behavior of inferring material properties. This is a challenging task, as it requires the creation of a feature representation space that captures the complex characteristics of different materials [31, 38].
This work focuses on two attributes of material appearance: translucency and gloss. Gloss is primarily related to surface reflectance, which makes highlights or images of the surrounding appear superimposed on the surface while translucency refers to the degree of light penetration, scattering, and propagation in the subsurface of the material [18]. Gloss and translucency refer both to the respective optical as well as perceptual properties of the material [12]. Although angular reflectance from the surface as well as subsurface scattering of light can be measured instrumentally, the link between optical parameters and the corresponding perception they evoke in humans is far from straightforward [4, 13]. Recent studies propose that the human visual system (HVS) relies on a complex combination of spatiotemporal regularities in the image statistics to interpret materials’ degree of glossiness and translucency [12]. This complexity makes it difficult to construct features that can reliably predict perceptual translucency and glossiness.
Studies of gloss and translucency perception often involve psychophysical experiments, where real or synthetic images of different objects and materials are shown to observers to assess. Observers’ assessments are correlated with various optical properties and/or handcrafted image features [28, 29], neither of which offers a sufficiently robust representation space to fully explain perceptual variations [12]. Handcrafted features fail to capture the complexity and subtle nuances of material appearance under different conditions of varying intrinsic and extrinsic factors [13].
An alternative approach is a data-driven one. Data-driven methods eliminate the need for deliberate construction of diagnostic image features that require significant domain knowledge. Data-driven approaches rely on exploiting the statistical structures inside the images to model the distribution of the training samples, in turn capturing the nature of appearance of the material [3, 40]. The success of these methods is dependent on the number of samples provided during the training or fitting process, and hence benefit from large highly diverse training datasets.
Deep neural networks follow a data-driven approach that learns patterns from data. They have demonstrated remarkable performance in many computer vision tasks [5], including material recognition [2, 35]. Moreover, they have been proposed as a viable approach for modeling human perception at the behavioral level [32, 38].
A generative adversarial network (GAN) is a type of neural network that is capable of synthesizing realistic images [15, 33]. This family of neural networks is also known as deep generative models. Deep generative models synthesize high-quality images by learning a latent representation of the training data distribution. The input images are compressed to a smaller feature vector that composes the latent space. This compression of the image forces the model to learn only the discriminative features and discard the rest. Once the model is trained, it places feature vectors of similar looking images together, forming clusters. Navigating this latent space varies different properties in the resulting output image, such as size, color, shape, and so on [33]. The generative models exploit the image statistics and regularities inside them to form their representation. The HVS is believed to also perform a similar process for material perception [37].
Few works have explored latent representation space of deep generative models to understand and create a space either for perceived gloss or translucency. One of the first attempts to utilize deep generative models to model the appearance of materials is by Storrs et al. [36]. They rendered a dataset of 10,000 images of bumpy surfaces with different illumination varying from high (glossy) to low (matte) specular reflectance. The PixelVAE variational autoencoder [17] was trained on this rendered dataset in an unsupervised manner. The model generates images from its learned latent distribution. Visualizing this learned latent representation, it was observed that the model had disentangled the extrinsic properties by placing them into distinct clusters. A psychophysical study showed that the trained model’s prediction correlated well with human gloss judgments.
Liao et al. [27] used deep generative models to learn a latent representation space for translucent objects. Instead of rendering, they collected a new dataset of 8085 photographs of soaps with varying translucent appearances, color, lighting directions, and other factors. The StyleGAN2-ADA model [20] was trained on this dataset in an unsupervised manner, and a layer-wise latent space was constructed based on the feature vectors generated by the different layers of the model. They found that it had learned to separate human-understandable scene attributes such as difference of materials, orientations, and color.
Finally, Nimma and Gigilashvili [30] trained the StyleGAN2-ADA model on a very limited set of 132 rendered images of glossy spheres. Analysis of the latent representation of the model showed that moving in the primary directions of the 512 dimensional latent vectors changed certain visual attributes of the spheres such as size, roughness, and glossiness. A subsequent psychophysical study showed that observers were unable to consistently distinguish between generated and rendered images.
Despite the advancements in the prior works, several open questions remain. One critical question is whether StyleGAN2-ADA can generalize to optical parameter values beyond those used in training. Additionally, while latent spaces are effective for controlling image generation, the inverse mapping from a reduced latent space to the original optical parameters has not been fully explored. Addressing these challenges is essential to understand the perceptual validity of StyleGAN2-ADA and its ability to replace physically based rendering workflows [9, 37].
Deep generative models, especially StyleGAN2-ADA, were shown to generate a compact feature representation space of glossy and translucent appearance correlated with human perception. Considering the previous literature, this work aims to create and assess a navigable space for translucency and gloss appearance. StyleGAN2-ADA is trained on a larger dataset in comparison with that used by Nimma and Gigilashvili [30]. The dataset includes many materials with a broad range of gloss and translucency, multiple shapes, and illumination directions. Unlike Liao et al. [27], we used rendered images to have a full control of the range of optical properties and illumination directions (see Figure 1). The latent space of the trained model is visualized by reducing the dimension of the feature vectors from 512 to only 2. Previous work has shown that high-dimensional appearance spaces are highly impractical for human use for navigation, appearance manipulation, and difference measurements [14]. First, we visualize whether the latent space exhibits meaningful disentanglement of shape, illumination direction, and various optical properties. Four psychophysical experiments were then conducted to quantify perceived translucency, gloss, lightness, and illumination direction in different regions of this latent space.
To further assess the practical robustness and applicability of our latent representation for perception-aware navigation of the space beyond the training set, an additional dataset was introduced, which extends the optical parameters beyond the original ranges, providing a rigorous evaluation of the generalization capabilities of the StyleGAN2-ADA model. Moreover, inverse mapping from latent vectors reduced by principal component analysis (PCA) back to the original optical parameters is explored to bridge intuitive latent-space navigation with explicit parameter-based image synthesis.
A simplified schematic representation of the entire workflow is given in Figure 2. The primary novelty and contributions of this work are as follows:
(1)
We explore the latent-space structure that covers a broad range of gloss and translucency appearance to analyze whether and how it disentangles shapes and optical material properties.
(2)
We use psychophysical evaluation to understand the perceptual uniformity of the latent space. Similarly to color spaces, uniformity, that is, equal geometric distances throughout the space corresponding to equal perceptual differences, would be an important feature for the appearance spaces to simplify appearance comparison and manipulation. Several works have attempted to craft latent representations of either gloss [16, 45] or translucency [26]; however, to the best of our knowledge, this is the first study to simultaneously explore perceptually navigable latent-space representations for both gloss and translucency while also addressing lightness, shape, and illumination direction.
(3)
We test generalization capabilities beyond the training and test dataset materials.
(4)
We evaluate to what extent we can robustly map back to optical properties from the 3D projection of the latent space, and hence replace lengthy physically based path tracing rendering with an interpretable deep generative model.
(5)
Finally, we evaluate whether navigable latent space can exist in reasonably low dimensions.
2.
Methodology
This section outlines the steps taken to achieve the representation space for gloss and translucency appearance. We first discuss how the image dataset was created and explain the reasoning behind the decisions in the dataset preparation process. Afterward, we detail the model selection and the learning process, followed by dimensionality reduction, and conclude with the procedures of the psychophysical study.
2.1
Dataset
The first dilemma when constructing the dataset was between capturing photographs of real-world objects as done by Liao et al. [27] and rendering synthetic images as done by Storrs et al. [36] and Nimma and Gigilashvili [30]. On the one hand, rendered images lack imperfections that are visible in real-life objects, and we may generate virtual materials that do not actually exist in real life. On the other hand, rendering allows a full control over the intrinsic and extrinsic properties of the scenes and materials. This allows adding diversity and completeness to the dataset, which is beneficial for deep generative models to construct a rich and well-developed latent representation. Photographs of real-world objects do not allow for fine-grained control of the intrinsic and extrinsic parameters. It is difficult to obtain materials of many different combinations of optical properties with real-world objects without an expensive fabrication process, which is also less sustainable. Besides, it is straightforward to link both the latent representation and the perceptual attributes back to the optical properties while complex optical measurements would be needed for real objects to recover their properties.
For those reasons, physically based rendering was chosen to generate the dataset for training the deep generative models. The dataset was rendered using Mitsuba 3 Physically Based Renderer [19]. The dataset can be divided into two parts: one with fixed lighting and one with varying lighting direction. The fixed lighting set contains three shapes: a sphere, a cube, and a Stanford Bunny—consisting of 8712 images (2904 per shape); the varying lighting set consists of only one shape—a sphere—including 7920 images (for five different lighting directions). In total, 16,632 images were rendered. All images have a resolution of 256 × 256 pixels and were rendered with 16,384 samples per pixel. It took approximately 6 weeks of constant rendering to render the whole dataset. Mitsuba’s default tonemapper was used to tonemap from HDR to SDR PNG images. Bernhard Vogl’s light probe At the Window was used as an environment map. The objects were placed on a surface instead of floating in the air because caustics cast by the objects have been demonstrated to be important cues to material appearance [10, 13]. We picked a checkerboard pattern with high-contrast edges to facilitate judgment of see-through cues. Mismatch between the direct background and the illumination may undermine the realism, but we wanted to keep our results comparable to the previous studies using the same background [11, 30].
In Mitsuba 3, the volumetric path tracer with a spectral multiple importance sampling integrator was used. Mitsuba’s rough dielectric surface scattering model and homogeneous participating medium were used for surface and subsurface scattering, respectively. For both datasets, four parameters were varied: wavelength-independent extinction coefficient (σT) from 0 to 5 with an interval of 0.5–11 values in total; subsurface scattering albedo from 0 to 1 with an interval of 0.2–6 values (it is worth mentioning that when σT = 0, change in albedo has no effect on the appearance); wavelength-independent Index of Refraction (IoR) from 1.1 to 2.0 with an interval of 0.3–4 values for the fixed lighting set, and from 1.4 to 2 with an interval of 0.3–3 values for the varying lighting set (surrounding medium was assumed to be vacuum with IoR = 1); surface roughness (α) from 0 to 1 with an interval of 0.1–11 values for fixed lighting, and from 0 to 0.8 with an interval of 0.1–9 values in total for the varying lighting set. Additionally, the illumination direction was varied in the latter set by rotating the illumination map from 0 to −90 with an interval of 22.5, yielding five different illumination geometries in total. The values are chosen to maximize the variance in the dataset for training StyleGAN2-ADA while also keeping the rendering times feasible.
Each set of shapes was rendered with all possible combinations of the values of the chosen optical parameters; for example, when we had 11 σT, 6 albedo, 4 IoR, and 11 α values, the cartesian product gave in total 2904 combinations, that is, 2904 distinct images per shape. These specific values of the optical parameters for the rendering were selected to maximize the presence of glossy, translucent, transparent, matte, and opaque appearances in the dataset while also keeping the size of the dataset and hence the rendering time within reasonable limits. Figure 1 shows representative examples from the dataset. More examples can be found in Figure S.1.1. in Supplementary Material S1.
Figure 1.
Examples of the shapes and materials from our dataset. A sphere is thick with highly curved surface, highly glossy and transparent with little surface and subsurface scattering. A cube is thick with flat surface, translucent with high surface and low subsurface scattering. The bunny covers a range of thick and thin parts with complex surface geometry, with high surface and subsurface scattering, and translucency varies with thickness and geometry.
Figure 2.
A simplified schematic representation of the workflow.
To evaluate the generalization capability of the StyleGAN2-ADA model beyond the initial dataset, an additional dataset comprising 625 images was rendered. This new dataset systematically explores optical parameters extending beyond the original ranges, effectively acting as unseen test data through both interpolation and extrapolation scenarios. The dataset covers wider values for extinction coefficient (σT), albedo, internal IoR, and surface roughness (α), including parameter combinations never encountered by the model during training. The specific original and extended ranges are summarized in Table I. Each parameter set was used to render images of the Stanford Bunny under uniform lighting, ensuring consistent comparisons. This enables quantitative evaluation of generative accuracy and inverse mapping performance, benchmarking StyleGAN2-ADA-generated images against physically based renderings. Examples of rendered images can be found in Figure S.1.1(d) in Supplementary Material.
Table I.
Optical parameter ranges for training dataset versus additional generalization dataset.
ParameterOriginal rangeExtended range (unseen data)
Extinction coeff. (σT)0.0–5.0 (step 0.5)1.25, 3.25, 4.75, 6.0, 7.0
Albedo0.0–1.0 (step 0.2)0.3, 0.7, 0.9, 1.2, 1.3
Internal IoR1.1–2.0 (step 0.3)1.2, 1.5, 1.8, 2.2, 2.4
Surface roughness (α)0.0–1.0 (step 0.1)0.25, 0.55, 0.85, 1.1, 1.2
2.2
Model Training and Selection
2.2.1
StyleGAN2-ADA
To create the latent representation, StyleGAN2-ADA [20] was chosen as a deep generative model. It is a GAN consisting of two convolutional neural networks (CNNs). One is the generator that synthesizes images from random noise that belong to the distribution of the training set. The other is the discriminator, which distinguishes between the real images of the training set and the fake images generated by the generator. The generator’s task is to fool the discriminator so that it predicts that the images synthesized by the generator are real. In this way, both CNNs participate in a zero-sum minimax game against each other. Specifically, the generator has to maximize the adversarial loss, and the discriminator has to minimize it. During training, the loss oscillates until an equilibrium is reached. In this way, the model learns to capture the distribution of the training images, and the generator learns to synthesize an image from any point in the latent space.
StyleGAN2-ADA is an improvement of the StyleGAN2 [22] model, which itself is the successor of the StyleGAN model [21]. StyleGAN improves the GAN architecture by introducing a mapping network that maps the random noise vector Z to an intermediate latent representation W using an 8-layer fully connected network. This mapped W space better disentangles the different features of the synthesized image. StyleGAN2 rearranges the modules in the architecture to improve the quality of synthesis. StyleGAN2-ADA introduces the Adaptive Discriminator Augmentation (ADA) technique that allows it to be trained on smaller datasets. The ADA achieves this by augmenting the training images with different types of transformations to increase the size of the effective training set. At the same time, it prevents these augmentations from leaking into the latent representation of the model.
The W space of the StyleGAN2-ADA model is the latent space considered in this work. It is a 512D space that is inserted into each module of the generator. By manipulating this vector, the aspects of the resulting image can be changed. Each latent vector corresponds to an image in the latent space of the model. The generator will always generate the same image from a latent vector unless further steps of backpropagation are carried out.
2.2.2
Model Training
Two StyleGAN2-ADA models were trained: one on the fixed lighting set (referred to as Model 1) with three shapes, and the other on the multiple light direction set (referred to as Model 2) with only spheres. The pretrained weights from the StyleGAN2-ADA model trained by Nimma and Gigilashvili [30] were used to initialize both models. Nimma and Gigilashvili [30] trained their model on a rendered set of images of spheres with varying optical parameters. Their images were also rendered using Mitsuba.
Model 1 was trained on the uniform lighting (i.e., fixed across the images) dataset for 1000 kimg, and Model 2 was trained on the multiple lighting dataset for 5000 kimg. One kimg corresponds to the discriminator seeing 1000 real images. The uniform lighting dataset was able to converge in 1000 kimg due to using the pretrained weights that were obtained by training on a similar dataset by Nimma and Gigilashvili [30]. It took 11 hours in total. However, the dataset with multiple lighting directions needed to be trained for 5000 kimg because it also had variation in the lighting conditions for which the pretrained weights were not optimized. This model took 48 hours to converge. Two gamma values were tested. A gamma value of 0.8, which is the default value, was found to be the best performing one. A gamma value of 10 was also tested, which is the recommended value by Karras et al. [20], but it did not perform well. The gamma hyperparameter controls the strength of regularization of the model. Higher values reduce the chance of overfitting. Furthermore, the augmentations used by Liao et al. [27] were tested and found to improve performance compared to the default augmentations. All other hyperparameters were kept as default.
To assess the generalization, Model 1 was used to synthesize 625 images for unseen parameter combinations. The resulting pairs of GAN-generated and Mitsuba-rendered images enabled a controlled evaluation of the model’s performance on unseen data.
2.3
Dimensionality Reduction and Visualization
The latent vectors generated by the model are 512-dimensional. The PCA was used to reduce the dimensionality to two dimensions. The PCA is a linear unsupervised dimensionality reduction technique that finds the orthogonal projection of the data with the highest variance while reducing information loss. It captures the global structure of the data, and it is suitable for data analysis and reducing noise in the data. Other approaches for dimensionality reduction, such as T-SNE and UMAP, were also considered. The T-SNE and UMAP are non-linear techniques. Although more sophisticated, T-SNE and UMAP are not suitable for analytical purposes [6, 7, 23]. They are also non-deterministic and thus the results are dependent on the initialization, which makes them less reproducible. Furthermore, they require tuning parameters such as perplexity to produce good results. On the other hand, PCA is a linear and deterministic approach. It is explainable, and due to its deterministic nature, the results are always the same if the input is the same. It also does not require parameter tuning to produce good results. Considering these points, PCA was chosen to reduce the dimensionality.
The trained models were used to generate the latent vectors for the whole dataset on which they had been trained on. StyleGAN2-ADA provides the tool to find and then generate the latent vector corresponding to the query image. It works by generating an image using the generator, computing a distance loss between the generated image and the query image, and then using backpropagation to move in the direction in the latent space that makes the generated image more closer to the query image until the distance becomes very small. The latent vector at the point of convergence is the latent vector corresponding to the query image. Once the latent vectors for all 16,632 images were generated, PCA was applied to reduce the latent vector from 512D to 2D. The datasets of the two models were treated separately.
In addition to visualization, the PCA-reduced latent space also serves as the foundation for inverse mapping. Specifically, a 3D PCA representation was used to project new points and recover the corresponding full 512-dimensional latent vectors via inverse transformation. These recovered latent vectors were then mapped to optical parameters using a trained regression model, enabling the generation of physically based images in Mitsuba. This process allows for a direct comparison between GAN-generated outputs and physics-based renderings.
The workflow begins by randomly sampling points from a 3-dimensional PCA space that represents the underlying structure of gloss and translucency appearance. These sampled points are processed through two parallel pathways. In the first path, each PCA sample is mapped back to the full 512-dimensional latent space of StyleGAN2-ADA using the inverse PCA transformation, and an image is synthesized purely from the model’s learned generative prior. In the second path, the same PCA point is interpreted as a set of high-level physical descriptors, where a neural network predicts the corresponding optical parameters, including σt, albedo, IoR, and roughness α. These parameters are then passed to the Mitsuba renderer to produce a reference image based on physical light transport. The resulting images from both paths are evaluated using objective image quality metrics (SSIM [44], PSNR [44], LPIPS [47]) to quantify the perceptual and structural similarity between the StyleGAN2-ADA output and its physically based counterpart.
2.4
Psychophysical Experiment
Four psychophysical experiments were conducted. The psychophysical study aimed to reveal how the magnitudes of the perceived attributes vary in the latent space and whether those changes are predictable and linear in its low-dimensional representation. Systematic sampling along the axes should have revealed whether the change in the axial coordinates correspond to consistent perceptual variations. In all experiments, the images shown were generated by the trained models. All experiments were conducted using the QuickEval web-based tool [43] on a color-calibrated display under controlled conditions. Twenty observers participated in the experiments. They were all graduate students of color science and took around 50 min to complete all parts.
2.4.1
Psychophysical Experiments 1–3: Scaling Translucency, Gloss, and Lightness
We conducted three magnitude estimation experiments to scale perceived translucency, gloss, and lightness in different parts of the latent space. In total, 160 images were shown from both models. The observers were asked to rate the object inside the test image on a scale of 1 to 10, where 1 corresponds to opaque/matte/dark and 10 corresponds to transparent/highly glossy/light in the three experiments separately. Each trial included a reference image illustrating the different extremes (opaque and transparent; matte and glossy; dark and white objects). The observers underwent training before each experiment, where the scaled concepts were explained and examples were shown. The observers were explicitly instructed to evaluate only the specific attribute that the respective experiment was about and to ignore other appearance factors as much as they could. More details about the experimental interface can be found in Figure S.2.1. of the Supplementary Material.
2.4.2
Psychophysical Experiment 4: Determining Light Direction
This was a category judgment experiment, where 40 images generated by the model trained on the multiple light direction dataset were shown. Observers were given four options to choose the primary direction where the light was shining toward the object: Left Side of the Object, Behind the Object on the Left Side, Behind the Object on the Right Side, and Right Side of the Object. Similarly to previous experiments, the observers were instructed about lighting directions and how they are set up inside the renderings. They were also told that the directions of light vary on the X and Y axes and not on the Z axis. Here the Z axis refers to the vertical axis. The observers were also made aware of this. Two reference images for each extreme were shown both for glossy and matte objects.
2.4.3
Sampling the Dataset for Psychophysical Experiment
The dataset was sampled to a smaller subset of images to be included in the experiments.
The number of images sampled from the latent space of Model 1 was 120 and that from the latent space of Model 2 was 40, giving a total of 160 images. Two kinds of sampling were performed; both assumed a uniform distribution over the input. One was random sampling, and the other was randomly sampling points that vary only along one axis—meaning points on straight lines parallel to both axes separately. For each shape, 20 points were randomly sampled from the whole cluster and 20 points were randomly sampled from the points inside the cluster whose locations lay on a straight line parallel to the principal axis of the 2D latent space. The reason for sampling points that lie along (parallel to) the axis was to measure how the various optical and perceived parameters of each varied as compared to their location in the latent space. These points helped to calculate the correlation among different parameters and rates of change to understand the surface of the latent space.
Figure 3 shows the sampled data points from the latent space of Model 1. Figure 3(a) shows the points that were randomly sampled for each shape cluster. This was performed to obtain points that represent each shape cluster and capture its variance. Figure 3(b) shows the sampled points that lie on a straight line along the principal axis. Each cluster was visually inspected and its midpoints were identified. The midpoint of the sphere cluster is located at (−3, 7), for the cube it is at (11, −1), and for the Stanford bunny it is (−6, −7). The points of each cluster were filtered so that only the points that had an X axis similar to or close to (rounded to one decimal point) the identified X axis and the points that had a Y axis similar to or close to the identified Y axis were included. Then a uniform random sampling was performed on this filtered list of points. For example, considering the sphere cluster, all points that had an X axis of −3 were put in a list and all points that had a Y axis of 7 were put into another list. These two lists were combined. Then, a uniform random sampling was performed to select 20 samples from this combined list. This procedure was performed on the other shape clusters as well as the cluster in the latent space of Model 2. This kind of sampling was performed to obtain points that capture the rate of change of various parameters of the data points. The parameters can include optical parameters and results of the perceived attributes of the psychophysical experiments and also the axis of the latent space itself. Sampled data from the latent space of Model 2 is illustrated in Figure S.3.1(d–f) in Supplementary Material.
Figure 3.
Sampling for Model 1. (a) A uniform random sampling was applied to each cluster to select points that represent the distribution of that cluster (60 points, 20 per shape). (b) The midpoints of each cluster were identified. Then the points that lie on the locations parallel to the principal axes were randomly sampled (60 points). The axes correspond to the two orthogonal bases that have the highest explained variance of the 512-dimensional latent space obtained using PCA.
2.4.4
Experimental Setup
The psychophysical experiments were conducted on a 24′′ Samsung T37F LED display calibrated for the sRGB color space with a gamma of 2.2, 5700 K reference white, and 80 cd/m2 of maximum luminance. The sRGB color space was chosen because the image part of the experiment is encoded in that color space. The vertical illuminance measured with a lux meter was 6.4 lux in front of the observer looking at the display at a distance of 1.6 m and 0.5 lux elsewhere in the room. Informed consent to voluntary participation was obtained from the observers. They were informed about the experiment and how the data would be processed. During the experiment, no personal data was collected except age.
2.4.5
Data Processing
To aggregate the magnitude estimates and obtain a single value for each image, the geometric mean (to mitigate the bias due to potential outliers) over all 20 observers’ estimates of translucency, gloss, and lightness was calculated for each experiment separately. The categorical labels were converted to numerical values: Right Side of the Object  = 1, Behind the Object on the Right Side  = 2, Behind the Object on the Left Side  = 3, and Left Side of the Object  = 4.
3.
Results
This section discusses the evaluation of the generation quality of the trained models as well as their latent space to determine how the model has structured the optical parameters and perceived attributes. Exploratory data analysis was performed and correlations were found among the latent space, optical parameters, and perceived attributes.
3.1
Model Synthesis
Four sets of hyperparameters for training the StyleGAN2-ADA model were tested and the best performing set of hyperparameters was selected based on the Frechet Inception Distance (FID) and the Kernel Inception Distance (KID). The hyperparameters tested were as follows. Experiment 1: default configuration (as set by the authors of StyleGAN2-ADA [20]). Experiment 2: using gamma = 10 as recommended by Karras et al. [20]. Everything else was default. Gamma is a hyperparameter that controls the strength of the R1 regularization applied to the discriminator to prevent it from overfitting. Experiment 3: using the set of augmentations by Liao et al. [27] and using the default gamma  = 0.8. Everything else was default. Experiment 4: using the set of augmentations by Liao et al. [27] and using gamma  = 10. The detailed information on the obtained FID and KID scores can be found in Figure S.4.1. of the Supplementary Material. Experiment 3 achieved the lowest FID and KID scores. Hence the model obtained by training with the hyperparameters of Experiment 3 was chosen as the candidate model. The model trained on the multiple lighting direction set also used the same hyperparameters.
To assess the quality of the synthesis, the images were first synthesized by random input noise vectors. The results are illustrated in Figure 4 (more examples in Supplementary Figure S.5.1.). Although some images look adequate, morphing artifacts can be noticed in others. The latent vectors located at the edge of clusters of two shapes result in a morphed image that has the characteristics of both shapes. The latent space arranges shapes as separate clusters, and the areas between those clusters do not result in realistic images. Shape morphing is absent in Model 2 because only one shape was part of this training dataset. Some morphing artifacts can be still noticed where one half of the image is lighter than the other, but it is less noticeable than the artifacts from Model 1 (see Supplementary Figure S.6.1.).
Figure 4.
Outputs from performing random synthesis using the model trained on fixed lighting set. The shape morphing artifacts are visible for examples marked with a red frame. Other than that, the vast majority of the images generally look convincing.
On the other hand, the model synthesized images similar to the training set with high fidelity. Figures 5 and 6 illustrate the examples. Translucency (Fig. 5(a)–(c)), gloss (Fig. 5(d)–(f)), lightness (Fig. 5(g)–(i)), and lighting direction (Fig. 6) are all generated faithfully. The only exception is the case of highly transparent see-through objects that appear more hazy and translucent than they should (leftmost column in Fig. 5(a)–(c)). Seemingly, the model did not accurately learn see-through cues of the distorted background due to scarcity of such materials in the training set.
Figure 5.
Comparing rendered objects and their counterparts generated by the models (Model 1). The model can accurately reproduce appearance except for very transparent see-through objects (see red frame). The optical parameters of the rendering are displayed on top of each column in (σT)_(albedo)_(IoR)_(α) format. R and G denote rendered and generated rows, respectively.
Figure 6.
The results for the lighting direction (Model 2).
3.2
Structure of Latent Space
3.2.1
Disentanglement of Physical Attributes
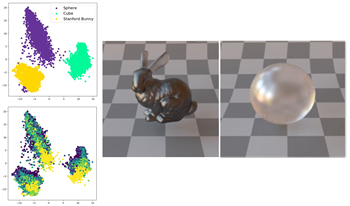
Figure 7(a) shows the visualization of the latent space of Model 1. The model has formed three distinct clusters for the three different shapes in the latent space, indicating that the model has captured the shape difference well. The albedo, IoR, and α values are separated within each shape cluster. In each cluster, the albedo seems to have higher values toward the decreasing Y axis. However, for α and IoR, each cluster has placed the extreme values at slightly different locations. For α, the higher values are placed generally toward the increasing Y axis, but inside the bunny-shape cluster, the high values are placed toward the negative X axis direction while in the cube cluster, they are placed toward the positive X axis direction. This is true for IoR as well. Inside the sphere cluster, the high values of IoR and α are placed toward the increasing Y axis direction. Finally, σT does not have a discernible pattern. It is possible that the variation of the values is more visible in 3D or higher dimensions.
Figure 7.
Latent-space visualization of the 2D latent vectors for Model 1 (a) and Model 2 (b). In each plot, the latent vectors are labeled by their respective optical parameters, shape, or lighting direction (where applicable). The axes correspond to the two orthogonal bases with the highest explained variance of the 512D latent vectors as obtained using PCA. Each scatter plot contains 8712 points for Model 1 and 7920 points for Model 2.
Figure 7(b) shows the visualization of the latent space of Model 2. Since there is only one shape in this dataset, the latent space also has one large cluster. The albedo, α, and light direction have distinct extremes. The IoR has an oscillating pattern where the value varies from high to low in the diagonal direction from the positive Y axis and negative X axis to the negative Y axis and positive X axis (from top left to bottom right). Both models have learned to disentangle the albedo, α, and light direction parameters in 2D. Model 1 has learned to also disentangle the IoR parameter as well as the shape. The latent space of the model captures the variation in intrinsic and extrinsic properties of the dataset and can distinguish between them, indicating that the models have learned the statistical structure of the images inside the training dataset.
It is interesting to understand whether the latent space is linear or non-linear with respect to the optical parameters. For this, data points that lie on a straight line parallel to the principal axes were considered, and their coordinates in the latent space were plotted as a function of optical properties. Additionally, the Pearson correlation coefficient and the distance correlation [39] were calculated.
Figure 8(a) shows the relationship for sphere between the optical parameter values and the X axis values of the data points that lie on a straight line along the X axis inside the latent space of Model 1 (for other shapes, see Figure S7.1. in Supplementary Material). Observing the figure, σT has a non-linear correlation with the X axis in the sphere and cube clusters. The distance correlation is 0.44 for sphere and 0.40 for cube while the R coefficient is −0.14 for sphere and 0.15 for cube. It has a linear correlation in the bunny cluster. The albedo has a linear positive correlation in the cube cluster and a slight negative non-linear relation in the bunny cluster. Moving on, the IoR has a slight positive non-linear correlation in the bunny cluster and a linear one in the cube cluster. Figure 8(b) shows the relationship between the optical parameter values and the Y axis values. It is observed that σT has a strong positive linear correlation and albedo has a strong negative linear correlation inside the sphere cluster. The IoR and α have a negative non-linear relationship with the Y axis inside this cluster. The albedo has a strong linear relationship in the sphere and cube clusters. As in the case of the X axis, here the IoR also has a positive linear correlation in the cube cluster. However, the relationship in the bunny cluster is not indicative of correlation. Moreover, there is a negative non-linear correlation in the sphere. Finally, α is non-linearly related in the sphere and bunny groups. Overall, σT and α have a non-linear rate of change as compared to the X and Y axes. The IoR changes positively and linearly inside the cube cluster on both the X and Y axes of the latent space.
Figure 8.
Scatter plots considering only the points that vary along the X axis (a) and Y axis (b) of the latent space of Model 1. The Pearson coefficient and the distance correlation are calculated and shown inside the plots.
Figure S7.2. in Supplementary Material shows the results for Model 2. The albedo has a positive linear correlation with its X and Y axis locations. Similarly, α also has the same relation. The light direction is inversely correlated with the X axis of the latent space and positively correlated with the Y axis of the latent space. In general, the optical parameters demonstrate mostly linear correlation inside the latent space of Model 2.
3.2.2
Perceptual Navigability of Latent Space
Figure 7 illustrates that the latent space disentangles shape, lighting direction, and many optical properties reasonably well. However, as mentioned in Section 1, the correlation between optical properties and perception is not straightforward. We conducted psychophysical experiments to explore how perceived attributes change in the 2D latent space. Figure 9 shows the magnitude estimates of the perceived attributes of translucency, gloss, and lightness for Model 1. The observers have rated almost all of the data points as having lower than 4 translucency (on a 1–10 scale). However, there is a pattern to the location of the values. Higher values tend to be located toward the negative Y axis. This pattern is consistent with the distribution of the albedo. Similarly to translucency, observers have given an overall low rating to gloss. In the bunny cluster, the few high values are grouped at the rightmost edge of the cluster toward the positive X axis. In the sphere cluster, higher values are in the middle, whereas for the cube no data point was rated above 6. There is also a negative correlation between gloss and α. Finally, perceived lightness has a prominent pattern with high values generally toward the negative Y axis direction similar to the albedo, which is logical, since high albedo objects usually appear lighter due to subsurface scattering. The low scores for perceived translucency verify the findings that the model is incapable of synthesizing transparent and close-to-transparent appearance.
Figure 9.
Latent space of Model 1. The data points are labeled with the respective perceived attribute magnitudes. The axes correspond to two of the orthogonal bases that have the highest explained variance of the 512D latent vectors using PCA.
The results for Model 2 are given in Supplementary Material S8. As for perceived translucency, the trends are similar here with overall low ratings. Some high values are seen in the bottom left corner of the cluster. The perceived gloss has the same pattern but with more ratings that are higher than 6. The perceived lightness has higher values toward the middle of the cluster and in the positive X axis direction, correlating with the albedo. The perceived light direction has a high correlation with the light direction parameter, indicating that the model has captured the light direction extrinsic parameter well and also that the observers were able to mostly successfully predict the directions. Figures S.9.1. and S.9.2. of the Supplementary Material show similar plots including only the data points that lie on a straight line parallel to the principal axes, which makes the trends easier to spot.
To gain a deeper insight into perceptual navigability of the latent space, latent-space coordinates were plotted as a function of perceived attribute magnitudes and correlations were found among them. A similar study on the correlation between optical and perceptual properties can be found in Section S11 and Figures S.11.1.–S.11.4 of the Supplementary Material. Figure 10(a) shows the relationship between the perceived attribute values for a sphere and the X axis values of the data points that lie on a straight line along the X axis inside the latent space of Model 1 (the results for other shapes are illustrated in Supplementary Material S10). The perceived translucency inside the sphere and cube clusters is the only strong linear correlation while the perceived gloss inside the sphere and cube clusters shows a non-linear correlation. The perceived lightness scatter plots are chaotic and do not exhibit a relation. Figure 10(b) shows the relationship for the Y axis (Supplementary Material S10 for cube and bunny). The perceived lightness has a strong negative correlation with the Y axis of the latent space inside all shape clusters. Similarly to the observation in the X axis, the perceived gloss shows a slight non-linear correlation in the sphere and cube clusters. The perceived translucency shows a reduced correlation strength within the cube group compared to the same relationship with the X axis. In general, the perceived translucency exhibits linear correlations in the X axis. The perceived gloss has a non-linear relation and the perceived lightness has a linear correlation with only the Y axis.
Figure 10.
Scatter plots considering only the points that vary along the X (a) and Y axes (b) of Model 1. Relationships are shown between the estimates of the perceived attributes and the respective coordinate in the latent space. The Pearson coefficient and the distance correlation are calculated and shown inside the plots.
The results for Model 2 are shown in Supplementary Figure S.10.1(g)–(h). The perceived gloss shows a strong negative linear correlation with both axes. The perceived translucency has a non-linear relationship with both axes. There is a positive linear correlation between the perceived lightness and the X axis of the latent space. Finally, the light direction is non-linearly related to the X axis and has a linear relation with the Y axis.
3.2.3
Generalization to Unseen Data
To assess the generalization ability of StyleGAN2-ADA beyond its training distribution, we evaluated 625 unseen parameter combinations by comparing GAN-generated outputs with Mitsuba-rendered ground truths. The results showed that the model was generally capable of producing images with high perceptual and structural similarity for parameters interpolated between seen data as well as for those extrapolated beyond the training range. Quantitative metrics support this: the SSIM achieved a median of 0.875, indicating strong alignment in geometry and fine image structures. The PSNR values were more variable, reflecting differences in brightness and pixel level fidelity, yet remained centered around 18.12 dB, which is within an acceptable range for high-quality synthesis. The LPIPS scores, which assess perceptual similarity using deep features, were consistently low for most images, affirming that the GAN captured perceptually important aspects such as gloss and translucency. A small subset of outliers showed poor alignment, often with low SSIM and high LPIPS, which correspond to extreme parameter combinations that were intentionally chosen to lie outside the training distribution. Importantly, these combinations resulted in physically implausible appearances (e.g., albedo > 1), which resulted in highly noisy Mitsuba renderings. The GAN’s failure to replicate them is consistent with the expectation that the model should not generalize to implausible material configurations. Thus, these misalignments serve not as failures but rather as further validation that the model has learned a grounded, perceptually coherent generative prior. The histogram in Figure 11 confirms this trend, with the majority of examples falling within a high-quality perceptual and structural range.
Figure 11.
Histograms of SSIM, PSNR, and LPIPS across all 625 GAN-generated images compared with Mitsuba-rendered ground truths. Blue bars show the full dataset and red overlays highlight the outliers we focus on (albedo 1.2–1.3; n = 250), which are outside the training range and produce the most visible artifacts. Most images fall within a high-quality range across all metrics while the highlighted outliers drive the low-SSIM/PSNR and high-LPIPS tails. Higher is better for SSIM and PSNR; lower is better for LPIPS.
3.2.4
How Many Dimensions Are Sufficient?
To evaluate whether StyleGAN2’s latent-space projection retains sufficient structure for interpretable parameter recovery, we attempted to reverse-map 3D PCA-reduced latent vectors back to the original optical parameters (σt, albedo, IoR, α) used in Mitsuba rendering. We expected that 3D better captures the data structure than 2D while still remaining user-friendly and human-intelligible. Initial analysis revealed that the first three PCA components together explained only 25.48% of the variance in the 512-dimensional latent space, indicating substantial information loss. Figure 12 illustrates the cumulative variance curve, showing that as many as 219 components are needed to capture 95% of the variance, highlighting the high-dimensional complexity of the latent space. Regression models trained on the 3D PCA vectors, ranging from linear methods to random forests, achieved limited success (Table II) in predicting optical material properties, with the best model (random forest) yielding an R2 of 0.77 but still suffering from inaccurate predictions. Even neural networks trained on 3D PCA inputs exhibited significant gaps between training and validation performance and consistently collapsed toward predicting midrange parameter values (Table III), confirming underfitting. These issues were partially resolved by increasing the dimensionality: using 220 PCA components dramatically improved performance, reducing mean squared error from 0.34 to 0.013 and mean absolute error from 0.31 to 0.06. However, despite improved metric scores (SSIM  = 0.90, LPIPS  = 0.084), color comparison (Table IV) revealed perceptual mismatches between GAN- and Mitsuba-generated images, particularly in hue and translucency. We hypothesize that the variation in hue in generated images is due to the interpolation of the pixel values. The training dataset consists of colors that are different shades of gray from very dark to very bright images. When images from the trained StyleGAN2-ADA latent space are generated, they can be sampled from a location that is in between a bright image and a dark image, generating an interpolated image in terms of pixel values, leading to the appearance of hues that were not initially present in the dataset. This morphing has also been demonstrated in [33]. The role of the light probe whose mirror reflections are visible in highly glossy images also cannot be ruled out. These findings confirm a fundamental limitation: although StyleGAN2-ADA’s latent space can encode meaningful visual information, heavily reducing its dimensionality, even to enable intuitive PCA navigation, results in the loss of excessive information to accurately reconstruct physical parameters, making such mappings unreliable without retaining a large portion of the original latent structure. Even though 2D PCA disentangles the attributes to an extent sufficient for qualitative exploration, it is too lossy for accurate mapping back to the optical properties. When many physical parameters vary, mapping to a low-dimensional space is non-injective, that is, a set of coordinates in the low-dimensional space may not map to the unique set of optical properties, making reversing impossible.
Figure 12.
Cumulative explained variance by PCA components. The first three components account for only 25.48% of total variance while 219 components are needed to reach 95%. This highlights the high dimensionality of the latent space and the significant information loss when reducing to 3D.
Table II.
Comparison of 3 PCA versus 220 PCA results.
Metric3 PCA220 PCA
Overall MSE0.3386130.012917
Overall MAE0.3149070.061780
Sigma T MSE0.033033
Albedo MSE0.016024
Internal IoR MSE0.001390
Alpha MSE0.001222
Table III.
Predicted versus actual parameter ranges: neural networks on 3D PCA.
ParameterPredicted rangeActual range
Sigma T0.70–0.903.83–5.89
Albedo0.46–0.560.84–0.91
Internal IoR1.76–1.911.96–2.03
Alpha0.47–0.520.73–0.77
Table IV.
Comparison metrics between Mitsuba and StyleGAN2 renderings for five test cases. Higher values are better for SSIM and PSNR while lower values are better for MSE, MAE, and LPIPS. Despite good structural similarity (SSIM > 0.89) and perceptual similarity (LPIPS < 0.1), color analysis reveals notable differences.
PairSSIMPSNR (dB)MSEMAELPIPS
10.899617.4384112.723032.15210.0861
20.910218.3183113.099329.67140.0759
30.908918.0350113.998630.59110.0795
40.897717.7378111.161831.19340.0936
50.907518.2048113.295330.03120.0848
Color Analysis
Delta E: 9.8280
Channel differences (out of 255):
red, 30.6630; green, 29.7446; blue, 29.7756
4.
Discussion and Conclusions
The objective of this work was to create a representation space for the appearance of translucency and gloss. Additional attributes that were explored were lightness, shape, and lighting direction. The works of Storrs et al., Liao et al., and Nimma and Gigilashvili [27, 30, 36] were used as the basis for the methodology. A large-scale dataset consisting of 16,632 images and three different shapes was rendered and used for training two deep generative models. The 512D latent vectors of each image in the rendered dataset were generated by an optimization process. To make the latent space navigable and intelligible to human users, dimensionality reduction using PCA was performed on 512D latent vectors to reduce them to 2D latent vectors (3D for inversion experiments). For every latent vector, its optical parameters are available as labels. Four psychophysical experiments were conducted to obtain perceptual estimates of translucency, gloss, lightness, and light direction. Finally, equipped with optical and perceptual labels, the latent space of the two models was analyzed. The main observations are as follows:
The model is well developed and was capable of synthesizing high-fidelity images, with an exception of highly transparent materials.
The model clearly separated the shapes and produced convincing results within the boundaries of each cluster, but intercluster areas of the latent space produced morphing artifacts and odd shapes—such as round cubes, elongated spheres, and spherical bunnies. The morphing ability is, however, desired for generalization from a discrete set of shapes to endless variations encountered in natural scenes.
The optical parameters were also disentangled, with extreme values appearing at opposite ends of the clusters. An exception to this was the σT optical parameter. One reason for this could be the fact that the σT cluster actually extends upward in higher dimensions. However, poor disentanglement of σT is intuitive and expected from the visual point of view. Higher albedo is usually associated with lighter appearance and high surface roughness with blurrier and hazier appearance; high IoR produces more vivid reflections, and such attributes hence are easier to distribute in a meaningful arrangement. On the other hand, objects with a given σT can exhibit a very large range of different appearances depending on albedo and other parameters, which makes it difficult to isolate the effect of σT.
The perceived attributes were also separated by the model with extreme values appearing at the opposing ends of the clusters.
The correlation plots showing the relationship between the optical parameters and perceived attributes verified that the model can synthesize perceptually plausible images that correspond to the expected appearance for certain values of specific optical parameters. For instance, a high α corresponded to a low perceived gloss, which was expected as surface roughness blurs the reflected image and is known to be negatively correlated with gloss.
The manifold of the latent space in terms of optical parameters and perceived attributes was analyzed by plotting correlation plots between those parameters and latent-space coordinates. Model 1 was highly non-linear. This is consistent with the non-linearity observed in the HVS, which follows non-linear response functions (e.g., the relationship between the subsurface scattering albedo and translucency [13]). Model 2 showed more linearity in terms of optical properties but not for perceptual attributes.
Even though the latent space of the trained models is well developed and navigable to a certain extent, if the model is trained with more than one object, the latent space becomes non-linear and bumpy.
Latent vectors are highly non-linear in terms of perception. This is not surprising since perception of appearance by the HVS is a complex, highly non-linear process that is still being studied [1, 4].
It was challenging to invert the reduced PCA representations back into optical parameters. Initial regression experiments on the 3D PCA space yielded suboptimal results, with traditional models such as Linear Regression and Ridge Regression showing low predictive accuracy. Even neural networks trained on the reduced space defaulted to predicting conservative, midrange parameter values, highlighting the information loss inherent in low-dimensional PCA embeddings.
In contrast, expanding the PCA dimensionality to 220 components dramatically improved predictive accuracy, confirming that the latent space of StyleGAN2-ADA is inherently high-dimensional and that aggressive dimensionality reduction limits the model’s capacity to encode complex optical relationships.
This makes us conclude that the low-dimensional projection of the latent vectors does not retain sufficient information for reliable mapping between the space and the objective optical parameters. Up to 220 dimensions were needed to retain 95% of the variation, which means that navigation in low dimensions to capture gloss and translucency properties and replace physically based rendering with an explainable and predictable deep generative model may not be feasible. Even if such a model can be crafted, it may need to be trained on each individual shape. Introduction of different hues and variations of the environment will also increase the complexity of the latent representation, and further dimensions may be needed to capture color appearance in an explainable and navigable manner.
The objective of this work has not been to emulate the HVS but to create a latent representation of the image variations and explore how perceptually meaningful its dimensions are. However, future work should explore to what extent such models can provide insights into the mechanisms of the HVS.
Although not directly comparable due to different training sets, our models show qualitative resemblance to those observed in previous studies. The space by Storrs et al. [36] disentangles glossiness levels (surface roughness in our case), lighting, and shapes although obviously no linear trends are visible—qualitatively similar to Fig. 7. Liao et al. [27] also managed to vary translucency, shape, and color (lightness in our case) features. Nimma and Gigilashvili [30] also observed qualitative variation in gloss, translucency, and lightness along the interpretable dimensions of the latent space—however, similarly to our work, their space was highly non-linear and they were not able to isolate individual features along individual axes being completely orthogonal to other attributes. Due to the glossy and translucent nature of the liquids, parallels can be drawn with the viscosity studies as well [41, 42], whose shape and viscosity features have been also shown to be possible to be clustered in the learned spaces. Our study, similarly to other works, exhibits systemic variation of the perceptual and optical properties in the space, which indicates that the deep generative models can learn meaningful qualitative representations of the material appearance attributes while more accurate and predictable navigability remains highly limited.
This work comes with several limitations that need to be addressed in the future. First, the current models failed to synthesize transparent objects. This can be alleviated by including a larger set of transparent objects in the training dataset. Moreover, hyperparameters can be tuned for better generalization, and training for a longer time can also be beneficial. The model is able to generate semitransparent objects, and this was reflected in the results of the psychophysical studies. Second, the study was limited to wavelength-independent optical properties, and therefore this representative space was created with only grayscale objects. Future expansion of this work can include chromatic variation inside the dataset to study color disentanglement in the latent space. It is worth noting that all observers were color science students—future works should recruit a more diverse population of observers. And finally, SSIM, PSNR, and LPIPS did not fully capture noticeable discrepancies in material appearance. More reliable perceptual metrics may be needed for evaluation in the future.
In conclusion, the trained model demonstrates a strong capacity to disentangle the optical and perceptual features of translucent and glossy appearance, offering a rich, partially navigable latent space. This makes StyleGAN2-ADA a promising candidate for constructing a high-dimensional representation space for material appearance in the future. However, the study reveals critical challenges, particularly, the limitations of linear dimensionality reduction techniques such as PCA. Although the inverse mapping process and perceptual analysis confirmed some success in generalization, they also exposed the tradeoff between interpretability and reconstruction accuracy in dimensionality-reduced spaces. These findings highlight the importance of improving latent embeddings, expanding the training dataset, and exploring more sophisticated dimensionality reduction or generative modeling techniques. With such advancements, deep generative models could become even more powerful and controllable tools for modeling and synthesizing complex material appearances.
Data Availability
References
1AndersonB. L.2011Visual perception of materials and surfacesCurr. Biol.21R978R983R978–8310.1016/j.cub.2011.11.022
2BellS.UpchurchP.SnavelyN.BalaK.2015Material recognition in the wild with the materials in context databaseProc. IEEE Conf. on Computer Vision and Pattern Recognition347934873479–87IEEEPiscataway, NJ10.1109/CVPR.2015.7298970
3BengioY.CourvilleA.VincentP.2013Representation learning: a review and new perspectivesIEEE Trans. Pattern Anal. Mach. Intell.35179818281798–82810.1109/TPAMI.2013.50
4ChadwickA. C.KentridgeR.2015The perception of gloss: a reviewVis. Res.109221235221–3510.1016/j.visres.2014.10.026
5ChaiJ.ZengH.LiA.NgaiE. W.2021Deep learning in computer vision: a critical review of emerging techniques and application scenariosMach. Learn. Appl.6100 134:1100 134:13100 134:1–100 134:13
6ChariT.PachterL.2023The specious art of single-cell genomicsPLOS Comput. Biol.19e1011288pp. 1–20
7CooleyS. M.HamiltonT.AragonesS. D.RayJ. C. J.DeedsE. J.2019A novel metric reveals previously unrecognized distortion in dimensionality reduction of scRNA-Seq dataBiorxiv6898511451–45
8FlemingR. W.2017Material perceptionAnnu. Rev. Vis. Sci.3365388365–8810.1146/annurev-vision-102016-061429
9FlemingR. W.StorrsK. R.2019Learning to see stuffCurr. Opin. Behav. Sci.30100108100–810.1016/j.cobeha.2019.07.004
10GigilashviliD.DubouchetL.HardebergJ. Y.PedersenM.2020Caustics and translucency perceptionElectron. Imaging32171–710.2352/ISSN.2470-1173.2020.5.MAAP-033
11GigilashviliD.ShiW.WangZ.PedersenM.HardebergJ. Y.RushmeierH.2021The role of subsurface scattering in glossiness perceptionACM Trans. Appl. Perception (TAP)181261–2610.1145/3458438
12GigilashviliD.ThomasJ.-B.2023Appearance beyond colour: gloss and translucency perceptionFundamentals and Applications of Colour Engineering239257239–57John Wiley & SonsChichester, UK
13GigilashviliD.ThomasJ.-B.HardebergJ. Y.PedersenM.2021Translucency perception: a reviewJ. Vis.211411–4110.1167/jov.21.8.4
14GigilashviliD.ThomasJ.-B.PedersenM.HardebergJ. Y.2019Material appearance: ordering and clusteringProc. Int’l. Symp. on Electronic Imaging: Material Appearance202:1202:7202:1–710.2352/ISSN.2470-1173.2019.6.MAAP-202
15GoodfellowI.Pouget-AbadieJ.MirzaM.XuB.Warde-FarleyD.OzairS.CourvilleA.BengioY.2014Generative adversarial netsAdv. Neural Inf. Process. Syst.27191–9
16Guerrero-ViuJ.SerranoA.MasiaB.GutierrezD.2023Towards latent representations of gloss in complex stimuli using unsupervised learningJ. Vis.23472310.1167/jov.23.9.4723
17GulrajaniI.KumarK.AhmedF.TaigaA. A.VisinF.VazquezD.CourvilleA.“PixelVAE: a latent variable model for natural images,” Preprint, arXiv:1611.05013 (2016)
18“International Commission on Illumination. CIE 175:2006 A frame-work for the measurement of visual appearance,” (2006)
19JakobW.SpeiererS.RousselN.Nimier-DavidM.ViciniD.ZeltnerT.NicoletB.CrespoM.LeroyV.ZhangZ.“Mitsuba 3 renderer,” (2022) https://mitsuba-renderer.org
20KarrasT.AittalaM.HellstenJ.LaineS.LehtinenJ.AilaT.2020Training generative adversarial networks with limited dataAdv. Neural Inf. Process. Syst.33121041211412104–14GitHub repository: https://github.com/NVlabs/stylegan2-ada-pytorch
21KarrasT.LaineS.AilaT.2019A style-based generator architecture for generative adversarial networksProc. IEEE/CVF Conf. on Computer Vision and Pattern Recognition440144104401–10IEEEPiscataway, NJ10.1109/CVPR.2019.00453
22KarrasT.LaineS.AittalaM.HellstenJ.LehtinenJ.AilaT.2020Analyzing and improving the image quality of StyleGANProc. IEEE/CVF Conf. on Computer Vision and Pattern Recognition811081198110–9IEEEPiscataway, NJ10.1109/CVPR42600.2020.00813
23KobakD.BerensP.2019The art of using t-SNE for single-cell transcriptomicsNat. Commun.101141–1410.1038/s41467-019-13056-x
24KomatsuH.GodaN.2018Neural mechanisms of material perception: quest on shitsukanNeuroscience392329347329–4710.1016/j.neuroscience.2018.09.001
25LagunasM.SerranoA.GutierrezD.MasiaB.2021The joint role of geometry and illumination on material recognitionJ. Vis.211181–1810.1167/jov.21.2.2
26LanzaD.MasiaB.JaraboA.2024Navigating the manifold of translucent appearanceComputer Graphics Forum43, no. 2e15035Wiley Online LibraryHoboken, NJ
27LiaoC.SawayamaM.XiaoB.2023Unsupervised learning reveals interpretable latent representations for translucency perceptionPLOS Comput. Biol.19e10108781311–3110.1371/journal.pcbi.1010878
28MarlowP. J.AndersonB. L.2013Generative constraints on image cues for perceived glossJ. Vis.131231–2310.1167/13.14.2[Online]. Available: https://doi.org/10.1167/13.14.2
29MorimotoT.AkbariniaA.StorrsK.CheesemanJ. R.SmithsonH. E.GegenfurtnerK. R.FlemingR. W.2023Color and gloss constancy under diverse lighting environmentsJ. Vis.231251–25
30NimmaA. R.GigilashviliD.2023Using deep generative models for glossy appearance synthesis and exploration11th European Workshop on Visual Information Processing161–6IEEENew York, NY10.1109/EUVIP58404.2023.10323065
31PoeppelD.2016The maps problem and the mapping problem: two challenges for a cognitive neuroscience of speech and languageUnderstanding Cognitive Development345534–55Psychology PressLondon, UK
32ProkottK. E.TamuraH.FlemingR. W.2021Gloss perception: searching for a deep neural network that behaves like humansJ. Vis.211201–2010.1167/jov.21.12.14
33RadfordA.MetzL.ChintalaS.“Unsupervised representation learning with deep convolutional generative adversarial networks,” Preprint, arXiv:1511.06434 (2015)
34SchmidA. C.DoerschnerK.2019Representing stuff in the human brainCurr. Opin. Behav. Sci.30178185178–8510.1016/j.cobeha.2019.10.007
35SchwartzG.NishinoK.2015Automatically discovering local visual material attributesProc. IEEE Conf. Computer Vision and Pattern Recognition356535733565–73IEEEPiscataway, NJ
36StorrsK. R.AndersonB. L.FlemingR. W.2021Unsupervised learning predicts human perception and misperception of glossNat. Human Behav.5140214171402–1710.1038/s41562-021-01097-6
37StorrsK. R.FlemingR. W.2021Learning about the world by learning about imagesCurr. Directions Psychol. Sci.30120128120–810.1177/0963721421990334
38StorrsK. R.KriegeskorteN.“Deep learning for cognitive neuroscience,” Preprint, arXiv:1903.01458 (2019)
39SzékelyG. J.RizzoM. L.BakirovN. K.2007Measuring and testing dependence by correlation of distancesThe Ann. Stat.35276927942769–94
40TamuraH.ProkottK. E.FlemingR. W.2022Distinguishing mirror from glass: a “big data” approach to material perceptionJ. Vis.221221–22
41Van AssenJ. J. R.BarlaP.FlemingR. W.2018Visual features in the perception of liquidsCurr. Biol.28452458452–810.1016/j.cub.2017.12.037
42van AssenJ. J. R.NishidaS.FlemingR. W.2020Visual perception of liquids: insights from deep neural networksPLoS Comput. Biol.161291–2910.1371/journal.pcbi.1008018
43Van NgoK.StorvikJ.Jr.DokkebergC. A.FarupI.PedersenM.2015QuickEval: a web application for psychometric scaling experimentsProc. SPIE9396212224212–24
44WangZ.BovikA.SheikhH.SimoncelliE.2004Image quality assessment: from error visibility to structural similarityIEEE Trans. Image Process.13600612600–1210.1109/TIP.2003.819861
45WillsJ.AgarwalS.KriegmanD.BelongieS.2009Toward a perceptual space for glossACM Trans. Graph. (TOG)281151–1510.1145/1559755.1559760
46XiaoB.WalterB.GkioulekasI.ZicklerT.AdelsonE.BalaK.2014Looking against the light: how perception of translucency depends on lighting directionJ. Vis.14171221–22
47ZhangR.IsolaP.EfrosA. A.ShechtmanE.WangO.2018The unreasonable effectiveness of deep features as a perceptual metric2018 IEEE/CVF Conf. on Computer Vision and Pattern Recognition586595586–95IEEEPiscataway, NJ10.1109/CVPR.2018.00068