Back to articles
Regular Article
Volume: 5 | Article ID: 000503
Image
Natural Scene Statistics and Distance Perception: Ground Surface and Non-ground Objects
  DOI :  10.2352/J.Percept.Imaging.2022.5.000503  Published OnlineJuly 2022
Abstract
Abstract

Both natural scene statistics and ground surfaces have been shown to play important roles in visual perception, in particular, in the perception of distance. Yet, there have been surprisingly few studies looking at the natural statistics of distances to the ground, and the studies that have been done used a loose definition of ground. Additionally, perception studies investigating the role of the ground surface typically use artificial scenes containing perfectly flat ground surfaces with relatively few non-ground objects present, whereas ground surfaces in natural scenes are typically non-planar and have a large number of non-ground objects occluding the ground. Our study investigates the distance statistics of many natural scenes across three datasets, with the goal of separately analyzing the ground surface and non-ground objects. We used a recent filtering method to partition LiDAR-acquired 3D point clouds into ground points and non-ground points. We then examined the way in which distance distributions depend on distance, viewing elevation angle, and simulated viewing height. We found, first, that the distance distribution of ground points shares some similarities with that of a perfectly flat plane, namely with a sharp peak at a near distance that depends on viewing height, but also some differences. Second, we also found that the distribution of non-ground points is flatter and did not vary with viewing height. Third, we found that the proportion of non-ground points increases with viewing elevation angle. Our findings provide further insight into the statistical information available for distance perception in natural scenes, and suggest that studies of distance perception should consider a broader range of ground surfaces and object distributions than what has been used in the past in order to better reflect the statistics of natural scenes.

Subject Areas :
Views 509
Downloads 102
 articleview.views 509
 articleview.downloads 102
  Cite this article 

Xavier Morin-Duchesne, Michael S. Langer, "Natural Scene Statistics and Distance Perception: Ground Surface and Non-ground Objectsin Journal of Perceptual Imaging,  2022,  pp 000503-1 - 000503-12,  https://doi.org/10.2352/J.Percept.Imaging.2022.5.000503

 Copy citation
  Copyright statement 
Copyright © Society for Imaging Science and Technology 2022
  Article timeline 
  • received August 2021
  • accepted April 2022
  • PublishedJuly 2022

Preprint submitted to:
jpi
Journal of Perceptual Imaging
J. Percept. Imaging
J. Percept. Imaging
2575-8144
Society for Imaging Science and Technology
1.
Introduction
The role of natural scene statistics in visual perception has been affirmed time and time again. Indeed, the idea that the environment comprises certain regularities (statistics) which constrain the array of possible visual stimuli has been used to explain how visual systems efficiently encode images and estimate scene properties such as geometry, material, and lighting. Simoncelli and Olshausen [42] and Geisler [12] provide overviews of early work. More recently, studies have found evidence for the role of natural scene statistics in ordinal depth [5], binocular eye movements [14, 15, 22, 43] and stereoscopic depth [27, 45] perception.
Ground surfaces are important. Most natural scenes inhabited by human observers contain a ground surface. Ground surfaces support locomotion and thereby constrain where and how we move through the world. Ground surfaces also directly support most objects and indirectly support almost all others. From a natural scene statistics point of view, this means that human observers are able to learn correspondences between visual cues (e.g., the ground surface’s texture) and real-world distances by walking up to the object of interest to confirm their judgement of its distance. Gibson [13] was one of the first to propose that ground surfaces are important in visual perception; many empirical studies have since confirmed it. These studies include studies of shape perception which show a bias for upward slant (floor) over downward slant (ceiling) [38], studies of relative depth perception that show a ‘ground dominance effect’ (i.e., subjects are more likely to perceive objects as resting on a ground surface rather than attached to a ceiling surface [24, 9, 25]), and visual search studies finding an advantage for stimuli organized to appear like a ground plane over other planes [6, 28]. Other studies have additionally shown that absolute distance can be computed by integrating information along the ground [50], and by using elevation angle and viewer height as cues [21, 33, 35]. The absolute distance of objects that lie off the ground plane can also be judged in reference to depths of adjacent points along the ground plane [30, 46]. Finally, studies have also shown how irregularities in either the height or the texture of ground surface can disrupt absolute distance perception [11, 41, 51, 52].
Given the demonstrated role of natural scene statistics in visual perception, and the importance of the ground surface in vision, it is surprising how little work has been done combining natural scene statistics and the perception of distance to the ground surface. Huang et al. [23] used laser range data in forest scenes and found that distance distributions were different in the upper and lower halves of the images; they attributed the differences to the presence of the ground plane in the lower halves but did not examine the differences in any detail. Potetz and Lee [36] used co-registered range and intensity images of urban and rural scenes to study the correlations between luminance and distance. In their analysis of distance, they observed that a planar fit to the mean scene distance as a function of visual direction had a small upwards overall slant, which they attributed to the ground surface. A similar finding of an overall upward mean slant has been used to explain biases in stereoscopic distance perception and binocular eye movements [14, 15, 22, 27, 43]. Finally, Yang and Purves [53] computed natural scene statistics of distance using point clouds they acquired from a forest and a university campus, and used those statistics to explain well-known distance perception biases such as the ground dominance effect [24, 9, 25] and the specific distance tendency [1618].
It is important to note that the studies cited above all employed only a general, loose notion of ‘ground surface.’ Huang et al. [23], for example, considered the bottom half of their range images as a ground surface; Yang and Purves [53] similarly treated all points below eye level as representing the ground surface. Specifically, the authors of those studies did not distinguish between points belonging to the ground surface and points below the horizon belonging to non-ground objects such as trees and shrubs, rocks, fences, walls, etc.
The goal of the current study is to revisit natural scene statistics that are relevant to the perception of distance, and to investigate differences in statistics between the ground and non-ground objects. In particular, given the importance of the Yang and Purves [53] study for distance perception and natural scene statistics, our goal is to reproduce and extend some of their analyses by using recent techniques for separating ground and non-ground points, and for simulating changes in viewing height.
We address two central questions. First, how are distances to ground points and non-ground points distributed in the real world? In particular, how do those distributions compare to those of a flat ground surface with few objects like one might find in a typical perceptual study executed in a laboratory setting? Many perceptual studies of distance have shown that a pure horizontal ground plane scene does not account for perceptual biases in perceived distances [34], and one of Yang and Purves’ key insights was to relate those perceptual findings to natural scene statistics. Thus, one of our goals was to compare the statistics of actual ground points to the statistics of a flat horizontal surface, and to disentangle the statistics of the ground from those of non-ground objects. Disentangling these statistics could suggest experiments of distance perception that are more reflective of the actual statistics of natural scenes, in which the ground is not regular or flat and in which the ratio of non-ground points might be larger than the one in the sparse scenes used in most past studies.
The second central question we address is how the distributions of distances to ground and non-ground points vary with viewing height. While many studies have examined the scale invariance of natural image statistics (e.g., [39]) there is little evidence that distance statistics are also scale invariant. In particular, we would expect that changing the height of the viewer should change the distance statistics, such that the taller the viewer, the flatter the scene appears to be. (In the extreme, the world seen from an airplane appears quite flat.) More practically, sitting on the ground or standing on large object provides a different view of what is visible in a scene. So, a fundamental question about natural scene statistics is how do distance distributions vary under such viewing height changes? A few perceptual studies have examined how perceived size and distance in a scene can depend on perceived viewing height [40, 48, 49]. However, these studies did not consider natural scene statistics. We believe that the same experimental question could be addressed using a natural scene statistics approach, and that a model of how natural scene distance statistics vary with viewing height could be useful in future experiments to determine how distance perception depends on perceived viewing height.
2.
Methods
2.1
Datasets
We used three datasets in our analyses: the Yang and Purves’ dataset [53] which we refer to as YP-2003; the SYNS dataset [1], specifically the outdoor scenes; and the Semantic3D dataset [19]. Parameters for each dataset are shown in Table I.
Table I.
Datasets and their specifications.
YP-2003SYNS:Semantic3D*
[53]outdoor [1][19]
# of scenes23 natural76 outdoor30 urban
per category51 outdoor
maximum300 m120 m300 m
range
angular0.1440.0360.0005
resolution
horizontal333360360
span
vertical72135135
span
*
The parameters for the Semantic3D dataset had to be estimated for the point clouds, since they were not available in the dataset’s paper.
We chose the YP-2003 dataset, as one of our goals was to replicate and extend Yang and Purves’ previous work. As for the SYNS outdoor scene dataset and the Semantic3D dataset, we chose them because they had higher angular resolutions and expanded the scene types present in our analyses: whereas the YP-2003 scenes were all collected in Duke Forest and around Duke Campus, both the SYNS and Semantic3D scenes were purposefully selected from a wide range of locations. The SYNS outdoor scenes were specifically created from 19 outdoor categories, and the Semantic3D scenes were chosen for variety. We did not use the SYNS indoor scenes because we wanted to focus on natural and human-made outdoor scenes like the ones in the YP-2003 dataset. More details, including pictures of the scenes and images showing the point cloud are available on both the SYNS website (https://syns.soton.ac.uk/) and the Semantic3D website (https://www.semantic3d.net/).
There a few additional things to note. First, the scanners used in all three datasets were positioned at 1.65 m above the ground in all scenes. Second, for all three of the datasets described, the scanners’ vertical range did not extend beyond 135 from the zenith; i.e., they did not scan their own base. For the YP-2003 dataset, the scanner’s vertical range extended from 63 from the zenith to 135 from the zenith. For the other two datasets, the scanners’ vertical range went from the zenith to 135 from the zenith. Finally, we had to downsample 12 of the 30 Semantic3D point clouds. The original point clouds contained between 170 million and 496 million points; this was far more than was needed for our purposes, and made it more costly in terms of computational resources to use these point clouds in our analyses. For this reason, we applied the resampling step of the SLR [31] method (described in Section 2.2.6) using the scanner’s original position and height above the ground but using a lower angular resolution (0.0005).
2.2
Analyses
2.2.1
Distributions of Distances
Following Yang and Purves [53], we computed probability density distributions of distance by determining the distance from the LiDAR scanner to all of a dataset’s point clouds’ points, counting the number of points occurring in each bin (we used pulse-sized bins, defined in the next section), normalizing the counts to obtain the fraction of points in each bin, and dividing those fractions by their bin’s width to obtain the probability density per meter for that bin.
Points were labelled as belonging to the ground surface or to non-ground objects using the Cloth Simulation Filtering method (described in Section 2.2.3). Distributions of distances to ground points and to non-ground objects were normalized using the total number of all points, so that the sum of the normalized ground and non-ground distributions is equal to the normalized distribution of all points.
2.2.2
Pulse-sized Bins
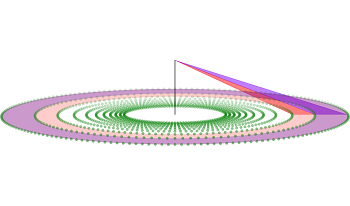
We computed our distance distributions using a binning method in which each bin represents the interval of distances spanned by a set of pulses coming from an ideal, noiseless scanner that is placed 1.65 m above a perfectly flat ground plane (see Figure 1a). In particular, for distances beyond 1.65 m, each bin spans a fixed elevation angle of 0.144 (the angular resolution of the YP-2003 dataset’s scanner [53]). The constant elevation angle means that bin size increases with distance (see Fig. 1b, S2 > S1). As for distances up to 1.65 m (scanner height), points whose distance is less than scanner height do not belong to the flat ground surface. We therefore used 5 cm fixed-size bins for distances up to scanner height (1.65 m). We refer to this overall binning scheme as pulse-sized bins, because the vast majority of the bins’ size is defined by the size S of a pulse.
Figure 1.
Pulse-sized bins explained. (a) LiDAR scanner (black line) sitting on a flat ground surface. The green points represent points reported by the scanner’s pulses. The red and purple triangles are pulses shot from the LiDAR. The red and purple annuli represent the area covered by a single set of pulses at those elevations. (b) Visual representation of the range of two fictitious pulses and their corresponding pulse-sized bins; the arrows represent the pulses and the gray arcs represent the bins’ edges. Each bin comprises distances to points acquired by a single set of pulses, and those distances are computed from a theoretical scanner with an angular resolution of 0.144 and a height of 1.65 m to a flat ground surface. S2 is larger than S1 since pulses cover a larger area the further away they land from the scanner. (c) Distance probability distribution for a point cloud of a flat ground surface acquired using an ideal, noiseless scanner. Since there is no distance estimation noise, points are concentrated in a few bins, leading to the distribution alternating between 0 and a high probability. (d) The same probability distribution as in (c), but plotted using pulse-sized bins. The number of points is spread over the width of a pulse, leading to a better representation of the data.
The advantage of pulse-sized bins is that they provide a more representative view of the data. Consider a noiseless scanner described above with height of 1.65 m, azimuth and elevation angular resolutions of 0.144, horizontal span of 360 and a vertical span of 135. Distributions of distances to a flat ground surface acquired by this ideal, noiseless scanner are shown in Fig. 1(c) (fixed-size bins) and Fig. 1(d) (pulse-sized bins). The distribution in Fig. 1(c) appears sparse; it reports, for example, that there were no points in the 140–140.2 m bin, and reports a high number of points in the 131.2 − 131.4 m bin. Fixed-size bins depend on the assumption that the distance estimate noise in real-world scanners is uniformly random. In contrast, the pulse-sized-bin distribution in Fig. 1(d) reports a small number of points in the 131.31 − 164.31 m bin. This is because the pulses of a noiseless scanner (i.e., without distance estimate noise) would systematically report points at the same distance on an ideal flat ground surface. Pulse-sized bins therefore provide a better representation, because they spread the number of returns over the size S defined by the range of a pulse.
2.2.3
Labelling Points as Ground and Non-ground
Points were labelled as ground or non-ground using the Cloth Simulation Filtering method [54]. This method was created in the context of airborne LiDAR and digital terrain models. The idea behind the method, represented in Figure 2, is to first turn the point cloud upside down, and then to drop a simulated cloth on the inverted surface. The method simulates the cloth falling until it settles and, once it has settled, the points from the point cloud which are in contact with the cloth or which are within a certain distance of the cloth (e.g., 10 cm) are considered ground. All other points are considered non-ground. We implemented the labelling in two steps.
Figure 2.
Cloth Simulation Filtering, step-by-step. (a) Frontal slice of scene #33: Scholing, Southampton from the SYNS dataset. (b) The scene is flipped and a simulated cloth is set to cover the whole scene. The cloth is simulated by cloth particles (drawn as blue points) and interconnections (represented by lines connecting the particles). (c) The cloth is dropped. Simulated interconnections allow it to mold to the shape of the ground, but prevent it from entering deeper grooves such as the one to the right of the house. The flexibility of the cloth is based on parameters reported in text. (d) Points within a parameterized distance of the cloth are marked as being part of the ground. (e) The result. Ground points are shown in black and non-ground points, in gray.
Figure 3.
View from the top of a point cloud from the YP-2003 dataset. This point cloud’s odd shape caused our implementation of the CSF method to time out. The gray rectangular area represents the cropped area passed to the CSF method for labelling. Points outside of the rectangular area were labelled as non-ground points.
First, we removed outliers and manually cropped the point cloud when necessary. Outliers were removed using the Open3D library [55] function remove_statistical_outlier. The function computed the distance of each point to its 30 closest neighbors, and rejected points whose distance to their neighbors was more than 3 standard deviations away from the average neighbor distance. Rejected points did not participate in the Cloth Simulation Filtering and were instead automatically labeled as non-ground points. We also had to manually crop some of our point clouds having a particularly odd shape which caused our implementation of the method to time out (see Figure 3 for instance). Cropped portions of point clouds were automatically labelled non-ground, and were not processed by the Cloth Simulation Filtering method. Cropped points represented less than 1% of the problematic point clouds’ points.
Second, once outliers had been removed, we applied the Cloth Simulation Filtering method using code adapted from the open source project CloudCompare [7]. One of this method’s strengths is that it is easy to use and requires setting far fewer parameters than most other methods. In our case, we set the k-nearest-neighbors parameter to 1, the time step to 0.65, the cloth resolution to 0.1, the class threshold to 0.1, and the cloth rigidness to 1. We disabled slope smoothing. Our choice of parameters was informally validated through visual inspection of a few point clouds prior to applying the method to all point clouds, and visual inspection of all point clouds afterwards. The method itself was validated by its authors, and we refer the interested reader to the Cloth Simulation Filtering method’s paper [54] for further details regarding the method and its validation.
2.2.4
Distance as a Function of the Angle of Elevation
Like Yang and Purves [53], we were interested in computing probability density distributions for distances as a function of the angle of elevation. In order to do so, we first divided the vertical angular range between 40 and 40 of elevation (50 to 130 from the zenith) and the distance range from 0 m to 165 m into 655 pulse-sized bins resulting in an 800-by-655 matrix (points falling outside of that range were discarded). We then computed the distance from the scanner (at a height of 1.65 m) to each point, and counted the number of points falling within each bin based on its distance and elevation. Points at different azimuth directions were pooled based on their direction and elevation. Finally, we normalized the counts relative to the matrix total and to the size of the bins, and obtained a distribution of probability of a given distance at the given elevation. It is worth noting that the “angle of elevation” refers to an angle on the z-axis where the 0 is at the horizon (rather than at the zenith).
2.2.5
The Impact of Viewing Height
We also examined how distributions of distances change with viewing height. Human observers do not always view the world from the same height above the ground; we often crouch or sit especially when we are resting or if we wish to hide ourselves, and when we wish to see objects from a height we stand on objects or other protrusions from the ground. How do such changes in height affect distance distributions? Taking inspiration from Yang and Purves [53], we examined distributions of distances at five heights: 3.25 m, 2.45 m, 1.65 m (the scanner’s default height), 0.85 m, and 0.05 m. Yang and Purves only considered the distribution of points within ±2 from the horizontal plane at the given viewing height, whereas we considered points at all elevations at each viewing height. To reiterate, the purpose of our analysis was different than Yang and Purves; whereas they focused on distance perception at eye level [53, 1(c)] and used the other heights to demonstrate consistency (see their Figure 3), while we were interested in characterizing distributions of distances for ground and non-ground points at different viewing heights.
2.2.6
Simulated LiDAR Repositioning (SLR)
Our method for subsampling at different heights differs from Yang and Purves’ [53]. Whereas they only considered points ±2 from a horizontal plane at each height, we considered points at all elevations. In particular, given a point cloud of a real-world scene obtained from a 3D LiDAR scan, Simulated LiDAR Repositioning generates subsampled point clouds that correspond to a subset of 3D points that would be visible from these new positions.
At a high level, the SLR method is straightforward: (1) select a position to simulate scanning; (2) choose an appropriate angular resolution for the simulated scanner, and (3) obtain a point cloud by determining which of the original point cloud’s points were visible from the new position given occlusions and the scanner’s new angular resolution. The third step works by dividing the volume surrounding a theoretical LiDAR scanner into pyramids (Figure 4) where each pyramid represents the volume covered by a single LiDAR pulse, and selecting in each pyramid the point that is closest to the scanner. This step makes the implicit assumption that the pulse of an ideal LiDAR would report the closest point of the closest object, and serves to remove points from the point cloud which have become occluded as a result of scanner’s repositioning. It is important to note that the method does not, however, generate new points to represent real-world points that were previously occluded and would have become visible from the scanner’s new position and viewing height. Still, while the method only partially accounts for occlusions, we believe it to be an improvement over Yang and Purves’ method and over a simple translation of points’ coordinates, since it does address some of the occlusions.
Figure 4.
The volume surrounding a theoretical LiDAR scanner can be divided into pyramids, where each pyramid represents the volume covered by a single LiDAR pulse.
We used SLR in two ways to study the impact of viewing height on distance distributions. The first was to reposition the scanner vertically without changing its horizontal position: we selected a new viewing height for the scanner, chose an angular resolution of 0.144 (consistent with the YP-2003 dataset), and generated subsampled point clouds by determining occlusions given the viewing height and angular resolution.
Second, in order to augment the data and obtain smoother distributions, we applied the method to reposition the scanner both vertically and horizontally. That is, we selected a new viewing height as well as a horizontal location among a set of possible nearby simulation locations, using point-density based criteria—see [32]; chose an angular resolution of 0.144; and generated point clouds from the new horizontal position and viewing height using the chosen angular resolution.
The method was only applied to the SYNS and Semantic3D datasets; the method requires the angular resolution of generated point clouds to be lower, and the YP-2003 dataset’s angular resolution was already low compared to that of the other two datasets.
It is important to note that the method does not represent points that would have become visible as a result of moving the scanner to the new position and viewing height. As an observer moves in a scene, some of the points which were visible from the original position become occluded, and some of the points which were occluded become visible. The method handles the former by computing occlusions, but does not handle the latter. That is to say that the SLR method does not generate points to represent previously occluded points that have become visible from the new position. Since these points were not captured in the first place, there is no way for us to accurately identify what might be visible from the new position and viewing height that wasn’t the original one. As we argue later, this phenomenon is comparable to half-occlusions and, as we have demonstrated elsewhere [32], only a small proportion of points are misrepresented this way.
2.3
Computational Resources
Analyses were done in Python 3 [47] using the NumPy [20], Pandas [29], Matplotlib [24], and Open3D [55] libraries. Analyses were primarily executed on computational clusters provided by Calcul Québec and Compute Canada. Some analyses were also executed on a Dell computer with a 12 core XEON processor and 32 GB of RAM running Linux Debian 10 Buster.
Figure 5.
Distributions of all distances (light blue), distances to the ground (brown), and distances to non-ground objects (green) for the (a) YP-2003, (b) SYNS, and (c) Semantic3D datasets. The distributions of all distances (gray) appear compatible with Yang and Purves’ findings: the distributions peak between 2 and 4 m (see Fig. 6) and decline in a similar fashion.
3.
Results & Discussion
We were interested in examining differences between the ground and non-ground objects in the context of three of Yang and Purves’ [53] analyses, namely, distributions of distances as function of the angle of elevation, and the impact of viewing height. We describe the results of each in their own section below.
3.1
Distributions of Distances to the Ground and to Non-ground Objects
Distributions of distances to all points, ground points, and non-ground points are shown in Figure 5. Close-ups of the early portions of these distributions are shown in Figure 6. There are four results to note. The first is that the distributions of all distances (in light blue) for all three datasets appear compatible with the findings reported by Yang and Purves [53]. Yang and Purves identified two key features of their distribution of distances, namely that it peaked at “about 3 m” and that it “declin[ed] approximately exponentially over greater distances.” Indeed, our distributions of all distances present similar features: the peaks do appear to fall between 2 m and 4 m (Fig. 6), and the distributions do show a similar pattern of decline after the peak (Fig. 5).
Figure 6.
The distributions of distances from 0 m to 10 m for (a) a flat ground surface (see full distribution in Fig. 1d), (b) the YP-2003 dataset (Fig. 5a), (c) the SYNS outdoor dataset (Fig. 5b), and (d) the Semantic3D dataset (Fig. 5c). The purpose of this figure is to focus on the early portions of the distributions, where the peaks of the distributions and crossovers between the ground and non-ground distributions occur. The 2 m–4 m range is highlighted in blue-gray. There are important differences between the distributions of all distances, ground distances, and non-ground distances. The distributions of all distances and ground distances for all three datasets are sharp and occur between 2 m and 4 m. The peaks of the non-ground distributions are softer and their exact location is unclear. Distances to the ground dominate short distances: there is a higher proportion of ground points in the 2.48 m–5.34 m range in the YP-2003 dataset, the 2.07 m–8.26 m range for the SYNS dataset, and 2.23 m–9.30 m range for the Semantic3D dataset. For (b)–(d), the early peaks and rapid decline of the ground distributions are expected: their shapes are very similar to that of the theoretical distribution to a flat ground surface in (a).
The second result to note is that there are differences between the distributions of distances to the ground (brown), to non-ground objects (green), and to all distances (light blue). In particular, the distributions of ground distances have sharp peaks after which they decline rapidly, the distributions of non-ground distances have soft, noisy peaks and a large tail, and the distributions of all distances have sharp peaks and large tails. These suggest that the ground is most visible at short distances rather than far distances (ground distributions have sharp, early peaks), partly because it becomes occluded by non-ground objects which are visible at larger distances (non-ground distributions have large tails). More generally, these figures show that the ground dominates early distances (from approximately 2 m up to approximately 5.5 m, 8 m, and 9 m for the YP-2003, SYNS, and Semantic3D datasets respectively), and that larger distances are dominated by non-ground objects.
The third result to note is that there are similarities between the distributions of ground distances for all three datasets and the distribution of distances to a flat ground surface (Fig. 6a). The latter distribution was computed assuming an ideal LiDAR scanner with a height of 1.65 m positioned on top of flat ground surface. This distribution both starts and peaks at 2.33 m. This particular value depends on the height of the scanner and the fact that the scanner did not scan below 135 (just like the scanners for all three datasets). The similarities suggest that the labelling of ground and non-ground points was done correctly by our implementation of the CSF method, and that visible points at near distances are indeed dominated by ground points. We explore these distributions more precisely and in greater detail in the following two experiments.
3.2
Distance Distributions as a Function of the Angle of Elevation
Figure 7 shows the distributions of all distances as a function of the angle of elevation (0 is the horizon) for all three datasets for all distances (first column), distances to the ground (second column), and distances to non-ground objects (third column). These distributions were created using pulse-sized bins which make precise visual comparisons with Yang and Purves’ own distribution [53, Fig. (5a)] difficult. That said, we note that the three distributions of all distances as a function of elevation (first column) present three key features identified by Yang and Purves which suggest that our results are compatible with theirs. First, probability density is spread over a wider range of distances in the upper halves of distance distributions (above 0, the horizon) than in the lower halves. This is indeed the case across all three datasets, and is easily understood: distances below the horizon are limited by the ground. Second, the range of distances is widest near 0 (the horizon) and shifts toward nearer distances as the elevation departs from 0 both above and below the horizon. This is to say that, if one were to divide the field of view in three sections—the sky, the horizon, and the ground—then there are more distant objects to perceive at the horizon. The lower third of the field of view is typically occupied by the ground which is close to the viewer. The upper third of the field of view is the sky which typically contains few objects. For example, for a building to be visible at 20 of elevation and at a distance of 100 m, it has to be at least 36 m tall (over 10 stories high). Third, Yang and Purves identified a “single salient ridge” below the horizon. In our Fig. 7, this ridge appears in red in all three datasets, starts between 5 and 10 of elevation, and stretches downwards. The location of this ridge—similar to that of the peaks in Fig. 5 and Fig. 6—suggests that the ridge represents distances to the ground.
Figure 7.
Probability density distributions of distances as a function of the angle of elevation using pulse-sized bins for the YP-2003, SYNS, and Semantic3D datasets. The same color scale is used for all figures and was chosen to match the colors in Yang and Purves’ Fig. 5(a) [53]. The first column, Fig. a, d, and g, represent the results for all distances (i.e., both ground and non-ground distances). The second and third columns represent distances to the ground (Fig. b, e, and h) and distances to non-ground objects respectively (Fig. c, f, and i). Distributions for all distances in the first column are compatible with Yang and Purves’ findings: in all three datasets, probability density is spread over a larger area above than below the horizon, probability density shifts toward nearer distances as the angle of elevation departs from 0 both above and below the horizon, and there is a red ridge of dense probability density below the horizon. As for the distributions of ground and non-ground distances in the second and third columns, they show that the red ridges below the horizon in the distributions of distances in the first column are attributable to ground points, that the distribution for a flat ground surface (the dashed gray line) goes straight through the red ridge, that points above the horizon in ground distributions represent only a small percentage of all ground points (between 1.3% and 1.6%), and that the similarities between non-ground distributions and distributions of all distances may be due to both the labelling ground and non-ground points, and to the relationship between the ground and non-ground objects. See text.
Fig. 7 also shows the distributions of distances as a function of the angle of elevation for ground points (second column, Fig. 7b, 7e, and 7h) and for non-ground objects (third column, Fig. 7c, 7f, and 7i). The first result to note is the presence of the red ridge in the ground distributions, its absence from non-ground distributions, and the fact that the distribution of distances as a function of elevation for a flat ground surface (dashed gray line) goes straight through the red ridge. This confirms that it was indeed due to ground points, and its location further suggests that it is most likely related to the peaks in the distributions of all distances and ground distances in Fig. 5. The second result to note is the presence of ground points in the upper half of the distribution (above 0, the horizon). It is not obvious from the log color scale, but these only represent 1.6%, 1.3%, and 1.3% of all ground points in the YP-2003, SYNS, and Semantic3D datasets respectively. Such a small proportion of points can largely be explained by natural variations in the landscape (non-planar ground) and, to a smaller degree, by imperfections in the ground and non-ground point labelling. The third result to note is how similar the distributions of non-ground distances (Fig. 7c, 7f, and 7i) are to those of the distributions of all distances (Fig. 7a, 7d, and 7g). That their upper halves (above 0) are similar is expected: non-ground points represent the vast majority of points above the horizon (0). It is surprising however that, save for the red ridge (discussed above), they are rather similar below the horizon as well. One part of the explanation is that this is again due the ground and non-ground point labelling. It is possible that the method and our choice of parameters have made it so that ground points are sometimes erroneously labelled as non-ground points. Another part of the explanation is that the ground directly supports most objects, and indirectly supports almost all others. The distributions of non-ground distances below the horizon may, in other words, be composed of distances to objects resting on the ground.
Figure 8.
Distributions of distances at various viewing heights for all points (Fig. a and d), ground points (Fig. b and e), and non-ground points (Fig. c and f). Here, SLR was used to reposition the scanner vertically while maintaining its original position. The five distributions in each graph represent the distributions of distances at each of five heights: 1.6 m above scanner height (3.25 m above the ground), 0.8 m above (2.45 m), scanner height (1.65 m), 0.8 m below (0.85 m), and 1.6 m below (0.05 m). In the distributions of distances to all points (Fig. a and d), two patterns emerge: the peaks appear to approximately shift toward 0 m as the scanner is lowered toward the ground, while the tails appear constant. The distributions of distances ground points (Fig. b and e) and non-ground points (Fig. c and f) show that the two patterns observed in the distributions of all distances appear to be due to separate patterns in the distributions of ground and non-ground distances. Namely, distributions of ground distances approximately shift toward 0 m as the scanner is lowered toward the ground, and non-ground distributions are not impacted by height.
Figure 9.
Distributions of distances at various viewing heights for all points (Fig. a and d), ground points (Fig. b and e), and non-ground points (Fig. c and f). This figure is based on the same data as Fig. 8, but shows the distributions using a log-log scale rather than a semilog scale.
3.3
The Impact of Viewing Height on Ground and Non-ground Distributions
Figure 8 shows the impact of viewing height on distributions of all distances, distances to the ground, and distances to non-ground objects for the SYNS and Semantic3D datasets. These were obtained by simulated vertical repositioning of the scanner described earlier. Figure 9 provides log-log plots of the same data. The plots for all distances (Fig. 8a and 8d) are very different from the one presented by Yang and Purves [53] in their figure 3(c). There are a couple of reasons for this. First, whereas they considered only horizontal distances, namely ±2 above and below the horizon, we considered distances at all elevations. Second, we only show the first 50 m of the distributions, since this is where the interesting features are. Third, we don’t use the YP-2003 dataset in this analysis. This is simply because simulating changing the scanner’s height was achieved using the parts of the SLR method [31] which generates point clouds with a lower angular resolution, and the YP-2003 dataset’s angular resolution was already low compared to that of the other two datasets.
Figure 10.
The same distributions as in Fig. 8, but this time using SLR to reposition the scanner both horizontally and vertically. The resulting distributions are smoother due to the greater number of scans.
Notice the dual pattern in the distributions in Fig. 8(a) and 8(d): on the one hand, the peaks of the distributions appear to become closer to 0 m as the viewing height is moved toward the ground; on the other hand, the tails of the distributions do not appear to change with viewing height. The reason for this dual pattern is shown in the second and third columns of Figs. 8 and 9: the distributions for the ground (Fig. 8/9b and 8/9e) are different from those for non-ground points (Fig. 8/9c and 8/9f). The distributions of distances to the ground are compressed toward 0 m as the viewing height is moved toward the ground, whereas the distributions of non-ground distances are roughly constant. This behavior of the ground distributions is qualitatively similar to the behavior of a perfect ground plane with no occluding objects in the scene; we describe this effect in greater detail below. As for the non-ground object pattern, our findings extend those of Yang and Purves [53]: whereas they had found that distances near horizontal directions were roughly constant across viewing heights, our results show a similar result when all viewing directions or elevations are considered.
We do note one exception. The distributions of distances to ground points and non-ground points for the “1.6 m below” viewing height display a lower proportion of ground points and a greater proportion of non-ground points overall in comparison to those of other viewing heights. This difference can be seen clearly in Fig. 8. (The curve for viewing height 0.05 m above the ground is light gray.) We believe this difference to be a characteristic of the viewing height: with the scanner so close to the ground, ground points will tend to occlude large parts of the distant scene, in particular occluding other parts of the ground. As a result, non-ground points will be more likely to be visible at this viewing height than at other heights, and ground points will be less likely to be visible at this viewing height than at other heights.
The distributions presented in Figs. 8 and 9 were somewhat noisy. To obtain smoother curves, we augmented the data by applying the SLR method and horizontally repositioning the sensor. The results corresponding to Fig. 8 are shown in Figure 10. The qualitative behavior described above is now more evident because the curves are smoother.
The results for the ground surface can be explained by a scaling of distribution of distances as a function viewing height. Consider an observer with an eye height (viewing height) of 1.65 m standing on a flat horizontal ground surface containing no objects, so that only the ground is visible below the horizon. If that observer were to look at the ground at angles of 45 below the horizon and 30 below the horizon, the points on the ground at the center of the observer’s gaze would be at a distance of approximately 2.33 m and 3.30 m. Consider now two other observers on the same surface but with eye heights of 0.165 m and 16.5 m. For the viewing angles, the distances at the center of their gazes would be 0.23 m and 0.33 m for the first observer, and 23.33 m and 33 m for the second. As this example demonstrates, as eye height increases or decreases by a factor of α, so do the distances. This is because, given a fixed viewing angle θ, there is a linear relationship between an observer’s eye height h and the distance d from the observer’s eyes to the point on the ground at the center of their gaze, namely d = h ⋅cosθ. For a flat horizontal surface, this would translate into a change in the position of the distribution’s peak and in a change in the peak’s magnitude (to maintain a total probability of 1). For natural scenes like those from our datasets in which the ground surface is neither perfectly horizontal nor perfectly flat, the scaling effect is still visible though understandably less pronounced.
As for the non-ground points, the distribution is roughly invariant over changes in viewing height. We believe this due to three effects, all of which are small. First, when the actual (not simulated) viewing height changes, some scene points become occluded and others become visible. This effect is similar to that of half-occlusions in binocular stereo where some points are only visible from one eye or the other but not both. It has been shown that, except in densely cluttered scenes with small objects [26], most scene points that are visible to one eye are also visible to the other eye (The fraction of half-occluded points depends on the interocular distance and on the number and size of objects in the scene [26]; but for the SYNS and Semantic 3D scenes and for the range of change of the viewing height in our analysis, we believe that the vast majority of points in those scenes would have remained visible if the true scanner height had been changed.). For this reason, we believe that, only a small proportion of points would only be visible from one viewing height but not another, if the actual viewing height were to change. Second, SLR subsamples at each viewing height (both at the original and at simulated viewing heights), obtaining a lower resolution distance distribution (see Fig. 4). Thus, even if there were no half occlusions effects in the actual scene, the distributions at different viewing heights could be composed of different sample points. We see no reason why this sampling effect itself should bias the distribution as viewing height changes. Third, while the distance to each point does change as the viewing height is raised or lowered (especially the distance to points close to the viewer), as the viewer moves away from one point, it likely moves towards another. This results in at most a small net effect on the distribution.
4.
General Discussion
There is strong evidence that human visual perception is biased by the statistics of the natural world in which the visual system has evolved. In particular, ground surfaces have been shown to play an important role in visual perception. Yet, previous quantitative studies of natural scene statistics and distance perception have treated all distances alike, i.e. whether they were distances to ground points or to non-ground points. Here, using a simple filtering method for labelling points [54], we revealed important differences between the statistics of distances to the ground and those to non-ground points. We showed that the distribution of distances to the ground cannot reliably be estimated using either the lower-half of ground points or a flat, artificial horizontal surface. We also examined how distributions of distances change with viewing height, and provided an explanation for the different patterns of results for both distances to the ground and distances to non-ground objects.
The distinction we have drawn between ground and non-ground distributions suggests a variety of different and new experiments to address distance perception. These experiments could examine situations in which the ground surface is non-planar, as well as situations in which scenes contain many objects that occlude large parts of the ground surface. A non-planar ground surface can also occlude itself (and the horizon), which raises the question of how robust are horizon-based cues [40] that have inspired in many important past studies of distance perception. Further studies of natural image statistics of ground versus non-ground could shed light on this issue, by specifying how inherently reliable horizon-based cues are for perception in real scenes. Although perceptual biases need not be necessarily matched to the statistics of the world [10], understanding when the biases do or do not match the natural scene statistics can provide insights into what the visual system is doing (or not doing).
Our work also suggests future experiments on natural image statistics themselves. Analysis of ground versus non-ground points should become easier as more labelled data sets emerge, for example, from the computer vision community. Indeed, the Semantic3D dataset comes with labelled points, although its labelling is more refined than ground versus non-ground. Note that we chose to use the CSF method’s labelling over the Semantic3D labelling, because the CSF method had already been validated by its authors and had shown good results [54], and because we preferred a systematic and consistent approach across the three datasets.
Another interesting direction for future work might be to study and model the statistics of natural ground surfaces as surfaces—not just clouds of points as we have done, but also fitting terrain models to natural ground surfaces. Such models could be relevant to previous perceptual studies of geographical slant, which is the slope of the ground relative to the horizon. These studies have demonstrated large biases, e.g. observers overestimate the geographical slant by 50% or more [37]. The reasons for these biases are unclear, and so one could ask whether natural scene statistics might be involved. Previous work has also suggested that non-visual factors could be involved [44], or that there may be a bias where visual directions near the horizon are encoded more precisely for ecological reasons [8]. It is worth noting that work in this field has typically been carried out in scenes—either real or in virtual reality—with simple ground surfaces consisting of a small number of planes (typically just one or two). It would be interesting to revisit these studies using non-planar ground shapes, such as landscapes that one finds in nature.
Finally, one could examine other statistics of ground and non-ground points as well. The SYNS study [1] addressed the distributions of surface orientations, and considered how the statistics varied with viewing elevation. The authors observed differences in surface slant and tilt distributions at different elevations both above and below the horizon, and attributed these differences to the dominant scene features in these regions, such as ground, ceiling, sky, or in the case of indoor scenes, walls. Their results remind us that a finer categorical distinction of ground and non-ground points could be important, especially for perceptual problems that go beyond just distance perception but that involve perception of scene objects and layout.
Acknowledgment
The authors would like to thank Zhiyong Yang for providing the Yang and Purves dataset which was the basis for much of our analysis; James Elder for helpful comments on an earlier version of this work, and Compute Canada for computational resources. This research was supported by an NSERC Discovery Grant to Michael Langer.
References
1AdamsW. J.ElderJ. H.GrafE. W.LeylandJ.LugtigheidA. J.MuryyA.2016The Southampton-York Natural Scenes (SYNS) dataset: Statistics of surface attitudeSci. Rep.63580510.1038/srep35805
2BianZ.BraunsteinM. L.AndersenG. J.2005The ground dominance effect in the perception of 3-d layoutPerception & Psychophysics67802815802–1510.3758/BF03193534
3BianZ.AndersenG. J.2008Aging and the perceptual organization of 3-d scenesPsychol. Aging2334210.1037/0882-7974.23.2.342
4BianZ.AndersenG. J.2010The advantage of a ground surface in the representation of visual scenesJ. Vis.10161616–10.1167/10.8.16
5BurgeJ.FowlkesC. C.BanksM. S.2010Natural-scene statistics predict how the figure–ground cue of convexity affects human depth perceptionJ. Neurosci.30726972807269–8010.1523/JNEUROSCI.5551-09.2010
6ChampionR. A.WarrenP. A.2010Ground-plane influences on size estimation in early visual processingVis. Res.50151015181510–810.1016/j.visres.2010.05.001
7CloudCompare, version 2.11.0, Jul. 12, 2020. [Online]
8DurginF. H.LiZ.2011Perceptual scale expansion: An efficient angular coding strategy for locomotor spaceAttention, Perception, & Psychophysics73185618701856–7010.3758/s13414-011-0143-5
9EpsteinW.1966Perceived depth as a function of relative height under three background conditionsJ. Experimental Psychology72335338335–810.1037/h0023630
10FeldmanJ.2013Tuning your priors to the worldTopics in Cognitive Science5133413–3410.1111/tops.12003
11FeriaC. S.BraunsteinM. L.AndersenG. J.2003Judging distance across texture discontinuitiesPerception32142314401423–4010.1068/p5019
12GeislerW. S.2008Visual perception and the statistical properties of natural scenesAnnu. Rev. Psychol.59167192167–9210.1146/annurev.psych.58.110405.085632
13GibsonJ. J.The Perception of the Visual World1950Houghton MifflinBoston, MA
14GibaldiA.CanessaA.SabatiniS. P.2017The active side of stereopsis: Fixation strategy and adaptation to natural environmentsScientific Reports71181–1810.1038/srep44800
15GibaldiA.BanksM. S.2019Binocular eye movements are adapted to the natural environmentJ. Neurosci.39287728882877–8810.1523/JNEUROSCI.2591-18.2018
16GogelW. C.1969The sensing of retinal sizeVision Res.9107910941079–9410.1016/0042-6989(69)90049-2
17GogelW. C.TietzJ. D.1973Absolute motion parallax and the specific distance tendencyPerception & Psychophysics13284292284–9210.3758/BF03214141
18GillamB.Chapter 2 – The perception of spatial layout from static optical informationPerception of Space and MotionHandbook of Perception and Cognition1995Academic PressSan Diego236723–6710.1016/B978-012240530-3/50004-3
19HackelT.SavinovN.LadickyL.WegnerJ. D.SchindlerK.PollefeysM.Semantic3D.net: A new large-scale point cloud classification benchmarkISPRS Annals of Photogrammetry, Remote Sensing and Spatial Information Sciences2017Vol. IV-1/W1919891–810.5194/isprs-annals-IV-1-W1-91-2017
20HarrisC. R.MillmanK. J.van der WaltS. J.GommersR.VirtanenP.CournapeauD.WieserE.TaylorJ.BergS.SmithN. J.KernR.PicusM.HoyerS.van KerkwijkM. H.BrettM.HaldaneA.del RíoJ. F.WiebeM.PetersonP.Gérard-MarchantP.SheppardK.ReddyT.WeckesserW.AbbasiH.GohlkeC.OliphantT. E.2020Array programming with NumPyNature585357362357–6210.1038/s41586-020-2649-2
21HeZ. J.WuB.OoiT. L.YarbroughG.WuJ.2004Judging egocentric distance on the ground: Occlusion and surface integrationPerception33789806789–80610.1068/p5256a
22HibbardP. B.BouzitS.2005Stereoscopic correspondence for ambiguous targets is affected by elevation and fixation distanceSpatial Vis.18399411399–41110.1163/1568568054389589ISSN: 0169-1015
23HuangJ.LeeA. B.MumfordD.Statistics of range imagesProc. IEEE Conf. on Computer Vision and Pattern Recognition. CVPR2000Vol. 1IEEEPiscataway, NJ324331324–31
24HunterJ. D.2007Matplotlib: A 2d graphics environmentComputing in Science & Engineering9909590–510.1109/MCSE.2007.55
25KavšekM.GranrudC. E.2013The ground is dominant in infants’ perception of relative distanceAttention, Perception, & Psychophysics75341348341–810.3758/s13414-012-0394-9
26LangerM. S.MannanF.2012Visibility in three-dimensional cluttered scenesJ. Opt. Soc. Am. A29179418071794–80710.1364/JOSAA.29.001794
27LiuY.BovikA. C.CormackL. K.2008Disparity statistics in natural scenesJ. Vis.8191919–10.1167/8.11.19
28McCarleyJ. S.HeZ. J.2000Asymmetry in 3-d perceptual organization: Ground-like surface superior to ceiling-like surfacePerception & Psychophysics62540549540–910.3758/BF03212105
29McKinneyW.van der WaltS.MillmanJ.Data structures for statistical computing in pythonProc. 9th Python in Science Conf.2010566156–6110.25080/Majora-92bf1922-00a
30MengJ. C.SedgwickH.2001Distance perception mediated through nested contact relations among surfacesPerception & Psychophysics631151–1510.3758/BF03200497
31Morin DuchesneX.Distance perception and natural scene statistics: What can we learn from object-ground segregation and Simulated LiDAR Repositioning,” M.Sc. thesis, (McGill University, 2021)
32Morin-DuchesneX.LangerM. S.“Simulated lidar repositioning: a novel point cloud data augmentation method,” arXiv Preprint arXiv:2111.10650, (2021)
33OoiT. L.WuB.HeZ. J.2001Distance determined by the angular declination below the horizonNature414197200197–20010.1038/35102562
34OoiT. L.WuB.HeZ. J.2006Perceptual space in the dark affected by the intrinsic bias of the visual systemPerception35605624605–2410.1068/p5492
35OoiT. L.HeZ. J.2007A distance judgment function based on space perception mechanisms: revisiting gilinsky’s (1951) equationPsychological Review11444110.1037/0033-295X.114.2.441
36PotetzB.LeeT. S.2003Statistical correlations between two-dimensional images and three-dimensional structures in natural scenesJ. Opt. Soc. Am. A20129213031292–30310.1364/JOSAA.20.001292
37ProffittD. R.BhallaM.GossweilerR.MidgettJ.1995Perceiving geographical slantPsychonomic Bulletin and Review2409428409–2810.3758/BF03210980
38ReichelF. D.ToddJ. T.1990Perceived depth inversion of smoothly curved surfaces due to image orientationJ. Experimental Psychology: Human Perception and Performance16653664653–6410.1037/0096-1523.16.3.653
39RudermanD. L.1997Origins of scaling in natural imagesVis. Res.37338533983385–9810.1016/S0042-6989(97)00008-4
40SedgwickH. A.The Visible Horizon: A Potential Source of Visual Information for the Perception of Size and Distance1973Cornell UniversityIthaca, NY
41SinaiM. J.OoiT. L.HeZ. J.1998Terrain influences the accurate judgement of distanceNature395497500497–50010.1038/26747
42SimoncelliE. P.OlshausenB. A.2001Natural image statistics and neural representationAnn. Rev. Neurosci.24119312161193–21610.1146/annurev.neuro.24.1.1193
43SpragueW. W.CooperE. A.TošićI.BanksM. S.2015Stereopsis is adaptive for the natural environmentSci. Adv.1e140025410.1126/sciadv.1400254
44StefanucciJ. K.ProffittD. R.CloreG. L.ParekhN.2008Skating down a steeper slope: Fear influences the perception of geographical slantPerception37321323321–310.1068/p5796
45SuC.-C.CormackL. K.BovikA. C.2017Bayesian depth estimation from monocular natural imagesJ. Vis.17222222–10.1167/17.5.22
46ThompsonW. B.DildaV.Creem-RegehrS. H.2007Absolute distance perception to locations off the ground planePerception36155915711559–7110.1068/p5667
47Van RossumG.DrakeF. L.Python 3 Reference Manual2009CreateSpaceScotts Valley, CAISBN: 1441412697
48Warren JrW. H.WhangS.1987Visual guidance of walking through apertures: body-scaled information for affordancesJ. Experimental Psychology: Human Perception and Performance1337110.1037/0096-1523.13.3.371
49WragaM.1999The role of eye height in perceiving affordances and object dimensionsPerception & Psychophysics61490507490–50710.3758/BF03211968
50WuB.OoiT. L.HeZ. J.2004Perceiving distance accurately by a directional process of integrating ground informationNature428737773–710.1038/nature02350
51WuB.HeZ. J.OoiT. L.2007Inaccurate representation of the ground surface beyond a texture boundaryPerception36703721703–2110.1068/p5693
52WuJ.HeZ. J.OoiT. L.2014The visual system’s intrinsic bias influences space perception in the impoverished environmentJ. Experimental Psychology: Human Perception and Performance4062610.1037/a0033034
53YangZ.PurvesD.2003A statistical explanation of visual spaceNature Neurosci.6632640632–4010.1038/nn1059
54ZhangW.QiJ.WanP.WangH.XieD.WangX.YanG.2016An easy-to-use airborne lidar data filtering method based on cloth simulationRemote Sens.850110.3390/rs8060501
55ZhouQ.-Y.ParkJ.KoltunV.“Open3D: A modern library for 3D data processing,” arXiv:1801.09847, (2018)