Back to articles
Regular Articles
Volume: 4 | Article ID: jpi0135
Image
Study of Bomb Technician Threat Identification Performance on Degraded X-ray Images
  DOI :  10.2352/J.Percept.Imaging.2021.4.1.010502  Published OnlineJanuary 2021
Abstract
Abstract

Portable X-ray imaging systems are routinely used by bomb squads throughout the world to image the contents of suspicious packages and explosive devices. The images are used by bomb technicians to determine whether or not packages contain explosive devices or device components. In events of positive detection, the images are also used to understand device design and to devise countermeasures. The quality of the images is considered to be of primary importance by users and manufacturers of these systems, since it affects the ability of the users to analyze the images and to detect potential threats. As such, there exist national standards that set minimum acceptable image-quality levels for the performance of these imaging systems. An implicit assumption is that better image quality leads to better user identification of components in explosive devices and, therefore, better informed plans to render them safe. However, there is no previously published experimental work investigating this.

Toward advancing progress in this direction, the authors developed the new NIST-LIVE X-ray improvised explosive device (IED) image-quality database. The database consists of: a set of pristine X-ray images of IEDs and benign objects; a larger set of distorted images of varying quality of the same objects; ground-truth IED component labels for all images; and human task-performance results locating and identifying the IED components. More than 40 trained U.S. bomb technicians were recruited to generate the human task-performance data. They use the database to show that identification probabilities for IED components are strongly correlated with image quality. They also show how the results relate to the image-quality metrics described in the current U.S. national standard for these systems, and how their results can be used to inform the development of baseline performance requirements. They expect these results to directly affect future revisions of the standard.

Subject Areas :
Views 90
Downloads 17
 articleview.views 90
 articleview.downloads 17
  Cite this article 

Jack L. Glover, Praful Gupta, Nicholas G. Paulter Jr., Alan C. Bovik, "Study of Bomb Technician Threat Identification Performance on Degraded X-ray Imagesin Journal of Perceptual Imaging,  2021,  pp 010502-1 - 010502-13,  https://doi.org/10.2352/J.Percept.Imaging.2021.4.1.010502

 Copy citation
  Copyright statement 
Copyright © Society for Imaging Science and Technology 2021
  Article timeline 
  • received June 2020
  • accepted February 2021
  • PublishedJanuary 2021

Preprint submitted to:
jpi
Journal of Perceptual Imaging
J. Percept. Imaging
J. Percept. Imaging
2575-8144
Society for Imaging Science and Technology
1.
Introduction
Bomb technicians perform a vital role in the community, helping to locate explosive devices and render them safe before they can do harm. In 2018 alone, there were 17,968 explosives related incidents in the United States, according to the United States Bomb Data Center (USBDC) (The USBDC is part of the Bureau of Alcohol, Tobacco, Firearms and Explosives which is part of the Department of Justice.) [38]. These incidents included 7,305 explosives recoveries, 7,408 suspicious or unattended packages, and 1,628 bomb threats. The most serious incidents were the 706 explosions and 289 bombings that led to more than 72 injuries and 16 fatalities, a number could have been much higher if not for the work of bomb technicians. In the United States and many other countries, responsibility for the disposal of explosive devices is divided between military and civilian agencies. In the military realm, explosive ordnance disposal teams are responsible for dealing with unexploded conventional munitions, improvised explosive devices (IEDs), and other explosives in a military context. Similarly, while public safety bomb squads are responsible for addressing these potential threats in a civilian context. We will use the phrase bomb technician to refer to both groups of experts throughout.
Portable X-ray systems are one of the most important tools used by bomb technicians, and are used routinely in the identification and disposal of IEDs. The use of these systems serves two main purposes: to determine whether a suspected device is benign or an IED; then, if an IED is located, the X-ray system is used to help understand the design of the IED and to formulate a plan to render it safe. The X-ray systems used for this purpose must be small, battery powered, and highly portable, since IEDs can be hidden almost anywhere. Since IEDs are sometimes hidden in vehicles or utilize containers such as pressure cookers or steel pipes, the sources generally use X-ray energies up to a few hundred keV. While early X-ray systems used X-ray film, most bomb technicians now use systems based on digital panels that can be directly read out by a computer or photostimulable phosphor (PSP) imaging plates that must be exposed first then digitized by a dedicated reader.
All U.S. public safety bomb technicians are trained and certified by the Hazardous Devices School, located at Redstone Arsenal in Huntsville, Alabama. (https://www.fbi.gov/news/stories/hazardous-devices-school (accessed: 10th Dec 2020).) Their training includes courses in X-ray image interpretation, where they are taught to interpret the design of IEDs so that they can devise effective countermeasures. For example, some IEDs can be “rendered safe” by using a high-explosive charge to disrupt the trigger mechanism before it can fire. During their X-ray interpretation training, bomb technicians are taught the five major constituent components of an IED: switches, detonators, explosive charges, power sources or batteries, and usually some form of container. We will use the same component categories in this work. Since at least 2016, all bomb technicians have been trained to view, enhance, analyze, and label their images using the X-ray Toolkit (XTK) software. (https://xraytoolkit.sandia.gov (accessed: 10th Dec 2020).)
While there have been previous efforts to characterize the performance of commercial portable X-ray systems for use by bomb technicians, few if any of these efforts resulted in publications in the open literature. One notable effort in recent years has been the Response and Defeat Operations Support (REDOPS) program, (REDOPS is a Department of Homeland Security (DHS) Science and Technology (S&T) Directorate program that supports public safety bomb technicians.) which has tested dozens of X-ray systems as part of their “bomb squad test bed X-ray assessment.” REDOPS assessments involve gathering bomb technicians to test equipment and assess the usability, reliability, and effectiveness of that equipment. The assessments also included objective image-quality assessment using the Institute of Electrical and Electronics Engineers/American National Standards Institute (IEEE/ANSI) N42.55 standard. The testing is described in reports that can be accessed at the Law Enforcement Enterprise Portal (LEEP), (LEEP is an electronic gateway that provides centralized access to a wide range of law-enforcement resources (see https://www.fbi.gov/services/cjis/leep (accessed: 10th Dec 2020)).) to those with permission to access this law-enforcement sensitive data.
Measurement standards for image quality are widely used in security imaging [18], and there have been a number of standards developed specifically for portable X-ray systems used by bomb squads. One example is the National Institute of Justice (NIJ) standard 0603.01, which is entitled “Portable X-Ray Systems for Use in Bomb Identification” [29]. (Development of the 2007 revision of NIJ 0603.01 was led by Nicholas Paulter.) The standard describes a test object that consists of bar patterns and rings of wire behind varying thicknesses of steel blocking material. The standard also gives minimum performance specifications for image quality, that require the system to permit 33 American wire gauge (AWG) tungsten wire behind 10 mm of steel to “be seen.” This and all previous similar standards were based on subjective tests, hence human visual judgments were used to determine whether objects were “resolved” or “seen.”
The most recently developed U.S. national standard for these systems is the IEEE/ANSI N42.55 “American National Standard For The Performance Of Portable Transmission X-Ray Systems For Use In Improvised Explosive Device And Hazardous Device Identification” [20]. (The first revision of IEEE/ANSI N42.55 was published in 2013 and was chaired by Nicholas Paulter. The vice chairs were Jack Glover and Lawrence Hudson.) The standard was a major revision of the NIJ standard, that included an overhaul of the image-quality section and a completely new test object. The transition of most systems to digital imaging allowed for the specification to add test methods that were analyzed using standardized and objective algorithms, as opposed to subjective human judgments. The N42.55 standard defined a set of image-quality metrics including: spatial resolution; dynamic range; steel penetration; and organic penetration. The objective test methods described in the N42.55 standard have since been adapted for use with other security imaging technologies, such as the cabinet X-ray systems that are commonly used to scan carry-on luggage at airports [11].
1.1
Related Work
Despite the importance of portable X-ray systems in the work of bomb squads, there has been very little academic research into their efficacy. There have been many extensive studies of the performance of X-ray devices in the medical domain, including detailed studies of detection rates as a function of image quality and other human factors. More detailed studies into the factors affecting detection have also been conducted in other areas of security imaging, such as aviation security and military applications. We will briefly review some of that work to provide some context for the work presented here.
The detection of simple objects in images has been a topic of interest for many years [3]. The archetypal example of detecting a disk on a background of white noise was an early problem of interest, since statistical methods could be applied and detection thresholds could be obtained, for example, the Rose criterion [31]. In subsequent decades, methods were developed for more complex signal shapes and less simplified noise patterns. These methods often made use of statistical decision theory and some type of ideal observer that made a decision about the presence or absence of a signal based on a statistical calculation of maximum likelihood. Most of these models dealt with the so-called “signal known exactly/background known exactly” (SKE/BKE) detection problem, which is often an over-simplification of real object detection tasks. Many methods calculate the signal-to-noise ratio, often in Fourier space, given the presence of a known signal. Generally, these methods have shown good agreement with measured detection rates for humans, often after application of an efficiency function to correct for the fact that humans are suboptimal statistical decision makers [26, 32]. These methods have been widely used in the medical field [5, 6, 34, 41].
X-ray screening systems have been used in aviation security for many decades. While there has been a large volume of work studying human task performance, only some of it has been published in the open literature, due to the security sensitive nature of the results. For example, the Transportation Security Laboratory (TSL) measures detection rates for security-relevant threats for all X-ray and millimeter wave imaging systems used in U.S. airports, but does not distribute the results since they are considered classified [14]. Despite the sensitivity of the results, some groups have published studies investigating different aspects of human task performance in aviation security. For example, researchers at the Center for Adaptive Security Research and Applications (CASRA) have investigated how bag screening task performance is affected by such factors as: screener training [22]; visual knowledge [33]; screener age, gender [30] and other demographic factors [4]; clutter [33]; object orientation [33]; 2D vs 3D imaging [16]; screener work breaks [7]; and image enhancement techniques [27]. There does not appear to be much, if any, published work studying the effect of image quality on task performance in aviation security. This is somewhat surprising, given the importance that is placed on image quality, as evidenced by the considerable resources devoted to image-quality standards [19], the wide use of such standards for people screening [2], checked [18] and carry-on [11] baggage scanning, and the reported economic benefits that such standards bring [25].
The U.S. military has devoted considerable effort toward developing semi-analytical models that predict human task performance as a function of image quality, particularly at infrared wavelengths. Early efforts generally concentrated on resolving power as the metric of choice, using a Johnson criterion as a threshold. The Johnson criteria give the resolving powers necessary to detect, recognize, or identify a target based on the number of line pairs on target. In his 1958 paper, Johnson’s empirical measurements suggested that (6.4 ± 1.5) line pairs per minimum target dimension were required for a human operator to identify an object, whereas only (1.0 ± 0.25) line pairs per minimum target dimension were needed for detection [21]. Beginning in the 1990s, the U.S. Army Night Vision and Electronic Sensors Directorate (NVESD) spearheaded the development of a series of more advanced models that gradually matured into night vision integrated performance model (NV-IPM) [37]. The NV-IPM task-performance model is a spatial-frequency-domain model for predicting human task performance based on the properties of the target, imager, and the human visual system. In addition to the tanks, self-propelled guns, and trucks that the model was initially validated against, the model has also been used to predict face recognition [36] and ship detection performance [39]. More details about NV-IPM can be found in [35] and [36]. For a more complete historical review of the task-performance models that are relevant to military applications, see Vollmerhausen and Jacobs [40].
In the context of visible light (VL) imaging, early standardization efforts in task-based video quality assessment led to the development of Recommendation ITU-T P.912, which introduced basic definitions, methods of testing, and protocols for conducting subjective psychophysical experiments, all for developing better was to evaluate the quality of videos arising in target recognition tasks [9]. Another major effort is the DHS S&T Video Quality in Public Safety (VQiPS) working group, which was initiated in collaboration with the NIST Public Safety Communications Research (PSCR) program, to provide guidance documents and requirements regarding the appropriate use of video systems for public safety. Some later work has investigated methods of assessing video quality for task-based video to study the effect of compression and other scene characteristics such as: target size, lighting conditions, and temporal complexity [8, 23, 24].
We are not aware of any task-performance studies related to portable X-ray security imagers. In this article, we describe our work performing such a study, with particular emphasis on the effect of image quality on detection performance. We also show how such data can be used to inform the development of future standards and as part of novel image-quality research. We plan to make the database available to researchers for use in other ways, for example, as a benchmark for machine-learning-based automatic detection algorithms for IED components (please contact us if you are interested in using the database as part of your research).
The database has already been used in Gupta et al [12] to develop models that predict the effect of image quality on the detection performance. The suite of task prediction models described in that paper is referred to as quality inspectors of X-ray images (QUIX) and was based on perceptually relevant natural scene statistics (NSS). This was the first work of its kind, and would not have been possible without the database that we describe in detail in this manuscript.
2.
NIST-LIVE X-ray IED Image-Quality Database
The database of X-ray images of IEDs, which we refer to as the NIST-LIVE X-ray IED image-quality database was created in two steps. First, a set of pristine images of the IEDs and IED components were produced using a high quality X-ray imaging system. Next, we developed physics-based synthetic image-quality degradation models that allowed us to create a much larger database, by applying varying levels of image-quality degradation to each pristine image. The pristine images still have some noise and finite spatial resolution, and are called pristine because they were generated using a high quality imaging system and to distinguish them from the degraded images.
2.1
Pristine Images
The image database was created with the intent that it reflect images, including distorted images, that would be encountered by practicing bomb technicians in the field. In particular, we concentrated on improvised explosive device (IED) scenarios where IED components were hidden in backpacks, boxes, trashcans, and other everyday containers. We obtained IEDs from a commercial source that specializes in manufacturing explosive simulants and inert IEDs for testing and training purposes. There were seven basic IED designs and some basic information about each is given in Table I. It is common to divide an IED into four major component types: explosive charge; activator; initiator; and power source. The explosive charge is the bulk material that releases the majority of energy in an explosion. By analogy, the equivalent component in a chemical IED would be the one or more bulk chemicals in the device. An activator is a component that can render the device operable or inoperable, for example, an arming switch, sensor, or remote activation device. The initiator is the component that causes the charge to initiate, for example, a commercial blasting cap can be used to detonate a secondary high explosive. The power source is a component that provides power to the other devices in the IED, for example, a battery that is used to set off a detonator. Sometimes a fifth component is listed, namely, the body that the IED is contained in (e.g., pipe or pressure cooker etc.).
Table I.
Details of the inert IEDs used in this study, including the activation and initiation methods as well as the type of charge and power source utilized.
IED typeSwitch/activatorDetonator/initiatorCharge/explosivePower source
Suitcase IEDCell phone trigger and arming switch. Once armed, the device can be remotely activated by calling the cell phone.Commercial blasting cap and cast-TNT boosterANFO simulant6 V Lantern battery
Photocell activated pipe bombPhotocell and arming switch. Once armed, the device is activated by exposure of circuit to light (e.g., by opening the bag or box containing the IED).SquibMetal pipe bomb2 × D batteries
Anti-probe IEDTwo layers of Al foil separated by paper. Activated by physical entry attempt which causes foil layers to touch and complete circuit.Commercial blasting capC4 simulant2 × D batteries
Chemical IEDMicroswitch to arm.Commercial blasting capLiquid chemical simulants2 × D batteries
Laundry detergent PVC pipe IEDBall tilt switch and arming switch. Once armed, the device is activated by ball switch which is triggered by physical movement of IED.SquibSmokeless powder in PVC pipe2 × 9 V batteries
Steel plate IEDTimer and arming switch. Once armed, the device is activated by an analog timer.SquibBlack powder simulant1 × 9 V battery
Pressure cooker IEDRadio-controlled servo switch (remote activated).SquibBlack powder simulant4 × AA batteries
The pristine images were generated using two portable, battery powered, pulsed X-ray sources. Such sources are almost ubiquitous among bomb technicians in the United States of America, since they are generally smaller, lighter, and higher energy than portable continuous, constant-potential sources. One source was a lightweight (about 2.1 kg), lower energy (approximately 150 keV maximum) pulsed X-ray source, while the other was a larger, heavier, (about 5.3 kg) and higher energy source (approximately 270 keV maximum). The images were collected using PSP imaging plates (about 36 cm × 43 cm), at a source-to-detector distance of 200 cm, and read using a dedicated PSP reader. The pristine images had a grayscale depth of 16 bits, a pixel pitch of nominally 65 μm, and each image was approximately 5300 × 6300 pixels.
Figure 1.
A few examples of the pristine X-ray images from the NIST-LIVE X-ray image database.
The pristine image database consisted of images of the seven IEDs in Table I as well as images of benign everyday objects that could potentially be used to conceal an IED, such as a trash can or toolbox. To create a larger variety of images, the IEDs were imaged from a number of angles and in a variety of situations. For example, IEDs were imaged out in the open, and in trashcans, toolboxes, and backpacks. Some were imaged through steel sheets and some had a laptop placed in front of them to add clutter to the image. By this process, 58 pristine X-ray images were generated. A subset of these were later used in the human study and some examples of these are shown in Figure 1. Since the images had more pixels than could be displayed on a typical computer monitor, and since they had 16 bits of grayscale depth, it was generally necessary to zoom and adjust the contrast to see all the detail present in the images (see Figure 2). Since the design of each IED was known, a set of ground-truth bounding boxes and component labels were created.
Figure 2.
An image of an IED that is obscured behind a steel sheet. The area inside the green box contains the switch. Much more detail is visible when basic enhancement methods are used on these high fidelity images, as is evident in the expanded and contrast-adjusted area shown inside the blue box.
2.2
Image Degradation Model
Image degradation algorithms were developed based on the underlying physics of the imaging system as well as empirical observations about the noise properties of similar portable X-ray systems. Degradation models were created to reduce the spatial resolution of the images and to corrupt them with spatially correlated noise (SCN). Using these models, we were able to expand the database of pristine images into a much larger database of varying quality images. We shall first describe our generative noise model, and then our model for reducing the spatial resolution.
It is common in X-ray imaging, and in X-ray physics more widely, to assume that the counts received by individual X-ray detector elements follow Poisson counting statistics. The data plotted in Figure 3 are from a typical pristine image in our database, and were taken from the regions with lower variance-to-mean ratio (i.e., relatively flat). The image shows the roughly linear relationship between local mean and local variance that one would expect from a system exhibiting Poisson-like photon-counting statistics. We therefore developed a synthetic model of image noise that would also show Poisson-like local statistical properties.
Figure 3.
Scatter plot of the local variance in grayscale (measured over a 31 px by 31 px region) as a function of the mean grayscale of that region. These data were taken from one of the pristine X-ray images, so many of the regions showed high variance due to the structure of the image content (e.g., edges). These high variance regions are not included in this plot, in particular, only that quarter of the data with the lowest variance-to-mean ratio is shown. This is why the plotted data has a flat diagonal ceiling to it.
Let us assume that a detector element receives an average of λ counts during its integration time, and that each count yields an equal grayscale response. In this situation, the probability of detecting x counts follows a Poisson distribution with mean λ:
(1)
Pr(x)=eλ(λ)xx!.
In the limit of high counts, it can be shown that this distribution can be approximated by a Gaussian distribution with a standard deviation of λ (i.e., a variance equal to λ).
These observations can be used to determine the relationship between pixel grayscale units I and the corresponding number of absorbed X-rays N [17], which can be assumed to be linear for the imaging plate detectors at the dose levels considered in this work [1]
(2)
I=gN,
where g is the gain of the imaging device, measured in average grayscale units per photon interaction event. One consequence of these relations is that the image will exhibit a constant variance-to-mean ratio on locally flat regions of the image
(3)
V ar [I][I]=g2V ar [N]g[N]=gλλ=g,
where Var[I] and E[I] are the variance and expectation value of I. This equation can be used to determine g from the slope of the data in Fig. 3.
This model can be used to introduce greater fractional noise, by simulating an image with fewer counts. Starting with the pristine image, Iprist(x, y), let us assume we wish to model the noise associated with an image that had k times fewer counts. The effective number of counts, Neff, would be equal to Nk, and the expected noise distribution would be a normal distribution with a standard deviation of Nk. These values could be determined in grayscale units using the previously determined coefficient, g. We can then calculate the simulated noisy image, Nnoisy(x, y), using
(4)
Nnoisy(x,y)=Nprist(x,y)k+Nnoise,
where Nnoise is randomly sampled from a normal distribution with a variance of Nk, representing the simulated additive noise that one would expect due to the reduced counts being simulated. Since the signal is reduced by a factor of 1∕k and the additive noise is reduced by a factor of 1k compared to the expected level of noise in the original image, the fractional noise is increased by a factor of k. Since Iprist had some natural noise before the simulated noise was added to it, the level of noise in the final image is 1+k times the noise in Iprist. This is slightly larger than the intended value of k, but close enough for the large values of k considered here (k = {8,16,32,64,128,256,512,1024}).
While the stationary Poisson noise described so far is important, many X-ray imaging systems also exhibit noise with more spatial structure, which we will refer to as spatially correlated noise (SCN). We surveyed 17 commercially available portable X-ray systems, all of which were marketed to bomb technicians. Each system included a portable detector and a portable X-ray source, and while some systems used the same source models, all 17 had different detector designs. The noise power spectrum (NPS) of each system was recorded after the detector was irradiated from approximately 2 m. All the systems showed an NPS whose magnitude decreased with increasing frequency, and most showed an exponential decrease over part or most of the frequency range up to the Nyquist frequency. The empirical densities of the NPS were fit to the noise density model αfp, and it was found that the best-fit values of p generally fell in the range between 0.3 and 2. A typical example NPS and fit is shown in Figure 4(a). Fig. 4(b) shows all the measured NPS as well as the NPS associated with our SCN model.
Figure 4.
Noise power spectra (NPS) were measured for a variety of portable X-ray systems marketed to bomb technicians. The y-axes are in units of (grayscale units)2 and the x-axes are in units of cycles/mm. (a) A typical NPS obtained from one of the systems. The NPS follow a αfp form with a fitted p value of approximately 1.84. The error bars represent the standard error based on the independent NPS estimated from each row. (b) The NPS measured for all investigated systems are plotted against frequency. Each spectrum was normalized to have a value of 1 at 0.04 cycles/mm. The black line shows our SCN noise model, which we set to have frequency dependence that represented a worst case scenario of p = 2 (i.e., a large but representative gradient). Uncertainties on the experimental points are generally in the 1% to 30% range, but have been left off (b) to make the trends more visible.
The final noise model was taken as the product of the Poisson and SCN noise models, so that the model has the appropriate properties with respect to spatial frequency and intensity. The additive noise field, NSCN,noise, is then given by the equation
(5)
NSCN,noise(x,y)=SCN(x,y)Nnoisek+η,
where SCN(x, y) is a noise field having a power spectrum proportional to f−2 that has been normalized to have unit local variance as described in Appendix A. The constant η accounts for other sources of noise that might become significant at low count rates, that we have empirically set to a value of 1.
The spatial resolution of the images was also degraded. Spatial resolution can be affected by a range of factors and phenomena, from pixel pitch to source-size broadening. Whatever the factor that limits the spatial resolution of a system, in the context of threat identification, the end result is an attenuation of the higher frequency components of the signal associated with the threat. We chose to model this effect by using Gaussian blur, such as one might see when spatial resolution is limited by source broadening. In the remainder of this work, we use the term blur to refer to the degradation of the spatial resolution. The reduction in spatial resolution was simulated by applying five different levels of blur to each image, using Gaussian kernels with standard deviations of σb = {8,16,32,64,128} pixels. In cases where the pristine images were degraded with blur only, they had an unnaturally smooth appearance. In these cases, we used the SCN noise model described earlier to restore representative noise to the blurred image (k = 1). This value of k corresponds, approximately, to the level of noise in the original image.
The final degraded image Ndegr(x, y) was generated using
(6)
Ndegr(x,y)=Nprist(x,y)kGσb(x,y)+NSCN,noise(x,y),
where Gσb(x, y) is a circularly symmetric, normalized Gaussian kernel of standard deviation σb pixels. Figure 5 shows a selection of zoomed-in regions of various IED components as they appear in the database at different levels of degradation.
Figure 5.
Some examples of components that appear in the NIST-LIVE X-ray IED Image-Quality Database with varying image quality. The top row shows a switch, the middle row a battery as viewed through thin steel, and the bottom row shows a detonator in a cluttered environment. These images are regions of interest of approximately 700 pixels × 1300 pixels. These 16-bit pixel values in these image patches have been rescaled to 8-bit with the darkest pixel(s) being mapped to a grayscale value of 0 and the brightest pixels being mapped to a grayscale value of 255. The image quality was degraded such that σb = 16 and k = 64.
There are a large variety of commercial portable X-ray systems marketed to bomb squads, with varying form factors and image quality. These systems show a diversity of noise properties, and we could not hope to analyze them all, particularly given the restricted number of subjects we had access to. Instead, we chose to vary two important parameters (blur and noise) using a representative noise power spectrum. In the interest of mapping these parameters over the full region interest, we varied them over a range such that the subjects began to fail at their detection task. This means that many of the images exhibit more extreme distortions than are observed for typical commercial systems. One also tends not to see commercial systems that are extremely noisy with excellent spatial resolution, or with very low noise but poor spatial resolution. We chose to include such images because it allowed us to understand the effects of blur and noise separately. Moreover, we have found in many previous studies that using a wider range of distortion severities (than might appear in practice) helps in building better, more accurate, and predictable models overall.
3.
Measuring the Identification Performance of Bomb Technicians
Figure 6.
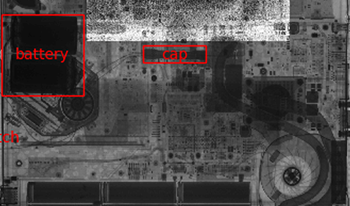
Example images are shown that demonstrate how the bomb technicians enhanced and labeled the images from the NIST-LIVE image database. (a) An image of the chemical IED behind a laptop. The bomb technician has successfully labeled the microswitch, battery, and blasting cap, but not the liquid chemical simulants. In the top center of the image, the brighter rectangular region shows where the bomb technician enhanced brightness and contrast. (b) An image of the photocell IED in which the bomb technician was able to identify the pipe bomb and power source, but not the photocell initiation mechanism or arming switch.
We recruited 41 U.S. trained bomb technicians to view images from the database and label the IED components they could locate and identify. (The National Institute of Standards and Technology Research Protections Office reviewed the protocol for this project and determined it meets the criteria for “exempt human subjects research” as defined in 15 CFR 27, the Common Rule for the Protection of Human Subjects.) All U.S. bomb technicians are trained at the Hazardous Devices School, where X-ray interpretation is taught using the XTK software, hence XTK was also used to conduct this study. In most cases during the study, the bomb technicians used the same computers that they would use for their field work. The computers were generally consumer-grade devices, except perhaps for some ruggedization. The bomb technicians were recruited with the help of the National Bomb Squad Commanders Advisory Board (NBSCAB), who connected us with regional contacts in different areas. All of our data were collected in the vicinity of three cities: Washington, D.C.; Denver, CO; and Jacksonville, FL. Each bomb technician participated for around 15 mins to 90 mins and were asked to undertake the following steps:
View a series of X-ray images that may or may not contain an IED.
Enhance the image to the extent necessary to search every region. This would generally involve some zooming and contrast manipulation, since both the size and dynamic range of the images cannot be fully represented on consumer displays.
Label the following IED component types, when identified: switches; detonators; explosive charges; power sources, with a bounding box and text describing the component. If no components were found, the image should be labeled with “empty” or “nothing.”
The XTK software saved the labels in a metadata file that could be easily read for the purpose of data analysis, and some example labels are shown in Figure 6.
The bomb technician task-performance data were analyzed with respect to the known image-quality parameters that were varied in the image database. This allowed for the identification of task-performance trends as a function of image quality and the development of models to predict performance. Figure 7 shows example task-performance data for a particular IED component. Component type is omitted because the results could be considered sensitive. In Fig. 7(a), we can observe the region in the noise–blur plane where the bomb technicians could no longer locate and identify this particular IED component. One can also fit models to this data to predict task performance in the entire noise–blur plane, including where there were no measurements (see Fig. 7(a)). A logistic regression model with the following form, was used to predict the probability of identification, PID, as a function of the known noise and blur values. The model was fit to the measured task-performance data for each component and clutter state. Example results are shown in orange in Fig. 7(b) and as expected, task performance was strongly affected by image quality.
Figure 7.
Some example task-performance data for a particular IED component and a particular clutter state. (a) Each point represents an attempt by a bomb tech to locate a particular component, when that component is present. If the point is blue, the component was found (red indicates that it was not). A small amount of random position variability was included so that it is possible to see how much data are present at each grid point. The blur level is quantified by σb in units of pixels and the noise level is quantified by k which is dimensionless. The spacing between levels would be linear when plotted on a log scale. (b) This plot represents task performance for the blur = 0 line from the left plot. The orange line shows a logistic regression model that has been fitted to all the data in the left figure. Agresti–Coull binomial confidence limits are shown.
Another strong effect observable in the data was the negative effect of clutter on task performance. We will not quantify the magnitude of the clutter effect, however we can provide some operational recommendations. When an image is strongly affected by clutter, it would be prudent to take additional images from other angles when it is possible. This may make some components visible that were obscured by clutter in the original image.
The bomb technician task-performance data described in this section can be used for numerous purposes. In Section 4, we will show how its analysis can be used to inform the development of image-quality standards and to inform baseline performance requirements. In Section 5, we suggest some other possible uses for the data and point to some existing publications that have already made use of it.
3.1
Subject-to-Subject Performance Variation
The primary factors affecting the ability of our subjects to detect IED components were the clutter state and component type, but an interesting secondary factor is the subject-to-subject performance variation. Since all U.S. public safety bomb technicians are trained at the Hazardous Devices School, using the same techniques and image manipulation software, one might naively expect participants to undertake detection tasks using similar steps and achieve similar results. However, analogous studies in related areas have measured and identified a number of factors that are associated with subject-to-subject differences in performance. Halbherr et al. showed that the X-ray detection performance of aviation security screeners was significantly affected by both the recency and amount of their computer-based training [15]. U.S. bomb technicians are required to undertake a recertification course every three years. The National Bomb Squad Commanders Advisory Board also recommends that bomb technicians undertake 16 h of training each month, although only part of this training time would be devoted to X-ray imaging [28]. Other relevant studies have shown correlations between detection performance and other image-based and human factors, such as screener age. Unfortunately, none of the above studies reported absolute effect sizes due to “security and confidentiality reasons.” While many factors can affect the performance of an individual screener, we will use the word “skill” to refer to them collectively.
Figure 8.
The best-fit subject skill parameters (β3, s) from the logistic regression model, representing the difference in skill compared to the average observed in the study. The length of each error bar indicates one standard deviation computed across 100 bootstrapped iterations.
The following mathematical model was used to account for bomb technician skill. Let PID(σb, k; s, m, l) be the probability that subject s identifies a component of type m under clutter condition l,
(7)
PID(σb,k;s,m,l)=S(β0+β1σb+β2k+β3,s+β4,m+β5,l ),
where S is a sigmoid and the image-quality parameters β1 and β2 control the effect of blur and noise, respectively. The skill parameter β3, s depends on the subject, while β4, m and β5, l are parameters describing the effect of the component and clutter state on detection. This model was fit to the data and a set of β3 skill parameters were obtained. To ensure the skill parameters could be determined with reasonable accuracy, we restricted the fit to the 24 subjects who analyzed at least 15 images. The best-fit skill parameters are plotted in Figure 8, and the mean of their absolute values was 0.62. Their values represent the shift in log-odds due to the skill of the subject. For example, let us assume that we observed a 90% probability of detection for a D sized battery and a given level of image quality. A participant with a skill parameter of 0.5 would have a 94% chance of detecting that component, whereas a bomb technician with a skill parameter of −0.5 would have an 85% chance. So although the effect of subject skill is statistically significant for many participants, the change in detection probability observed in our study was much smaller than that due to component type, image quality, or the presence of clutter or shielding. At the 95% confidence level, one subject had a skill parameter that was significantly better than average, while five subjects had skill parameters that were significantly worse than average. Such a result would be expected if the population of bomb technicians were performing as efficient ideal observers, since it would be easy to perform worse than average, but difficult to perform better. This could be an interesting topic for further research.
4.
Informing the Development of Future Standards
Images of the IEEE/ANSI N42.55 test object were collected under the same conditions as those used for the pristine IED images. The pristine test-object images were then degraded using the same degradations as were applied to the IED images, and the degraded images were analyzed using the methods in N42.55 standard [20] to yield a set of measured N42.55 image-quality metrics for each degradation level. Figure 9 shows the variation of some of the metrics as a function of blur and noise. It can be observed that the dynamic range and the noise level in Fig. 9(a) are linearly related, indicating that the N42.55 dynamic-range metric captures relevant information regarding the level of noise in the image. Similarly, a trend between the spatial resolution and the blur can be seen in Fig. 9(b), although this trend is affected by noise. The points with low noise show a smooth trend (blue data), while the points with high noise show less of a trend (yellow and light green). This should not be a great surprise, since it is difficult to experimentally estimate spatial resolution in the presence of very high levels of noise.
Figure 9.
The IEEE/ANSI N42.55 metrics varied predictably with the level of degradation introduced. (a) The value of the log of the dynamic-range metric is plotted against the log of the level of noise that was introduced. The color of each datapoint in this plot represents the log of the blur level. (b) The value of the N42.55 spatial-resolution metric is plotted against the log of the level of blur that was introduced. The color of each datapoint in this plot represents the log of the noise level.
A logistic regression model was developed to predict bomb technician task performance based on metrics derived from the N42.55 standard. Five metrics were taken directly from this standard: dynamic range, noise equivalent quanta (NEQ) at 1 cycles/mm, organic material detection, spatial resolution (i.e., frequency at which the modulation transfer function, MTF, drops to 20%), and steel penetration. We also considered three non-standard metrics as candidates for inclusion in future revisions of the standard. The candidate metrics were: MTF_feat, a feature calculated by integrating the MTF between 0 cycles/mm and 0.25 cycles/mm; similar features, NEQ_feat and NPS_feat were calculated by integrating the NEQ and noise power spectrum (NPS) over the range between 0 cycles/mm and 1 cycles/mm. The predictive model had the form
(8)
PID=Sβ0+i=18βixi,
where S is the sigmoid function, xi is the ith of the eight features (metrics) described earlier in this paragraph, and βi is the regression parameter associated with the ith feature. More complex models were also tried, but likely due to lack of data, they did not give better results for the validation dataset.
The task-performance data were partitioned into distinct subdatasets, based on factors that strongly affected task difficulty, and a different PID model was developed each of these subdatasets. The primary factor affecting task performance was component type (e.g., a metal pipe explosive was much easier to detect than a switch). Separate models were developed for the following component types: switches, detonators, power sources, pipe explosives, non-pipe explosives. The data were further divided into cases where the components were: obscured by uniform shielding material, obscured by other objects in the image (e.g., a laptop or other clutter), not obscured by any significant shielding or clutter. For each of these categories, a logistic regression model was fit to the human task-performance data (e.g., a model for predicting PID, SW, NO_CL, the probability of identifying a switch not obscured by clutter). Best-fit values for the β parameters were determined by minimizing the cross-entropy between the predicted probability and the observed binary outcome (i.e., either the component was identified or it was not).
Figure 10.
The importance of each metric is shown based on how predictive it was of task performance. Specifically, the size of the bar represents the probability that the metric was included in the logistic regression model by the forward feature selection scheme. MTF_feat, NPS_feat, and NEQ_feat are non-standard features derived from the MTF, NPS, and NEQ. The NEQ 1 metric is the value of the NEQ at 1 cycles/mm.
We implemented an iterative forward feature selection scheme, where the best-performing features were progressively incorporated into the model. The remaining unselected feature that best improved the model performance was incorporated, iteratively, until no improvement was observed. To conduct feature-importance analysis, we randomly divided the dataset into disjoint 80%/20% train-test sets, then performed fivefold cross-validation on the training set to obtain the best feature set from each fold. This process was repeated for more than 1000 iterations to prevent inconsistencies due to data division bias. Figure 10 shows the relative number of times each feature was selected across all component and clutter categories. The results indicate how predictive the metrics were of identification performance over this dataset, and can be used to impute the relative importance of similar metrics. For example, NEQ_feat is more predictive than NEQ_1 so it may be prudent to replace the NEQ_1 metric in the N42.55 standard with something similar to NEQ_feat.
We also aimed to learn something about the degree of image quality necessary to perform component identification tasks. To do this, we considered each metric in isolation of other similar metrics in order to reduce the effect of correlation. For example, the MTF20 metric is sensitive to spatial resolution but fairly insensitive to noise. We therefore fitted a model of the form
(9)
PID=Sβ0+β1MTF20+β2k,
where k is the level of noise introduced and the β parameters are determined by regression. In the limit of low noise, this model can be used to determine the threshold spatial resolution corresponding to a particular identification task. For example, the value MTF20P50, SW, NO_CL denotes the MTF20 value necessary to achieve a 50% probability of identifying a switch in the absence of clutter (in the limit of low noise).
Table II.
Threshold image-quality levels were determined that allowed bomb technicians to successfully identify multiple IED components in X-ray images. The quantity Y ID3 (Y ID4) corresponds to the threshold value of metric Y necessary to expect to find three (four) of the five component classes considered here. An orthogonal “other variable” was included when metric Y was insensitive to either blur or noise.
N42.55 metricOther variableY ID3Y ID4
(lower range, upper range)(lower range, upper range)
NEQ at 1 cycles/mmNone1569.1516533.82
(961.70, 3467.54)(6770.27, 75290.63)
Organic material detectionNone1.282.29
(1.05, 1.66)(1.87, 3.09)
Dynamic rangeσb23.2259.54
(16.07, 33.03)(42.77, 91.50)
MTF20k (the noise parameter)0.531.65
(0.15, 0.84)(1.29, 1.94)
Bomb technicians generally need to be able to identify multiple components in order to understand the design of an IED and devise countermeasures. With this in mind, we developed threshold metric values that reflect the ability to detect multiple components. For example, the value MTF20ID4 denotes the threshold MTF20 value, where one could expect to identify four of the five component classes for which we developed models. In other words, the identification probability was 80% when averaged over all component models. All the shielding and no clutter models were included in the average, but not the clutter model, since we recommend re-shooting from alternate angles when an image is strongly affected by clutter. Table II gives threshold values for some N42.55 metrics of interest. We hope that these threshold image-quality values might be informative for future working groups of the IEEE/ANSI standard when considering appropriate minimum performance requirements for these metrics. If the reader is interested in threshold image-quality values for particular tasks, they should contact the authors.
5.
Summary and Future Directions
We have described the development of the NIST-LIVE X-ray IED Image-Quality Database. The database consists of: a set of pristine X-ray images of IEDs and benign objects; a larger set of varying quality images of the same objects; ground-truth labels and bounding boxes for the IED components in the images; and human task-performance results for locating and identifying the IED components collected from trained U.S. bomb technicians. In this work, we demonstrated some applications of the database, especially informing future development of image-quality standards. These results could directly affect future revisions of the N42.55 standard, both in terms of the choice of metrics, and setting of appropriate values for minimum performance requirements. The results could also inform future cost-benefit analyses by both manufacturers and purchasers, where additional improvements in image quality may lead to only incremental improvements in detection.
In recent decades, there has been great interest in developing metrics and models of the effect of image quality in security imaging. The database described in this work should prove valuable for developing and testing these. Indeed, an early version of the database, which only contained some of the images and no human task-performance data, was used to study the natural scene statistics (NSS) of security X-ray images [13]. More recently, the database was used to develop a set of NSS-based measures of image quality along with a no-reference model for predicting human task performance [12]. It was found that a combination of NSS and N42.55 metrics was significantly more predictive of task performance than either was alone, suggesting that these measures contain complimentary information. That work was also extended to include multivariate NSS methods [10].
We hope to make the database available to other researchers to use in other ways (please contact us if you are interested). For example, the database could be used as a benchmark for automatic detection algorithms for IED components, both because it has images with labeled IED components, and because it includes benchmark human results. In these, and perhaps other unanticipated ways, we hope the database will prove to be a useful resource.
Appendix A.
Spatially Correlated Noise
Here, we briefly describe the algorithm for generating SCN with a power spectral density proportional to fα. A field of spatial frequencies of the same size as that of an image is generated, denoted by (u(x, y), v(x, y)), representing the horizontal and vertical spatial frequencies, respectively. The spatial frequencies are then used to obtain the power spectral density given by
P(x,y)=(u(x,y)2+v(x,y)2)α2.
The phases ϕ of each frequency component of the noise field are randomly sampled from a uniform distribution with support from 0 to 2π. Finally a 2D SCN image is obtained by taking the real part of the inverse frequency transform of noise with power spectral density P(x, y),
SCN (x,y)=Re (F1(P(x,y)12(cos(2πϕ)+jsin(2πϕ)))).
It should be noted that the generated SCN coefficients are normally distributed because of the central limit theorem.
Acknowledgment
This work was supported in part by National Institute of Standards and Technology (NIST) awards to Theiss Research (#70NANB20H011 and #70NANB15H015). This work was also supported in part by a NIST award to the University of Texas at Austin (NIST Award #70NANB15H270).
References
1AmemiyaY.MatsushitaT.NakagawaA.SatowY.MiyaharaJ.ChikawaJ.1988Design and performance of an imaging plate system for x-ray diffraction studyNucl. Instrum. Methods Phys. Res. A266645653645–5310.1016/0168-9002(88)90458-5
2BarberJ.WeatherallJ. C.GrecaJ.SmithB. T.Toward the development of an image quality tool for active millimeter wave imaging systemsPassive and Active Millimeter-Wave Imaging XVIII2015Vol. 9462SPIEBellingham, WA94620D
3BlackwellH. R.1946Contrast thresholds of the human eyeJ. Opt. Soc. Am.36624643624–4310.1364/JOSA.36.000624
4BolfingA.HalbherrT.SchwaningerA.HolzingerA.How image based factors and human factors contribute to threat detection performance in x-ray aviation security screeningHCI and Usability for Education and Work2008SpringerBerlin, Heidelberg419438419–38
5BurgessA. E.WagnerR. F.JenningsR. J.BarlowH. B.1981Efficiency of human visual signal discriminationScience214939493–410.1126/science.7280685
6BurgessA. E.GhandeharianH.1984Visual signal detection. II. Signal-location identificationJ. Opt. Soc. Am. A1906910906–1010.1364/JOSAA.1.000906
7BuserD.SterchiY.SchwaningerA.Effects of time on task, breaks, and target prevalence on screener performance in an x-ray image inspection task2019 Int’l. Carnahan Conf. on Security Technology (ICCST)2019IEEENew York, NY161–6
8DumkeJ.Visual acuity and task-based video quality in public safety applicationsImage Quality and System Performance X2013Vol. 8653International Society for Optics and PhotonicsBellingham, WA865306
9FordC. G.McFarlandM. A.StangeI. W.Subjective video quality assessment methods for recognition tasksHuman Vision and Electronic Imaging XIV2009Vol. 7240International Society for Optics and PhotonicsBellingham, WA72400Z
10GuptaP.BampisC. G.GloverJ. L.PaulterN. G.BovikA. C.2018Multivariate statistical approach to image quality tasksJournal of Imaging411710.3390/jimaging4100117
11GloverJ. L.HudsonL. T.ToshR. E.PaulterN. G.“Testing the Image Quality of Cabinet X-ray Systems for Security Screening: The Revised ASTM F792 Standard,” J. Testing Eval. 46, 1468–1477 (2018)
12GuptaP.SinnoZ.GloverJ. L.PaulterN. G.BovikA. C.2019Predicting detection performance on security x-ray images as a function of image qualityIEEE Trans. Image Process.28332833423328–4210.1109/TIP.2019.2896488
13GuptaP.GloverJ. L.PaulterN. G.BovikA. C.“Studying the statistics of natural x-ray pictures,” J. Testing Eval. 46, 1478–1488 (2018)
14HallowellS. F.JankowskiP. Z.Transportation security technologies research and developmentMILCOM 2005–2005 IEEE Military Communications Conf.2005IEEEPiscataway, NJ175317561753–6
15HalbherrT.SchwaningerA.BudgellG. RWalesA.2013Airport security screener competency: a cross-sectional and longitudinal analysisInt. J. Aviat. Psychol.23113129113–2910.1080/10508414.2011.582455
16HättenschwilerN.MendesM.SchwaningerA.2019Detecting bombs in x-ray images of hold baggage: 2D versus 3D imagingHuman Factors61305321305–2110.1177/0018720818799215
17HeintzmannR.RelichP. K.NieuwenhuizenR. P. J.LidkeK. A.RiegerB.“Calibrating photon counts from a single image,” Preprint arXiv:1611.05654, (2016)
18HudsonL.BatemanF.BergstromP.CerraF.GloverJ.MinnitiR.SeltzerS.ToshR.2012Measurements and standards for bulk-explosives detectionAppl. Radiat. Isot.70103710411037–4110.1016/j.apradiso.2011.11.029
19HudsonL.“The case for technical performance standards for radiation inspection systems,” J. Testing Eval. 46, 8–16 (2017)
20IEEE/ANSI N42.55-2013: American National Standard for the Performance of Portable Transmission X-Ray Systems for use in Improvised Explosive Device and Hazardous Device Identification (IEEE, New York, NY, 2013)
21JohnsonJ.Analysis of image forming systemsImage Intensifier Symposium1958US Army Engineer Research and Development LaboratoriesFort Belvoir, VA249274249–74
22KollerS. M.HardmeierD.MichelS.SchwaningerA.2008Investigating training, transfer and viewpoint effects resulting from recurrent CBT of X-Ray image interpretationJ. Transpt. Secur.18110681–10610.1007/s12198-007-0006-4
23LeszczukM. I.StangeI.FordC.Determining image quality requirements for recognition tasks in generalized public safety video applications: Definitions, testing, standardization, and current trends2011 IEEE Int’l. Symposium on Broadband Multimedia Systems and Broadcasting (BMSB)2011IEEEPiscataway, NJ151–5
24LeszczukM.DumkeJ.Quality assessment for recognition tasks (QART)4th Int’l. Conf. on Emerging Network Intelligence2012International Academy, Research, and Industry AssociationWilmington, DE
25LeechD. P.“A Measure of Domestic Security: Economic Benefits of NIST’s Support of Public Safety and Security,” Technical Report, National Institute of Standards and Technology, Gaithersburg, MD (2015)
26LooL-NDDoiK.MetzC. E.1984A comparison of physical image quality indices and observer performance in the radiographic detection of nylon beadsPhys. Med. Biol.837
27MichelS.KollerS. M.RuhM.SchwaningerA.Do “image enhancement” functions really enhance x-ray image interpretation?Proc. Annual Meeting of the Cognitive Science Society2006Cognitive Science SocietyAustin, TX130113061301–6
28National Strategic Plan for U.S. Bomb Squads. “National Bomb Squad Commanders Advisory Board, 600 Boulevard South,” Technical Report Suite 104, Huntsville, AL (2016)
29Portable X-Ray Systems for Use in Bomb Identification: NIJ Standard-0603.01. National Institute of Justice, Washington, DC, 2007
30RiegelnigJ.SchwaningerA.The influence of age and gender on detection performance and the response bias in x-ray screeningSecond Int’l. Conf. on Research in Air Transportation2006Belgrade, Serbia and Montenegro403438403–38
31RoseA.1948The sensitivity performance of the human eye on an absolute scaleJ. Opt. Soc. Am.38196208196–20810.1364/JOSA.38.000196
32RosellF. A.WillsonR. H.Recent psychophysical experiments and the display signal-to-noise ratio conceptPerception of Displayed Information1973SpringerBerlin167232167–232
33SchwaningerA.HardmeierD.HoferF.Measuring visual abilities and visual knowledge of aviation security screeners38th Annual 2004 Int’l. Carnahan Conf. on Security Technology2004IEEENew York, NY258264258–64
34SeguiJ. A.ZhaoW.2006Amorphous selenium flat panel detectors for digital mammography: Validation of a NPWE model observer with CDMAM observer performance experimentsMed. Phys.33371137223711–2210.1118/1.2349689
35TeaneyB.ReynoldsJ.HolstG. C.KrapelsK. A.Next generation imager performance modelInfrared Imaging Systems: Design, Analysis, Modeling, and Testing XXI2010Vol. 7662International Society for Optics and PhotonicsBellingham, WA132139132–9
36TeaneyB. P.TomkinsonD. M.HixsonJ. G.HolstG. C.KrapelsK. A.Legacy modeling and range prediction comparison: NV-IPM versus SSCamIP and NVThermInfrared Imaging Systems: Design, Analysis, Modeling, and Testing XXVI2015Vol. 9452International Society for Optics and PhotonicsBellingham, WA231242231–42
37TeaneyB. P.HaefnerD. P.HolstG. C.KrapelsK. A.Measured system component development for the night vision integrated performance model (NV-IPM)Infrared Imaging Systems: Design, Analysis, Modeling, and Testing XXVII2016Vol. 9820International Society for Optics and PhotonicsBellingham, WA324232–42
38United States Bomb Data Center (USBDC) Explosives Incident Report (EIR) 2016. United States Bomb Data Center, Redstone Arsenal, AL 35898, USA, 2018
39VaitekunasD. A.HolstG. C.RamaswamyS.HolstG. C.KrapelsK. A.Probability of detection using ShipIR/NV-IPMInfrared Imaging Systems: Design, Analysis, Modeling, and Testing XXVI2015Vol. 9452International Society for Optics and PhotonicsBellingham, WA158169158–69
40VollmerhausenR. H.JacobsE.“The targeting task performance (TTP) metric a new model for predicting target acquisition performance,” Technical Report, Center for Night Vision and Electro-Optics Fort Belvoir VA, (2004)
41WagnerR. F.BrownD. G.1985Unified SNR analysis of medical imaging systemsPhys. Med. Biol.30489518489–51810.1088/0031-9155/30/6/001