Back to articles
Regular Articles
Volume: 3 | Article ID: jpi0132
Image
The Difference in Impression between Genuine and Artificial Leather: Quantifying the Feeling of Authenticity
  DOI :  10.2352/J.Percept.Imaging.2020.3.2.020501  Published OnlineMarch 2020
Abstract
Abstract

Products can be promoted by improving their value using shitsukan, that is, feelings or impressions of the perception of their material appearance. Particularly, products made of leather are generally attractive to consumers. Although the number of products made from artificial leather has been increasing in recent years, the impression of their appearance is different from that of products made of genuine leather. This study investigates the impression elicited by leather and proposes a model to assess people’s feeling of its authenticity. We developed a measurement system and conducted subjective evaluation experiments on two groups of participants divided according to whether they were familiar with leather. The proposed evaluation model is based on a visual perception mechanism. We first investigated the correlation between characteristics of image samples and impression factors estimated by using factor analysis. Then, we confirmed the correlation among the impression factors and values of the feeling of authenticity. The R-squared value between subjective values of the feeling of authenticity and our proposed assessment values was approximately 0.8.

Subject Areas :
Views 62
Downloads 18
 articleview.views 62
 articleview.downloads 18
  Cite this article 

Shuhei Watanabe, Shoji Tominaga, Takahiko Horiuchi, "The Difference in Impression between Genuine and Artificial Leather: Quantifying the Feeling of Authenticityin Journal of Perceptual Imaging,  2020,  pp 020501-1 - 020501-11,  https://doi.org/10.2352/J.Percept.Imaging.2020.3.2.020501

 Copy citation
  Copyright statement 
Copyright © Society for Imaging Science and Technology 2020
  Article timeline 
  • received December 2019
  • accepted May 2020
  • PublishedMarch 2020

Preprint submitted to:
jpi
Journal of Perceptual Imaging
J. Percept. Imaging
J. Percept. Imaging
2575-8144
Society for Imaging Science and Technology
1.
Introduction
We encounter a variety of objects in daily life, and many of them vary in their shitsukan, that is, in our feelings or impressions evoked by their material appearance. In recent years, many studies have focused on the visual perception of materials [4, 5]. When consumers purchase a product, they choose it based not only on price and performance but also on whether they are attracted by its appearance. Therefore, the appearance of products has become a more important aspect of product design, especially differentiated from competing products due to mature product performance. It is thus important to be able to quantify and control a product’s shitsukan. However, material appearance depends on many factors such as physical properties, lighting, object (shape), and previous experience (i.e., familiarity [16]).
Consequently, previous studies have focused on various material appearances [11, 15, 19, 20]. This study focuses on the appearance of leather as it is used for various products such as car interiors, clothes, and bags. The appearance of genuine leather provides consumers with an impression of luxury and a feeling of trust in the quality of the product. Although product designers want to use genuine leather for various products because of its superior quality, they often use artificial leather for these products owing to high prices and concerns for animal rights. Artificial leather is made from either polyurethane or vinyl chloride. Therefore, it has the advantage of easy maintenance. Moreover, the surface of artificial leather is manufactured to resemble genuine leather. However, the appearance of products made from artificial leather may leave different impressions on consumers compared with products made of genuine leather.
If we can identify the perceptual properties of genuine leather, this would help in producing more convincing artificial leather. However, as mentioned above, we assume that the observer’s impression of leather is different depending on prior familiarity with it. Therefore, the aim of this study is to investigate the impressions of leather of two groups of participants—groups 1 and 2, where participants of group 1 were familiar with leather and those of group 2 were not—to evaluate the subjective “feeling of authenticity.” To achieve this purpose, we constructed a hierarchy of subjective response layers and examined the relationships between layers.
The remainder of this article is structured as follows. We describe a visual perception mechanism from the perspective of brain science and the hierarchy of subjective responses constructed from this mechanism. We then describe the measurement system and measurement methods that were applied. We detail the methods used in the subjective experiment involving leather samples and discuss the results of a statistical analysis of the results. Next, we detail the examination of the correlation between subjective evaluation scores and measurement values. Finally, we provide a discussion of the results and present the conclusions of this study.
2.
Visual Perception Mechanism
The perception of the visual appearance of an object involves various factors, including surface color, gloss, and texture. A previous study strongly correlated brain activity in the initial visual cortex, such as V1 and V2, with image features, whereas activity in the higher-order areas of the ventral pathway was strongly correlated with perceptual impressions [8]. These results indicate that the impression of a material is formed in the course of processing within the ventral path. In the results of a recent study involving experiments using monkeys, the activity of the ventral visual pathway indicates that a conversion from image features into a perceptual impression occurs [6].
Based on these studies, it was suggested that the information we obtain from our eyes is perceived as shitsukan after being hierarchically processed. Therefore, as shown in Figure 1, we constructed the hierarchy of subjective responses and confirmed the correlation between measured values and subjective evaluation scores. Also, in a study on tactile sensation, Hashim et al. have proposed the layered subjective responses based on the biological structure of human perception [7]. Other studies have also reported approaches using a hierarchical structure of subjective responses [2, 13]. Since we perceive tactile sensation as well as visual appearance through hierarchical processing, we considered a hierarchical approach as suitable for evaluating human sensibilities.
Image characteristics were obtained through measurement experiments. Data on the impression factor and feelings of authenticity were obtained from a subjective evaluation experiment, where the impression factor is an estimate of representative impressions of leather.
3.
Measurement Experiments
To obtain an evaluation model for the feeling of authenticity, it was necessary to obtain image characteristics of leather. Because the appearance of leather changes with the observation angle, we constructed a goniophotometer system. Moreover, we used a commercial measurement device. Three measurement experiments were conducted to obtain the image characteristics. We defined each image characteristic value as the average values of all three measurements. Ten samples consisting of artificial (6) and genuine (4) leather were prepared for the experiments. The leather used was cowhide. Figure 2 shows the leather samples used in the subjective evaluation. The samples were black in color, and they had dimensions of 210 mm × 300 mm. These RGB images were captured under the D65 diffuse illumination condition.
Figure 1.
Relationship between measurement values and subjective responses.
Figure 2.
Sample surface.
3.1
Color Measurement
Figure 3 shows a schematic illustration of the color measurement system. The system comprises a spectral camera and a lighting device. The spectral camera recorded spectral images in 31 bands with a 10-bit depth. The size of the captured image was 600 pixels × 600 pixels. The image resolution was approximately 1,000 dpi (25 μm∕pixel). Because the camera recorded spectral images, the images could be converted into the Lab format. The spectral images were normalized by using spectral images of a standard white target. The lighting device had a xenon light source. The measurement angle was 45, and the illumination angles were 15, 0, 20, 30, and 45 toward the normal direction (geometry of 1545, 045, 2045, 3045, and 4545). We set these angles with reference to commonly used color measurement angles [1, 12]. In addition to Lab, kurtosis and skewness were calculated for each geometry as image characteristics.
3.2
Measurement of Surface Characteristics
Figure 4 shows a schematic illustration of the surface characteristic measurement system. The system comprises a digital single-lens reflex camera (PENTAX K3-II, RICOH IMAGING COMPANY, LTD., Tokyo, Japan) and a lighting device. The raw images had a depth of 14 bits, and they were converted into L images. The raw images were then normalized by using images of a standard white target. The size of the captured image was trimmed to 3,000 pixels × 3,000 pixels. The image resolution was approximately 1000 dpi (25 μm∕pixel). The measurement angle was 0 and the illumination angles were 15, 25, 45, and 60 toward the normal direction (geometry of 150, 250, 450, and 600). We set these angles with reference to commonly used surface measurement angles [1].
To obtain the surface characteristics, characteristics of the spatial frequency of the deviation L image were first calculated from the Fourier transform. For conversion into the one-dimensional (1D) characteristics of spatial frequency, the cyclic average values for each spatial frequency (cycles/mm) were then calculated [9]. Figure 5 shows this step. In the graph, the vertical axis is the amplitude and the horizontal axis is units of cycles per millimeter. The characteristics were then weighted based on the characteristics of the human visual system, namely, the contrast sensitivity function (CSF). The CSF is the frequency response characteristic of human vision that represents changes in the resolution of human vision with observation distance. In this study, the observation distance was 300 mm. Although different CSF models were proposed in the previous studies, we used the basic model proposed by Dooley and Shaw [3]. The surface of leather has various frequency bands because of the surface irregularity and grain size. Thus, we calculated several surface characteristics. Integrals of 1D spatial frequency values within the ranges 0–0.1, 0.1–1.0, and 1.0–4.0 cycles per millimeter were defined as surface characteristics. These values corresponded to surface irregularity and large/small grains, respectively. These spatial frequency ranges were determined based on their actual measured size and image resolution (25 μm∕pixel).
Figure 3.
Color measurement system.
Figure 4.
Surface characteristic measurement system.
3.3
Measurement of L Gradient
The reflection characteristics of leather change depending on the observation angle. Moreover, the gradient of change varies according to the surface condition of the leather. To measure the gradient of the characteristics, we measured them using a gonio-spectrophotometer (GCMS-11, Murakami Color Research Laboratory, Tokyo, Japan). This measurement device can measure the bidirectional reflectance distribution function. Figure 6 shows the measurement conditions in this experiment. The measurement angle was 45, and the illumination angles were in the range of 0–55 toward the normal direction, measured every 1 (geometry of 045 to 5545). We also set these angles with reference to commonly used color measurement angles. However, since the shade angle (diffuse reflection condition away from specular reflection) has almost no change in L value, we did not measure the 1545 condition. In this study, the L value of the surface of the leather in each geometry was measured. We then calculated the gradient value. Figure 7 shows the calculation method. We determined the gradient value as a slope from the peak value of L to half the value of L from the peak because the difference in gradient well appeared. In Fig. 7, gradient A is slight and gradient B is steep. In other words, the value of gradient A is smaller than that of gradient B. Table I lists the characteristics obtained in the three measurement experiments.
Figure 5.
Calculation of characteristics of spatial frequency of the L image.
Figure 6.
Conditions for the measurement of the gradient of the reflection characteristics.
Figure 7.
Example of method to calculate the value of the L gradient.
Table I.
List of measurement characteristics.
4.
Subjective Evaluation Experiments
4.1
Impression Factor
4.1.1
Experimental Conditions
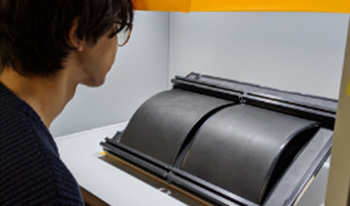
Values of the impression factor, that is, the representative impressions we perceive from leather, were obtained from factor analysis using the result of subjective evaluation experiments. The analysis estimated the representative impressions we perceived from the appearance of leather. Figure 8 shows the observation conditions of subjective evaluation experiments. Because the appearance of the leather varies with the observation angle, the participants observed the samples in a curved state. The experiments were conducted using a standard light source (SpectraLight QC; X-Rite, MA, USA). The observation distance was 300 mm. Participants observed a curved leather sample while fixing the observation position by steading their forehead.
Figure 8.
Observation conditions.
4.1.2
Methods and Analyses
To determine the proper evaluation words for use in the analysis, we conducted three experiments: an impression word extraction test, an impression word appropriateness test, and a rating word distance measurement test [17]. From the impression word appropriateness test, we divided participants into two groups.
The impression word extraction test was conducted to extract general impressions of the leather samples. Ten participants observed the leather samples and wrote down as many words they could think of to describe their impressions. As a result, we obtained 232 words and extracted 92 words with duplicate words removed. We assumed that extracted impression words were pretty general for leather because the duplication rate of the words by the 10th participant was 84%.
For selecting the words to be used in the following experiments from the 92 words, we conducted the impression word appropriateness test. In this test, 20 participants (eight familiar and 12 unfamiliar with leather) evaluated the appropriateness of the 92 words using a scale from 1 (very inappropriate) to 7 (very appropriate). The participants who responded that they have leather products (i.e., had many opportunities to observe leather products) and that they were interested in leather belonged to the familiar group. We then calculated the average and standard deviation of each word score. The participants judged the word appropriateness with respect to all samples at once (92 ratings) while observing the samples. We considered that words with high scores and small variability among the participants were more appropriate for evaluation. Therefore, first, the words with an average score of more than 5 (appropriate) were chosen. Furthermore, words that had the standard deviation scores of lower than the average standard deviation score + 1σ of the above chosen appropriate words group were extracted. As a result, we extracted 24 words appropriate for the impressions of leather in the familiar group. On the other hand, we extracted 28 words in the unfamiliar group.
Table II.
Representative words. (a) The participants familiar with leather products. (b) The group of participants unfamiliar with them.
(a)(b)
Word nameWord name
Profound feelingSturdyJet blackFine
GranularStretchyUnevenShiny
MatteSmoothWrinklySturdy
TextureWrinklyLuxurious feelingResilient
Artificial
To scale the distance between meanings of the impression words, we conducted a rating word distance measurement test, where a word pair with a “short distance” indicated similarity and that with a “long distance” indicated dissimilarity. The two groups judged whether each word pair distance was short or long. In this test, we did not present the samples because they judged only the similarity of the words. Also, the test was conducted using an Excel sheet which was randomly listed 24C2 and 28C2 word pairs. The distance then corresponded to the similarity of impressions between pairs of the 24 and 28 words. Therefore, the rate at which the participants answered “long distance” for each word pair was defined as the normalized distance between words. In other words, if all participants answered “long distance,” the normalized distance was “1.” If they answered “short distance,” the normalized distance was “0.” We then plotted the words using multidimensional scaling for the normalized distance between members of each sample pair. The words were plotted in 23- and 27-dimensional spaces. Finally, hierarchical cluster analysis was applied using Ward’s method to the dimensionally plotted words of groups 23 and 27. In general, we can cluster words that are close. There are various ways to reduce the total number of clusters. In this study, we defined some clusters that were closer than the average distance of all clusters as a new cluster. The 24 and 28 impression words were divided into eight and nine clusters based on the average distance between each cluster. In each new cluster, we defined the word with the highest average score at the word appropriateness experiment as the representative word (Table II). These words were evaluated on the Likert scale.
4.1.3
Results
Finally, the participants evaluated the impression of each sample using the representative words on a seven-point scale from − 3 (not felt at all) to 3 (very strongly felt). The samples were shown in random order to each participant. To extract the principal impression factors, the average scores were calculated and factor analysis was conducted [21]. A quartimin rotation was used to rotate the factors. Table III shows the final results of the factor analysis. In the group of participants who had had previous experience of leather products, “Matte” was eliminated because of double loading, a phenomenon with large loading values for multiple factors. In subsequent analyses, “Stretchy” was eliminated because no factors had a large loading value. The cumulative contribution ratio up to the second factor was approximately 0.89. The first factor consisted of the words “Wrinkly,” “Granular,” “Sturdy,” and “Smooth.” The second factor consisted of “Texture” meaning feel of a surface and “Profound feeling.” We determined that the first factor was a “surface shape” because it corresponded to the surface roughness and grain.
Table III.
Result of factor analysis. (a) Results for the group of participants who had had previous experience of leather products (hereinafter, “the familiar group”). (b) Results for the group unfamiliar with them (hereinafter, “the unfamiliar group”).
The second factor was determined to be the “impression of stateliness” meaning formal and elegant quality because it corresponded to a profound impression. To the contrary, in the group of participants who had had no prior experience with leather, “Artificial” was eliminated because of its similarity in meaning to the feeling of authenticity. Moreover, “Fine” was eliminated due to double loading. The cumulative contribution ratio up to the second factor was approximately 0.88. The first factor contained “Jet black,” “Uneven,” “Wrinkly,” “Luxurious feel,” and “Shiny.” The second factor contained “Sturdy” and “Resilient.” We determined the first factor was a “Jet black” because the factor was related to surface uniformity, black color, and gloss. The second factor was determined as “sturdiness” because it corresponded to an impression of toughness.
4.2
Feeling of Authenticity
4.2.1
Method
To obtain scores for the feeling of authenticity of the leather samples as provided by the participants, Scheffe’s paired comparison method was applied [14]. In each trial, a pair of test samples were chosen at random. The participants compared and evaluated them according to the seven ranks from “-3 (not authentic at all)” to “3 (very strongly authentic).” The above comparison was conducted for 10C2 pairs. Scheffe’s paired comparison method can identify small differences between samples.
4.2.2
Results
The subjective scores were scaled through a correspondence analysis [10]. In this study, we obtained 6 (7 ranks − 1)-dimensional results in the analysis. Figure 9 shows the results between dimension 1 and dimension 2. In familiar groups, we visually confirmed that subjective sample scores and rank scores are plotted in a horseshoe shape. This shape plot suggests that the subjective sample score is a 1D structure [18]. In fact, dimension 1 was dominant and the R-squared value was 0.69. Furthermore, the figures show that dimension 1 corresponds to the rating ranks used in the experiments (see green and orange plot). That is, dimensions 2–6 corresponded to other factors, such as evaluation variation among participants. From the above, we defined dimension 1’s sample scores as subjective the feeling of authenticity scores. On the other hand, in the unfamiliar group, subjective sample scores plotted on the horseshoe shape. Also, the R-squared values of dimensions 1 and 2 were 0.55 and 0.26, respectively, and dimension 1 was not dominant. In other words, we could not infer the 1D structure of the sample scores. Therefore, we examined the quantification of the feeling of authenticity using only the results of the familiar group. Table IV shows the 1D subjective scores of the familiar group. The magnitude of the score represents the strength of the feeling.
Figure 9.
Results of correspondence analysis. (a) Results for the familiar group. (b) Results for the unfamiliar group.
Table IV.
Subjective scores of the feeling of authenticity for the familiar group.
Sample No.Subjective score
7 (genuine)0.70
8 (genuine)0.61
9 (genuine)0.25
4 (artificial)0.21
6 (artificial) − 0.02
1 (artificial) − 0.02
3 (artificial) − 0.12
2 (artificial) − 0.52
5 (artificial) − 0.54
10 (genuine) − 0.55
5.
Estimation Results
The feeling of authenticity was structurally evaluated. We confirmed two types of correlations: those between the image characteristics and the impression factor, and between the impression factor and the feeling of authenticity. The feeling of authenticity could thus be evaluated from image characteristics.
5.1
Image Characteristics and Impression Factor
5.1.1
Familiar Group
We derived equations to estimate the impression factors using multiple regression analyses with a forward stepwise method. In the method, we selected explanatory variables with minimizing the Akaike Information Criteria corrected (AICc) value. A smaller AICc value indicates a better estimation model in terms of robustness and the correlation with the data. In some cases, explanatory variables are highly correlated (for example, L values under 2045 conditions and 3045 conditions). However, in this study, we defined variables with smaller AICc value as the variable particularly relevant to our perception of leather. In the analyses, scores of the impression factors were used as objective variables and image characteristics as explanatory variables. The values of the image characteristics had dissimilar ranges. Therefore, we used their standardized Z-scores as explanatory variables.
The “surface shape” was estimated as in Eq. (1).
(1)
I1=0.76x110.31x12,
where I1 is the “surface shape.” x11 and x12 are “the spatial frequency values at 600 within the range 0.1–1.0 cycles per millimeter,” and “the L value at 4545 ” (p < 0.05), respectively. Figure 10 shows the correlation among values estimated in Eq. (1) and the subjective factor scores for the “surface shape.” In this figure, the horizontal axis represents the estimated scores and the vertical axis the subjective scores for the impression. There was a strong positive correlation, and an R-squared value of 0.91 was obtained (p<0.001). In addition, we found that “the spatial frequency values at 600 within the range 0.1–1.0 cycles per millimeter” and “the L value at 4545 ” were highly correlated with “the spatial frequency values at 450 within the same range” (R2 = 0.91) and “the spatial frequency values at 150 within the range 0–0.1 cycles per millimeter” (R2 = 0.67), respectively. From these results, it was inferred that “surface shape” was perceived mainly by large grains in the shade angle region. In addition, since large grains could not be observed when the L value was large, the L value had a negative effect on the impression.
Figure 10.
Estimated values and subjective scores for the surface shape.
The “impression of stateliness” was estimated using Eq. (2).
(2)
I2=0.71x21+0.24x220.44x23,
where I2 is the “impression of stateliness.” x21, x22, and x23 are “the spatial frequency values at 600 within the range 0–0.1 cycles per millimeter,” “the spatial frequency values at 150 within the same range,” and “the kurtosis value at 1545 ” (p < 0.05), respectively. Figure 11 shows the correlation among the values estimated in Eq. (2) and scores of the subjective factor for the “impression of stateliness.” In this figure, the horizontal axis represents the estimated scores and the vertical axis is subjective scores for the impression. There was a strong positive correlation, and an R-squared value of 0.96 was obtained (p < 0.001). In addition, we found that “the spatial frequency values at 150 within the range 0–0.1 cycles per millimeter” and “the kurtosis value at 1545 ” were highly correlated with “the spatial frequency values at 250 within the same range” (R2 = 0.77) and “the kurtosis value at 045 ” (R2 = 0.84), respectively. We did not find a characteristic with high correlation with “the spatial frequency values at 600 within the range 0–0.1 cycles per millimeter.” From these results, it was inferred that “impression of stateliness” was mainly perceived by the surface irregularity under multiple observation angle conditions. Also, the large kurtosis value at the shade angle indicated that the surface L value was uniform, that is, there was no irregularity on the surface. Therefore, the kurtosis value had a negative effect on the impression.
Figure 11.
Estimated value and subjective score for the impression of stateliness.
5.1.2
Unfamiliar group
The “jet black” was estimated as in Eq. (3).
(3)
I3=0.45y110.95y12,
where I3 represents the “jet black.” y11 and y12 are “the gradients of L” and “the 450 spatial frequency values within the range 1.0–4.0 cycles per millimeter” (p < 0.05). Figure 12 shows the correlation among the values estimated in Eq. (3) and scores of the subjective factor for the “jet black.” In this figure, the horizontal axis represents the estimated scores and the vertical axis subjective scores for the impression. There was a strong positive correlation and an R-squared value of 0.90 was obtained (p<0.001), although the estimated values were dichotomized.
Figure 12.
Estimated values and subjective scores for the jet black.
In addition, we found that “the gradients of L” and “the 450 spatial frequency values within the range 1.0–4.0 cycles per millimeter” were correlated with “the L value at 4545 ” (R2 = 0.49) and “the 600 spatial frequency values within the same range” (R2 = 0.89), respectively. From these results, it was inferred that“jet black” was mainly perceived when there were no small grains in the shade angle region. Also, the sample which had large gradients indicated that the surface was glossy, not matte, and the suggestion was supported by the correlation with the specular L value. We assumed that the sample with a high L gradient and a flat surface looked like a lacquer.
The “sturdiness” was estimated as in Eq. (4).
(4)
I4=0.77y21+0.46y22+0.72y23,
where I4 is “sturdiness.” y21, y22, and y23 are “the gradient of L,” “the ratio of 150 spatial frequency values within the range 0–0.1 cycles per millimeter,” and “the ratio of 150 spatial frequency values within the range 0.1–1.0 cycles per millimeter” (p < 0.05), respectively. Figure 13 shows the correlation among the values estimated in Eq. (4) and subjective factor scores for the “sturdiness.” In this figure, the horizontal axis represents the estimated scores and the vertical axis subjective scores for the impression. There was a strong positive correlation and an R-squared value of 0.91 was obtained (p < 0.01). In addition, we found that “the ratio of 150 spatial frequency values within the range 0.1–1.0 cycles per millimeter” was highly correlated with “the ratio of 250 spatial frequency values within the range 0.1–1.0 cycles per millimeter” (R2 = 0.86). The characteristics that have high correlation with the remaining two characteristics are as described above. From these results, it was inferred that “sturdiness” was mainly perceived by the macro-surface properties in the highlight region. The drastic change of the L value with the observation angle seems to be also related to the impression.
Figure 13.
Estimated values and subjective scores for sturdiness.
5.2
Impression Factors and Feeling of Authenticity
We evaluated the feeling of authenticity using impression factors estimated from the image characteristics. We first investigated the relationship between the feeling of authenticity and the impression factors (Figure 14). In Fig. 14, the blue, orange, and black bars represent impression factors 1, 2, and the feeling of authenticity, respectively. In this figure, the relation between the feeling of authenticity and impression factor 1 can be confirmed, whereby the feeling of authenticity of the given sample was evoked in the participants when the factor had large positive and negative values, that is, absolute values were larger (R2 = 0.50). It was assumed that the participants experience a smooth or rough impression of the surface of genuine leather. The relation between the feeling of authenticity and impression factor 2 was confirmed as well because the larger the positive value of impression factor 2 was, the stronger was the feeling of authenticity evoked in the subject concerning the given sample (R2 = 0.46). We devised an evaluation model from the factors. Furthermore, standardized Z-scores of the factors were used as explanatory variables. The feeling of authenticity was estimated using Eq. (5).
(5)
I5=0.59|x31|+0.56x32,
where I5 is the feeling of authenticity. x31 and x32 are impression factor 1 and impression factor 2 (p < 0.05). Impression factor 1 was converted into its absolute value from the results shown in Fig. 14. Figure 15 shows the correlation among the values estimated in Eq. (5) and subjective scores for the feeling of authenticity. In this figure, the horizontal axis represents the estimated scores and the vertical axis subjective scores for the feeling of authenticity. There was a strong positive correlation, and an R-squared value of 0.80 was obtained (p < 0.01). The results show that the feeling of authenticity was positively influenced by the absolute value of impression factors 1 and 2. Although sample No. 10 was genuine leather, its subjective score was the lowest of the prepared leather samples because its impression factor 2 was small. Whereas, although No. 4 was artificial leather, the subjective score of the feeling was large. Therefore, we speculated that artificial leather also could make people perceive the feeling depending on the impression of the surface.
Figure 14.
Relationship between the feeling of authenticity and impression factors.
Figure 15.
Estimated values and subjective scores for the feeling of authenticity.
5.3
Verification Experiment
Although the estimated model of the feeling of authenticity obtained a good correlation with the subjective score, the model based on ten samples and eight participants might not generalize. Therefore, we included a separate verification experiment with additional samples and participants to confirm the robustness of the model. We considered that it could be regarded as a general conclusion about leather if the robustness of the model for unknown samples could be confirmed. Figure 16 shows the additional 12 leather samples consisting of artificial (6) and genuine (6) leather. The samples were black in color, had dimensions of 210 mm × 300 mm. These RGB images were captured under D65 diffuse illumination condition. The subjective scores of the feeling of authenticity of the samples were obtained from comparisons with the ten leather samples used before in the experiments. We collected subjective scores from 15 participants (added new participants). The measurement experiments were then conducted to obtain image characteristics. The estimated values were calculated using Eqs. (1), (2), and (5).
Figure 16.
Additional samples surface.
Figure 17 shows the correlation with values of the feeling of authenticity estimated in Eq. (5) and the subjective factor scores for the feeling of authenticity of the leather samples. In this figure, the horizontal axis represents the estimated scores and the vertical axis subjective scores for the feeling of authenticity. The black plots are the 10 samples used in the estimated model and the red plots are the leather samples used for verification. Also, the black lines are the 95% prediction interval. As a result, the estimated values of the additional samples were within a 95% prediction interval (the accuracy of the additional sample by the new seven participants was R2 = 0.47). Therefore, the proposed model can estimate the feeling of authenticity. We also confirmed the robustness of the estimation model.
Figure 17.
Verification results.
6.
Conclusions
Using the idea of shitsukan, this article examined the difference between people’s impressions of genuine leather and artificial leather.
Based on this, we hypothesized that artificial leather can induce the feeling of authenticity in the participant similar to that provided by genuine leather if the impressions made by each can be identified and quantified. Therefore, we investigated these impressions and the feeling of authenticity evoked in the participants. We then quantified the feeling by using the structured hierarchy of subjective responses. We conducted experiments involving the subjective evaluation of impressions of leather and its feeling of authenticity, and measured the participants’ impressions of the leather samples.
The results confirmed that participants who had been familiar with leather perceived “surface shape” and “impression of stateliness” in leather.
These findings suggested that the feeling of authenticity of leather is not affected by its surface color, indicating that the evaluation model did not depend on this factor. To confirm this hypothesis, additional experiments are needed. The feeling of authenticity was estimated from the representative impressions. The results revealed that the proposed model can evaluate the feeling of authenticity with an R-squared value of 0.80. We verified the accuracy of the proposed model through a verification experiment with additional samples and participants to confirm the robustness of the model. The results indicated that the estimated values of the additional samples were within a 95% prediction interval. Therefore, we considered that the proposed model is suitable for estimating the feeling of authenticity of the leather. On the other hand, although participants unfamiliar with leather perceived its “jet black” and “sturdiness” representatively, we could not derive the estimate equation of the feeling of its authenticity based on the results of correspondence analysis. The result suggested that impressions of the leather samples differed according to whether the groups had already been familiar with leather, supporting the hypothesis presented.
The feeling of authenticity was particularly affected by both the impression factors almost equally in the familiar group. This result suggested that changing surface irregularities and large grain in artificial leather products are important for inducing the impression of genuine leather. However, we could not derive the feeling of authenticity estimation equation in the unfamiliar group. We speculated that this was because of the evaluation variability in the feeling due to the lack of experience of observing leather rather than the fact that they were not able to perceive the feeling of authenticity. We estimated that as the experience of observing leather increased, their evaluation of the feeling would be close to that of the familiar group.
In future work, we will test other types of shitsukan using this method of structural evaluation. Moreover, we plan to model the feeling of authenticity for cross-modal phenomena using other senses, such as the tactile sense.
References
1BYK Additives & Instruments, GmbH. website, http://www.byk.com/en/instruments/products/Color_Measurement_J/BYK-mac_i_J.html, accessed May 2020
2ChenX.BarnesC. J.ChildsT. H. C.HensonB.ShaoF.2009Materials ‘tactile testing and characterization for consumer products’ affective packaging designMaterials Design.30429943104299–31010.1016/j.matdes.2009.04.021
3DooleyR. P.ShawR.1979Noise perception in electrophotographyJ. Appl. Photographic Engineering5190196190–6
4FlemingR. W.NishidaS.GegenfurtnerK. R.2015Perception of material properties (part I)Vision Res.109(B)123236123–23610.1016/j.visres.2015.01.014
5FlemingR. W.NishidaS.GegenfurtnerK. R.2015Perception of material properties (part II)Vision Res.115(B)157302157–30210.1016/j.visres.2015.08.006
6GodaN.TachibanaA.OkazawaG.KomatsuH.2014Representation of the material properties of objects in the visual cortex of nonhuman primatesJ. Neurosci.34266026732660–7310.1523/JNEUROSCI.2593-13.2014
7HashimI. H. M.KumamotoS.TakemuraK.MaenoT.OkudaS.MoriY.2017Tactile evaluation feedback system for multi-layered structure inspired by human tactile perception mechanismMDPI Sensors.17260110.3390/s17112601
8HiramatsuC.GodaN.KomatsuH.2011Transformation from image-based to perceptual representation of materials along the human ventral visual pathwayNeuroImage57482494482–9410.1016/j.neuroimage.2011.04.056
9HiroseY.InagakiT.TanakaT.OgatsuH.1988Image noise evaluation method for xerographic prints of digitized imageJapan Hardcopy’88189192189–92
10HirschfeldH. O.1935A connection between correlation and contingencyMath. Proc. Camb. Phil. Soc.31520524520–410.1017/S0305004100013517
11KirchnerE.Van der LansI.PeralesE.Martínez-VerdúF.CamposJ.FerreroA.2015Visibility of sparkle in metallic paintsJ. Opt. Soc. Am. A32921927921–710.1364/JOSAA.32.000921
12Konica Minolta, INC. website, https://sensing.konicaminolta.us/products/cm-m6-spectrophotometer/, accessed May 2020
13NaganoH.OkamotoS.YamadaY.Semantically layered structure of tactile textures9th Int’l. Conf., EuroHaptics 2014 Proceedings I2014SpringerBerlin, Heidelberg, Germany393–9
14SchefféH.The Analysis of Variance1959John Wiley & Sons, Inc.New York, United States
15ShimodeY.OhtaniY.YasunagaH.2011How do craftspeople distinguish the appearance of natural-lacquerware? -Approach by optical image analysisJ. Japan Soc. Colour Material.84818681–610.4011/shikizai.84.81
16TaniY.NagaiT.KoidaK.KitazakiM.NakauchiS.2014Experts and novices use the same factors–but differently–to evaluate pearl qualityPLOS ONE97
17TobitaniK.NakajimaK.KatahiraK.NishijimaK.NagataN.“Visibility study on design pattern of car tail lamp using perceptual sensitivity on face recognition abilities,” FCV2016 the 22nd Korea- Japan Joint Workshop on Frontiers of Computer Vision. 356-361, (2016)
18UchidaO.2007Consideration and proposal concerning the analysis for paired comparison and matching test by correspondence analysisJ. Tokyo University of Information Sciences111101–10
19WatanabeS.2019One-shot multi-angle measurement device for evaluating the sparkle impressionJ. Imaging Sci. Technol.6306040110.2352/J.ImagingSci.Technol.2019.63.6.060401
20WatanabeS.SoneT.Evaluation of sparkle impression considering observation distanceIS&T Electronic Imaging: Material Appearance Proceedings2019IS&TSpringfield, VA151–5
21YanaiH.Inshi bunseki1990Asakura PublisherTokyo, Japan