Back to articles
Regular Articles
Volume: 1 | Article ID: jpi0115
Image
Multiscale Daltonization in the Gradient Domain
  DOI :  10.2352/J.Percept.Imaging.2018.1.1.010503  Published OnlineJanuary 2018
Abstract
Abstract

We propose a daltonization method that enhances chromatic edges and contrast for color-deficient people by optimizing the gradient of an image. We rotate and scale the error gradient between the original and its simulation in the color space into the direction of optimal visibility that is orthogonal to both the main direction of information loss and the direction of lightness. Then, we reintegrate the daltonized image version from the modified gradient through an iterative diffusion process. Moreover, we include multiscaling to guarantee optimal daltonization on different scales of the image. Also, we provide an interface for data attachment modules designed to maintain naturalness of memory colors like neutral colors. We evaluate and compare our proposed method to other top-performing daltonization methods in behavioral and psychometric experiments. A visual-search experiment assessing performance of the attentional mechanism of the human visual system before and after daltonization measures the greatest improvement in accuracy for our proposed method compared to the original and all investigated daltonization methods. It also reveals optimal results for both natural and Ishihara images among both protan and deutan color-deficient observers. Furthermore, we can deduce from the results of a pairwise preference evaluation that our proposed method is preferred highest amongst all color-deficient people in total. Our proposed method is also ranked among the most preferred daltonization methods for both protan and deutan color-deficient observers individually.

Subject Areas :
Views 259
Downloads 27
 articleview.views 259
 articleview.downloads 27
  Cite this article 

Joschua Thomas Simon-Liedtke, Ivar Farup, "Multiscale Daltonization in the Gradient Domainin Journal of Perceptual Imaging,  2018,  pp 010503-1 - 010503-12,  https://doi.org/10.2352/J.Percept.Imaging.2018.1.1.010503

 Copy citation
  Copyright statement 
Copyright © Society for Imaging Science and Technology 2018
  Article timeline 
  • received June 2018
  • accepted July 2018
  • PublishedJanuary 2018

Preprint submitted to:
jpi
Journal of Perceptual Imaging
J. Percept. Imaging
J. Percept. Imaging
2575-8144
Society for Imaging Science and Technology
1.
Introduction
Trichromatic color vision (referred to as normal-sighted color vision) is initiated by photosensitive cones carrying three different types of pigments on the retina of the human eye [1]. However, around 8% of the male population have a hereditary color vision deficiency (CVD) [2, 3]. CVDs are most often caused by non-existent pigments of one of the cones (so-called dichromacy), or cones whose pigments have slightly shifted sensitivities as compared to normal-sighted observers (so-called anomalous trichromacy) [1]. We refer to CVDs related to L-cones as protan CVDs, whereas anomalies related to the M-cones are called deutan CVDs. Protan and deutan color-deficient people have difficulties in differentiating colors between red and green. More precisely, certain colors (so-called confusion colors) are easily distinguishable for the normal-sighted, at the same times as they are hardly discriminable or perceived identically by the color-deficient [4, 5].
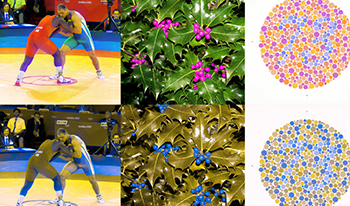
Furthermore, color-deficient vision is characterized by the decreased capability of detecting chromatic edges and contrast [1]. However, contour information described by edges and contrast plays a significant role in the human visual system (HVS) [1, 6]. More precisely, a reduced capability to detect chromatic edges and contrast might lead to behavioral disadvantages related to, for example, the attentional system by reducing the “pop-out” effect of certain colors [7, 8]. Other disadvantages might affect object recognition and the detection of emotional states as well [810]. Simulations of colour vision deficiencies are shown in Figure 1.
Figure 1.
The first row shows the original images. The second row shows the protan simulations and the third row shows the deutan simulations. The images have been simulated using the Brettel simulation for dichromats [26].
Therefore, daltonization methods exist to adapt confusion colors in digital images to increase their discriminability [1114]: Kotera [15] introduced a recoloring method to preserve naturalness and enhance visibility for the color-deficient of pseudo-spectral “fundamental images” computed from spectral LMS space. Fidaner et al. [16] proposed a recoloring method optimized for protanopes in which they redistribute the error image for the color-deficient in RGB. Most of these daltonization methods change confusion colors globally. However, we argue that spatial approaches targeting local color changes might lead to promising results due to the importance of edges and contrast for the HVS [1].
We typically address edges and contrast in the gradient domain [17, 18]. In general, we can reintegrate images from a modified gradient following the general strategy for multidimensional differential equations by solving the Euler–Lagrange equation as in [19] (typically solved numerically as in [20]).
Last, the assessment of daltonization methods is important to verify their performances. We presented behavioral methodologies to assess the performance of daltonization on the attentional mechanism by using different visual-search experiments in [2123]. We concluded from these studies that especially the accuracy data is well suited as an interval scale to rank different daltonization methods. Moreover, psychometric scaling experiments can complete the evaluation by assessing preference or naturalness of daltonized images by using, for example, pairwise comparison following Thurstone’s Law of Comparative Judgment [24, 25].
We propose a novel daltonization method, Yoshi-II, that focuses on enhancing chromatic edges and contrast. Yoshi-II is a content-dependent, spatial, customized, mainly automated (with possibilities for user input) recoloring method according to the classification in [11]. Computations for Yoshi-II take place in the gradient domain. We also use computations in scale space to process chromatic edges and contrast on different scales of the image, and provide a data attachment link to preserve naturalness of memory colors.
We summarize Yoshi-II in the following steps:
(i)
We first obtain an error image between the original and its CVD simulation in gradient space.
(ii)
Second, we modify the original gradient by rotating and scaling the error image in the color space into the direction of optimal visibility that is orthogonal to the direction of main error and the direction of lightness. Then, we add the modified gradient to the original gradient. This modification preserves the general contrast of the image and reintroduces lost information.
(iii)
We eventually obtain the daltonized image from the modified gradient image by solving the Euler–Lagrange equation and applying the Poisson diffusion.
Moreover, computations in scale space guarantee optimal results for confusion colors on different resolutions scales and areas of confusion colors that are not directly adjacent to each other [27]. We also introduce an interface for data attachment modules to maintain the naturalness of memory colors. We compare our proposed method with other state-of-the-art daltonization methods using behavioral and psychometric experimentations. Finally, we discuss possible improvements for our proposed method.
It should be noted that the daltonization method presented in this paper is specific for individual observer types and not meant as a general improvement for everybody. A general enhancement that will work for normal observers, as well as for observers with CVD is not goal of this paper. A discussion about daltonization in general, and characteristics and requirements of a “good” daltonization method can be found in a previous article [28].
2.
Proposed Daltonization Algorithm
An image is represented as a three-dimensional function u0 with typically three channels, red, green and blue:
(1)
u0:Ωc,where ΩR2,and c=[0,1]3u0=uRuGuB.
The gradient u0 represents the change of image values along the x- and y-axis for all channels [29]:
(2)
u0:ΩR2×R3u0=u0xu0y.
The simulated image s(u0), i.e., the representation of color-deficient vision, and its gradient image s(u0) are computed by using any simulation method [5, 15, 26, 30, 31]. We decided to use the Brettel simulation method in the proposed implementation, because it represents one of the most accurate simulation method as we discussed in a previous paper [32].
First, we compute the difference image u0 between the original image and its simulation: d0=u0s(u0). d0 contains the information that is lost for color-deficient observers. We apply a principal component analysis (PCA) [33] on d0 to obtain its first principal component, normalized and denoted as ed, that represents the main direction of difference. Colors or color changes along ed are least visible for color-deficient observers. It is the direction, along which most information gets lost for the color-deficient.
Second, we compute the direction of optimal visibility ec that is orthogonal to both the direction of maximum lost ed and the direction of lightness el to preserve the lost information. ec (the c stands for chroma) is computed by:
(3)
ec=ed×el.
Orthogonality to the error vector guarantees minimal information loss. However, rotation along only this direction would merely change the lightness of the confusion colors while maintaining hue and chroma. In [34], we tried to include lost information only in the lightness channel with unsatisfactory results. Thus, we concluded that the rotation should also be orthogonal to the direction of lightness. The lightness vector can, on the one hand, be defined by the neutral colors in sRGB space: el = [1.0,1.0,1.0]. This choice makes sense because neutral colors are perceived identically by color-deficient and normal-sighted people [26]. The lightness vector could, on the other hand, also be defined as the direction that is orthogonal to the plane of constant lightness in sRGB space: el = [0.2126,0.7152,0.0722] [35]. This direction would change hue and chroma of confusion colors while maintaining their original lightness.
Third, we approximate the difference between the original and its simulation, i.e., the lost information, through its projection along ed, u0ed, rotate and scale the lost information into the direction of optimal visibility ec, and add the rotated and scaled information to the original gradient to obtain a modified gradient denoted as tensor G:
(4)
G=u0+(u0ed)(χec)
χ influences how much the chroma should change at any point.
Fourth, we obtain the optimal value for χ at each point by assuming that the norm of the simulated tensor S(G) is equal to the norm of the original gradient because the visible gradient for a color-deficient observer looking at the daltonized image should equal in magnitude the gradients for a normal-sighted observer looking at the original image:
(5)
S(G)F2=!u 0F2
where … F2 represents the Frobenius norm. In this step, we approximate the simulation method by a linear projection onto the ed,el plane. Consequently, the actual daltonization element of the tensor, e.g., χ(u0ed)ec, is unaffected by the approximated simulation because it represents the part that is orthogonal to this projection. Thus, the simulated tensor can be approximated by S˜(G)s(u0)+χ(u0ed)ec. However, S˜(G)S(G). Equation (5) can be developed as:
(6)
S˜(G)F2=!u 0F2s(u0)+χ(u0ed)ecF2=!u 0F2χ2(u 0ed)ecF2+2χ(u 0ed)ec:s(u0)+s(u0)F2u0F2=0.
Equation (6) is a quadratic equation for χ solved by:
(7)
χ±=b±b24ac2a
where a=(u0ed)ecF2, b=2(u0ed)ec:s(u0), and c=s(u0)F2u0F2. However, which sign should we choose for χ? We integrate over the image for all the positive and all the negative χ and compare both values. If the positive integral is smaller than negative, we choose the positive χ values and vice versa. In other words, we want the solution that causes the least absolute changes in the image. We always choose the negative or positive χ value at each point in the image to change colors only toward one direction.
Figure 2.
Multiscaling pyramid structure, where “ 2” indicates minimizing the image to half its size, “ 2” indicates enlarging it to double its size, and “daltonize()” indicates the daltonization step at each iteration.
Fifth, reintegrating the improved daltonized image from the tensor G can be formulated as variational problem, where we find the daltonized image u through optimizing the following equation based on the Tikhonov model [36]. Ω represents the image domain, whereas dA represents dxdy in image coordinates:
(8)
min12ΩuGF2dA.
Solving the Euler–Lagrange equation [19, 37] results in a Poisson equation form:
(9)
2uG=0.
In the discrete case, this Poisson equation can be solved by gradient descent, i.e., the iterative reintegration by time [38]:
(10)
ut=2uG.
We define a stop criterion c for the gradient descent based on the residuals between the updated versions and the tensor G:
(11)
c=ΩuiGF2dAΩui+1GF2dAΩuiGF2dA.
The gradient descent stops when c is smaller than a certain threshold indicating that changes in the updating process are not significant anymore from one iteration step to the next one.
Sixth and finally, we test four different strategies for the boundary conditions:
(i)
In the first strategy, based on the Dirichlet condition [39], we keep the boundary values of the updated image fixed to the values of the original image, i.e., g(x,y)=u0(x,y).
(ii)
Based on the Neumann condition [39], the boundary values of the gradient image are set to the gradient of the original image, i.e., h(x,y)=u0.
(iii)
Another strategy based on the Neumann condition is to set the gradient image at the boundaries to zero, i.e., h(x, y) = 0.
(iv)
Last, zero was assigned to the Laplacian ∇2u(x, y) at the boundaries.
In the current implementation, we decided to use the third option because it gave the least amount of visual artifacts. Option (i) would create a visible contrast between original border pixels and daltonized center pixels, option (ii) would cause “bleeding” of unnatural colors from the borders, and option (iii) would cause “bleeding” of black from the borders.
One limitation of gradient images is that only areas of confusion colors that are directly adjacent to each other can be daltonized. One solution for this problem is multiscaling, e.g., daltonization of the image at different resolutions in scale space [27]. We can represent the core idea of multiscaling as a pyramid structure, which “is obtained by successively reducing the image size by combined smoothing and subsampling” [27]. In Yoshi-II (cf. Figure 2), we reduce the size of the image repeatedly by half until the lowest resolution, from where we start the actual daltonization. From then on, we daltonize the current scale version and add the result to the difference between the two previous resolution scales until we reach the highest resolution again. We can use different interpolation options for the re-sizing step including bilinear, bicubic, etc., interpolation, whereof we used bicubic interpolation in the current implementation because it caused the least amount of visual artifacts.
Another important requirement for daltonization methods is to maintain the natural appearance of the original image. Especially memory colors like skin, grass, etc., or neutral areas should stay the same as the original as much as possible. This can be done by adding a data attachment link or fidelity term [36] to Equation (10) weighted by a function h(x, y) and the strength of the data attachment indicated by the scalar l:
(12)
ut=[2uG]lh(x,y)(uu 0).
In the current implementation of Yoshi-II, a data attachment is added to preserve neutral areas by using a weighting function h(x, y) analyzing chroma. Chroma is computed in CIELAB color space as Cab(x,y)=a(x,y)2+b(x,y)2 with a(x, y) and b(x, y) being the a and b coordinates in CIELAB space at (x, y) [40]. Moreover, the chroma is weighted by a Gaussian:
(13)
h(x,y)=expCab(x,y)22σ2=expa(x,y)2+b(x,y2)2σ2.
Figure 3.
The first row shows the deutan daltonization by our proposed method Yoshi-II and the second row their simulations using the Brettel simulation for dichromats [26].
Figure 4.
The first row shows the protan daltonization by our proposed method Yoshi-II and the second row their simulations using the Brettel simulation for dichromats [26].
3.
Evaluation Method
For the experimental validation, we use our proposed daltonization method, Yoshi-II, with data attachment for neutral colors and multiscaling. Simulated images are computed using the simulation method by Brettel et al. [26]. Re-sizing in scale space is done by using the scipy.misc.resize function with the bicubic interpolation option [41], and we set the cutoff threshold for the multiscaling step to 0.00005. Moreover, we set the σ of the Gaussian in the neutral color fidelity term to 0.05. We use the constant lightness vector as defined in the sRGB standard. The sign for the quadratic solution of the χ values has been chosen in the very first daltonization step at the lowest resolution. That means if the coarsest resolution revealed the least difference for the positive solutions of the χ values, the positive signs have been chosen for all the following scale levels as well to provide consistent changes in recoloring. Last, we use the third boundary option described before. Examples for three images and their respective simulations for deutan and protan dichromatic vision are shown in Figure 3 and Figure 4, respectively. The examples provide a general idea about how the proposed method performs. It also showcases some of the advantages and disadvantages of Yoshi-II.
Each observer is tested and categorized using the HRR CVD test by Richmond Products, Inc. [42, 43]. We followed a guideline [44] suggesting a minimum of 10–20 observers for psychophysical and psychometric evaluations and recruited 13 normal-sighted, 14 deutan color-deficient, and 5 protan color-deficient observers for the behavioral experiment:
(i)
Two of the deutan color-deficient observers had mild, three have medium, and nine have strong deutan CVDs.
(ii)
All of the five protan color-deficient observers had strong protan CVD.
This distribution roughly represents the real-life distribution of CVD that is reported with approximately 75% for deutan defects and 25% for protan defects (About 6% of the male population have a deutan defect versus 2% with a protan defect according to [2] or 6.09% versus 1.92% according to [3]). Moreover, the results from normal-sighted observers individually, deutan color-deficient observers individually, and protan and deutan color-deficient observers combined will be representative enough. The results from only protan color-deficient observers, however, will be taken with care. We also recruited 13 normal-sighted, 13 deutan color-deficient, and four protan color-deficient observers for the psychometric experiment.
(i)
Two of the deutan color-deficient observers had mild, two had medium, and nine had strong deutan CVD.
(ii)
All four protan color-deficient observers had strong protan CVD.
3.1
Behavioral Experiment
We use a behavioral method for the assessment called ViSDEM that we presented in [22, 23]. In this visual-search experiment, we measure the performance of the attentional system. The observer has to retrieve information related to color from various motives before and after daltonization. We compute the accuracies and response times of all methods from the observations of all observers. We rank the investigated methods on an interval scale from highest to lowest behavioral performance by their accuracy values in decreasing order. We compare our proposed method to the two best performing daltonization methods from [23]: Namely the Kotera [15] and the Fidaner methods [16]. We use 11 sets with 11 associated tasks containing 17 motives, of which 11 depicted natural images and six represented Ishihara plates. We only present the results from the accuracy data because the response time data does not give any additional insights as we discussed in [23]. We analyze the data with the same methods described in [23] including the Wilson interval score [45] and a χ2 test [46].
3.2
Psychometric Experiment
The psychometric evaluation is based on Thurstone’s Law of Comparative Judgment [24, 25]. More precisely, we follow the Case V solution described in [25]. We show each possible pair between the daltonized and original versions of one motive. We ask the observers which one of the two versions in each observation “he/she prefers.” We sum the results from each comparison over all observers in the so-called observation matrix and compute the frequency/probability matrix by dividing it by the total number of observations. We then compute the inverse of the cumulative density function for each of the probability values to obtain the individual z-scores. The average of all z-scores for each version results in the mean z-score or “worth” value of the version. A higher z-score indicates that the observers were more likely to choose this version over another. Finally, we compute the Montag confidence intervals (CIs) of each z-score [47]:
(14)
CI=z±b1(nb2)b3(Nb4)b5
where b1 = 1.76, b2 = −3.08, b3 = −0.613, b4 = 2.55, b5 = −0.491, N is the number of observations, and n is the number of investigated daltonization methods. Z-scores are statistically significantly different, when their CIs do not overlap. As before, we compare Yoshi-II to the Kotera and Fidaner methods. We use 16 motives, mostly identical to the ones from the behavioral experimentation: 10 of which depict natural images and 6 represent Ishihara plates.
ViSDEM is implemented with PsychoPy2 [48], and we use multiple Python libraries for the statistical data analysis, namely the NumPy, the Matplotlib, the SciPy, and the Pandas libraries [41, 4951]. We conduct the experiments on a PC with Windows 7 calibrated by an Eye-One Match Pro to medium white (D65), a gamma of 2.2 and illuminance of 120 lux. We used D50-like fluorescent lights as surrounding lights that were dimmed to approximately 200 lux resulting in a color temperature of ca. 4230 K for the CVD testing, and dimmed to ca. 30 lux (4411 K) for the evaluation.
Figure 5.
Accuracy data for color-deficient observers versus normal-sighted (top), protan versus deutan color-deficient observers (middle), and natural versus Ishihara images for color-deficient observers (bottom).
Table I.
Statistical analysis of the accuracy data for color-deficient versus normal-sighted (top), protan versus deutan (middle), and natural versus Ishihara images for color-deficient observers (bottom). Statistically significant values are emphasized.
4.
Results
4.1
Behavioral Results
The accuracy values for color-deficient observers show distinctly different accuracy values as seen in Figure 5a: From Yoshi-II (0.94), over Kotera (0.87) and Fidaner (0.79), to the original (0.70) version. All accuracy values are statistically significantly different from each other (cf. Table Ia). In contrast, the results from the normal-sighted are more homogeneous (cf. Fig. 5b): Starting with Fidaner (0.99) and the original (0.99) to Kotera (0.96) and Yoshi-II (0.96). The χ2 test reveals that the accuracy values for Kotera and Yoshi-II are statistically significantly lower than the values for Fidaner and the original (cf. Table Ib).
Deutan color-deficient observers have a similar overall ranking as color-deficient observers in total (cf. Fig. 5c): First Yoshi-II (0.95), then Kotera (0.92), Fidaner (0.78) and finally the original (0.74). Only the original and Fidaner are not statistically significantly different from each other (cf. Table Ic). However, the ranking changes slightly for protan color-deficient observers (cf. Fig. 5d): The highest accuracy is measured for Yoshi-II (0.90), then Fidaner (0.82), Kotera (0.74) and the original (0.62). All image versions are statistically significantly different from each other (cf. Table Id).
The accuracy values of color-deficient observer for natural scenes depict only little variances (cf. Fig. 5e): The highest accuracy is measured for Yoshi-II (0.95), then Fidaner (0.92) and the original (0.89), and finally Kotera (0.86). The accuracy value for Yoshi-II is statistically significantly higher than Kotera and the original, whereas the accuracy value for Fidaner is statistically significantly greater than Kotera (cf. Table Ie). The accuracy values for the Ishihara images have a similar pattern as the overall accuracy values but with greater variances (cf. Fig. 5f): Yoshi-II with the highest accuracy value (0.92), then Kotera (0.87), Fidaner (0.57), and the original (0.35). Only Kotera and Yoshi-II are not statistically significantly different from each other (cf. Table If).
4.2
Psychometric Results
Figure 6.
Z-scores of different observer groups for the investigated daltonization method. The z-scores represent the worth value of a daltonization method. A high z-score indicates that observers prefer the daltonization method more often than the others.
The ranking from the psychometric experimentation varies slightly. The ranking from the psychometric testing according to preference values, z-scores, can be seen in Figure 6a: It shows the highest preference for Yoshi-II (0.22), Kotera (0.14), original (0.03), and finally Fidaner (− 0.38). We can see a similar preference ranking for deutan color-deficient observers (cf. Fig. 6c): This time starting with Kotera (0.33), then Yoshi-II (0.30), then the original (− 0.08), and finally Fidaner (− 0.55). The preferences for protan color-deficient observers shifts (cf. Fig. 6d): First the original (0.36), then Fidaner (0.12), Yoshi-II (− 0.02), and finally Kotera (− 0.46). Normal-sighted observers have a somewhat different ranking (cf. Fig. 6b): The original with the highest z-score value (0.64), followed by Fidaner (0.02), and finishing with Yoshi-II (− 0.15) and Kotera (− 0.39).
5.
Discussion
The visual examples for deutan daltonization in Fig. 3 show how Yoshi-II reintroduces lost information by adapting confusion colors in hue and chroma. The color differences of the wrestling jerseys, for example, become clearly visible, the berries pop up against the foliage in the background, and the number in the Ishihara plate becomes more readable for the color-deficient observer. We can observe an almost identical effect of the protan daltonization in Fig. 4 for the natural images. The protan daltonization of Ishihara plates, however, highlights some downsides of the algorithm: Although the colors of the dots that form the number become better readable than before, the colors of the other dots change as well to a degree that might distract from identifying the correct number.
However, Ishihara images are not representative of most natural images. Natural images have color gradients, and colored areas are usually not separated by a white background. In natural images, like photographies, our proposed method performs very well. Yoshi-II does not have difficulties with images where confusion colors are directly adjacent to each other, as can be seen with the berry pictures. Likewise, multiscaling can overcome the inherent challenges of computations in the gradient domain in cases where confusion colors are not adjacent to each other, like the jerseys of the wrestlers. Multiscaling can even help to overcome some difficulties in images like the Ishihara plates.
Furthermore, the background of the Ishihara plates and most neutral and dark areas in the wrestler images are still white or neutral like in the original thanks to neutral data attachment. Without data attachment, the color changes in these regions would have been more drastic. We assume that data attachment contributes to the high preference and good behavioral results because most color-deficient observers perceive neutral colors in the same way as normal-sighted people do [26]. Many of our color-deficient observers noted, for example, that the color changes in skin color of the wrestler images were somewhat distracting and unappealing. These remarks lead us to believe that Yoshi-II could further be improved by widening the data attachment to cover other memory colors as well like skin, grass, sky, etc. In future work, we could, for example, include a data attachment link based on skin color detection (as in [52]). This skin data attachment would keep skin colors as natural as possible leading to a possible boost in the preference z-score. However, adding complex skin or memory color identification algorithms might make the daltonization methods too complicated or computational expensive. Another option might be to define a lookup table for a set of memory colors. This should be combined with some sort of color constancy or white balancing algorithm to take different illumination situations into account.
One notable side effect of our proposed method is artifacts introduced by the gradient descent of the reintegration process. Color changes are diffused starting from the edges of objects into the center of said objects. Usually, this diffusion works well for small objects, and the reintegration process can change colors quickly like for the berries. If the optimization stops too early, however, halo effects arise as can be seen on the edges of the wrestler image and in the leg area of the left wrestler. We could address these problems by using different functions for the optimization function like total variational or anisotropic approaches that might both reduce halo effects at the edges. Total variation (as in [53]) will minimize the strength of diffusion at the borders at the same time as colors might still be diffused across the edges. Anisotropic diffusion (as in [54, 55]) will not only reduce diffusion at the edges but will only diffuse the colors along the edges never across.
The results from the behavioral and psychometric evaluation reveal a clear ranking for color-deficient observers (cf. Figs. 5a and 6a). We can rank the daltonization methods from highest to lowest accuracy as following:
(i)
From Yoshi-II to
(ii)
Kotera,
(iii)
Fidaner, and
(iv)
the original.
This ranking of the two preexisting methods, Kotera and Fidaner, and the original versions confirms the ranking we observed in [23]. Moreover, we can rank the daltonization methods according to preference from
(i)
Yoshi-II to
(ii)
Kotera,
(iii)
the original, and
(iv)
Fidaner.
The results show that our proposed method, Yoshi-II, not only increases behavioral response for color-deficient observers compared to both the original and the other daltonization methods, but that Yoshi-II is also preferred by the color-deficient observers to the original and any other daltonization method.
The accuracy of Yoshi-II for color-deficient observers in total is not only very high but also lays within the accuracy CI of normal-sighted people (cf. Figs. 5a and 5b). Likewise, the accuracy value of Yoshi-II for normal-sighted observer is still very high, although it decreases slightly as compared to the original. Both observations support the beneficial performance of our proposed method in the light of universal design: Namely, that daltonization improves behavioral response for the color-deficient at the same time as it restricts deterioration for normal-sighted observers [23].
Yoshi-II performs also best for different types of CVDs (cf. Figs. 5c and 5d): Yoshi-II improves the behavioral response as compared to the original for both protan and deutan color-deficient observers. More precisely, its accuracy value ranks among the two highest accuracy values for both protan and deutan color-deficient observers. Fidaner seems to perform better than its average for protan color-deficient observers, whereas Kotera performs better than its average for deutan color-deficient observers. The performance of the Fidaner method is no surprise because it was originally optimized for protanopes [16]. Daltonization using the protan option of the Kotera method often causes yellow tints in areas with neutral or light colors. These tints might distract protan color-deficient observers and might cause the lower accuracy. The results for protan color-deficient observers have to be taken with care, however, because five protan color-deficient observers might not be representative of the total group of protan color-deficient observers even though the results show statistically significant differences. Moreover, the accuracy values for “natural images only” are much closer than the values for “Ishihara images only” (cf. Figs. 5e and 5f) or both values combined as for the results in [23]. At the same time, however, the accuracy value of Yoshi-II is not only higher than the original, but it is also among the two highest values for both image types.
Although Yoshi-II is preferred to the original and any other daltonization method by all color-deficient observers combined (cf. Fig. 6a), the observer groups have different preferences for the investigated methods. On the one hand, Yoshi-II and Kotera are preferred to the original or Fidaner by most deutan color-deficient observers (cf. Fig. 6c). On the other hand, the original ranks highest amongst protan color-deficient observers followed by the Fidaner method (cf. Fig. 6d). The reasons might be similar to the ones discussed above, namely that Fidaner was optimized for protanopes and Kotera creates a yellow tint for some images. However, the results for protan color-deficient observers have to be taken with caution as mentioned before.
Furthermore, there seems to be a correlation between behavioral accuracy and preference for color-deficient observers. The results from the psychometric evaluation, for example, are more or less congruent with the results from the behavioral evaluation with the exception that the preference values of the original version always rank higher than its accuracy values from the behavioral experimentation. The results for normal-sighted observers, in contrast, reveal a much bigger difference between behavioral and psychometric results (cf. Fig. 6b). More precisely, the original is preferred much more than any of the other version, with Fidaner being the second. Many of our observers stated that they judged preference according to how natural they perceived an image. Thus, they might have preferred the original most often because it appears the most natural. The Fidaner ranking as the second is not surprising either since Fidaner changes only the lightness of confusion colors such that the Fidaner looks very similar to the original. However, naturalness did not seem to be equally important for color-deficient observers.
There are a few fundamental differences between behavioral and psychometric evaluation strategies. The psychometric experiment measures the subjective preference of the observers, whereas the behavioral test assesses the objective reflexive reaction of the observers’ HVS [56]. Which one of the evaluation strategies is, therefore, most useful and most trustworthy? A daltonization method is a visual tool for the color-deficient to adapt confusion colors because chromatic edges and contrast are harder to detect, which has consequences on their behavioral responses. In other words, daltonization should have the goal of improving the behavioral response in general, and chromatic edges and contrast in specific. Thus, we argue the behavioral evaluation to be more important than the aesthetic or preferential, i.e., psychometric, assessment of the image.
We chose the psychometric and behavioral evaluation methods because we wanted to get empirical results from human observers with actual CVDs. We could have considered another objective evaluation method that could involve saliency models before and after daltonization. If the average saliency, for example, increased in the simulated image after daltonization compared to before daltonization, then the daltonization algorithm would be performing as it should be. Another strategy could be to measure color differences between adjacent areas in the simulated image before and after daltonization. The advantage would be that we could get a general idea of improvement without human observers. At the same time, however, the results would be influenced by the unknown accuracy of the simulation methods.
6.
Conclusion
We introduce a daltonization method for color-deficient people focusing on the enhancement of chromatic edges and contrast called Yoshi-II. Our proposed method is the first method that enhances images in the gradient domain, which is well suited for detecting chromatic edges and contrast. We obtain very good visual enhancement by rotating and scaling the error between the gradients of the original and its simulation in the color space into the plane of optimal visibility that is orthogonal to the main direction of lost information and the direction of lightness. Furthermore, we present the possibility of multiscaling to improve chromatic edges and contrast of areas that are not directly adjacent to each other. Last, we introduce an option to maintain naturalness by providing an interface for data attachment linked to memory colors like, for example, neutral colors.
Yoshi-II performs very well for different CVD and image types. Our proposed method causes increased behavioral response in color-deficient observers combined, and protan and deutan observers individually. Behavioral tests also reveal optimal results for both natural and Ishihara images. More precisely, Yoshi-II leads to improved behavioral response among color-deficient observers as compared to the original, on the one hand, and the Kotera and Fidaner daltonization methods, on the other hand. Moreover, Yoshi-II is preferred to the original and any other of the investigated daltonization methods in a psychometric evaluation. It is ranked among the most preferred daltonization methods for both protan and deutan color-deficient observers.
In future work, we will investigate other optimization strategies like total variational and anisotropic solutions to limit halo artifacts. We will also research various data attachment modules to maintain other memory colors like skin colors.
Acknowledgment
The authors would like to thank Dr. Marius Pedersen (NTNU) for his help in setting up the psychometric experiment, and Prof. Phil Green (NTNU) for contributing to the analysis the data from the psychometric evaluation. This research has been funded by the Research Council of Norway through project no. 221073 “HyPerCept—Colour and quality in higher dimensions.”
References
1NeitzJ.NeitzM.2010The genetics of normal and defective color visionVision51633651633–5110.1016/j.visres.2010.12.002
2RigdenC.1999The Eye of the Beholder’ - Designing for Colour-Blind UsersBr. Telecommun. Eng.17262–6
3HansenE.Fargeblindhet20101st ed.Gyldendal Norsk Forlag ASOslo, Norway
4ValbergA.Lys Syn Farge19981st ed.Tapir ForlagChichester, England, United Kingdom
5FlatlaD.GutwinC.“‘So That’s What You See!”’ Building Understanding with Personalized Simulations of Colour Vision DeficiencyASSETS ’12: The Proc. 14th Int’l. ACM SIGACCESS Conf. on Computers and Accessibility2012Association for Computing Machinery (ACM)Boulder, Colorado, USA167174167–74
6HubelD. H.WieselT. N.1968Receptive fields and functional architecture of monkey striate cortexJ. Physiol.195215243215–4310.1113/jphysiol.1968.sp008455
7TreismanA. M.GeladeG.1980A feature-integration theory of attentionCogn. Psychol.129713697–13610.1016/0010-0285(80)90005-5
8Simon-LiedtkeJ.FarupI.Empirical Disadvantages for Color-Deficient PeopleMid-Term Meeting of the Int’l. Colour Association (AIC 2015)2015International Colour Association (AIC)Tokyo, Japan391394391–4
9ChangiziM. A.ZhangQ.ShimojoS.2006Bare skin, blood and the evolution of primate colour visionBiol. Lett.2217221217–2110.1098/rsbl.2006.0440
10BramãoI.FaíscaL.PeterssonK. M.ReisA.The Contribution of Color to Object RecognitionAdvances in Object Recognition Systems2012InTechRijeka, Croatia738873–88
11MilićN.NovakovićD.MilosavljevićB.Enhancement of image content for observers with colour vision deficienciesColor Image and Video Enhancement2015SpringerCham315343315–43
12HuangJ.-B.ChenC.-S.JenT.-C.WangS.-J.Image recolorization for the colorblindIEEE Int’l. Conf. on Acoustics, Speech and Signal Processing, 2009 (ICASSP 2009)2009IEEEPiscataway, NJ116111641161–4
13KuhnG. R.OliveiraM. M.FernandesL. A.2008An efficient naturalness-preserving image-recoloring method for dichromatsIEEE Trans. Vis. Comput. Graphics14174717541747–5410.1109/TVCG.2008.112
14MachadoG. M.OliveiraM. M.2010Real-time temporal-coherent color contrast enhancement for dichromatsComput. Graph. Forum29933942933–4210.1111/j.1467-8659.2009.01701.x
15KoteraH.Optimal daltonization by spectral shift for dichromatic visionProc. IS&T/SID CIC20: Twentieth Color and Imaging Conf.2012IS&TSpringfield, VA302308302–8
16AnagnostopoulosC.-N.TsekourasG.AnagnostopoulosI.KalloniatisC.Intelligent modification for the daltonization process of digitized paintingsProc. 5th Int’l. Conf. on Computer Vision SystemsMarch 2007Universität BielefeldBielefeld, Germany
17AlsamA.DrewM. S.Fast Colour2greyProc. IS&T/SID CIC16: Sixteenth Color Imaging Conf.2008IS&TSpringfield, VA342346342–6
18Di ZenzoS.1986A note on the gradient of a multi-imageComput. Vis. Graph. Image Process.33116125116–2510.1016/0734-189X(86)90223-9
19GoldsteinH.Classical MechanicsAddison-Wesley World Student Series1950Vol. 1Addison-WesleyReading, Mass
20TveitoA.LangtangenH. P.NielsenB. F.CaiX.Elements of Scientific Computing2010Vol. 7SpringerBerlin Heidelberg
21Simon-LiedtkeJ.HardebergJ. Y.Task-Based Accessibility Measurement of Daltonization Algorithms for Information Graphics12th Congress of the Int’l. Colour Association (AIC 2013)July 2013Int’l. Colour Assn. (AIC)Newcastle, UK108111108–11
22Simon-LiedtkeJ. T.FarupI.LaengB.2015Evaluating color deficiency simulation and daltonization methods through visual search and sample-to-match: SaMSEM and ViSDEMProc. SPIE9395939513939–513
23Simon-LiedtkeJ. T.FarupI.February 2016Evaluating color vision deficiency daltonization methods using a behavioral visual-search methodJ. Vis. Commun. Image Represent.35236247236–4710.1016/j.jvcir.2015.12.014
24ThurstoneL. L.July 1927A law of comparative judgmentPsychol. Rev.34273286273–8610.1037/h0070288
25EngeldrumP. G.Psychometric Scaling: A Toolkit for Imaging Systems Development2000Imcotek PressWinchester, MA, USA
26BrettelH.ViénotF.MollonJ. D.1997Computerized simulation of color appearance for dichromatsJ. Opt. Soc. Amer. A14264726552647–5510.1364/JOSAA.14.002647
27LindebergT.1994Scale-space theory: A basic tool for analyzing structures at different scalesJ. Appl. Stat.21225270225–7010.1080/757582976
28Simon-LiedtkeJ. T.FlatlaD.BakkenE. N.Checklist for Daltonization methods: Requirements and characteristics of a good recolouring methodIS&T Electronic Imaging: Color Imaging XXII: Displaying, Processing, Hardcopy, and Applications Proc.2017IS&TSpringfield, VA212721–7
29GonzalezR. C.WoodsR. E.Digital Image Processing20083rd ed.Pearson Education Inc.Upper Saddle River, NJ, USA
30ViénotF.BrettelH.MollonJ. D.1999Digital video colourmaps for checking the legibility of displays by dichromatsColor Res. Appl.24243252243–5210.1002/(SICI)1520-6378(199908)24:4<243::AID-COL5>3.0.CO;2-3
31LucassenM.AlferdinckJ.Dynamic simulation of color blindness for studying color vision requirements in practiceCGIV2006: 3rd European Conf. on Colour in Graphics, Imaging, and Vision2006IS&TSpringfield, VA355358355–8
32Simon-LiedtkeJ. T.FarupI.2016Using a behavioral match-to-sample method to evaluate color vision deficiency simulation methodsJ. Imaging Sci. Technol.6010.2352/J.ImagingSci.Technol.2016.60.5.050409
33JolliffeI.Principal Component Analysis2002SpringerBerlin, Heidelberg
34Simon-LiedtkeJ. T.FarupI.2015Spatial Intensity Channel Replacement Daltonization (SIChaRDa)Proc. SPIE9395939516939–516
35International Electrotechnical Commission (IEC), “IEC 61966-2-1:1999,” Technical Report, International Electrotechnical Commission (IEC) (1999)
36FarsiuS.EladM.MilanfarP.2006Multiframe demosaicing and super-resolution of color imagesIEEE Trans. Image Process.15141159141–5910.1109/TIP.2005.860336
37JähneB.Digital Image Processing20056th ed.Spinger-Verlag-Berlin-HeidelbergBerlin, Germany
38RudinL. I.OsherS.FatemiE.Nov. 1992Nonlinear total variation based noise removal algorithmsPhys. D60259268259–6810.1016/0167-2789(92)90242-F
39ChengA. H.-D.ChengD. T.2005Heritage and early history of the boundary element methodEng. Anal. Bound. Elem.29268302268–30210.1016/j.enganabound.2004.12.001
40SharmaG.Digital Color Imaging Handbook2002CRC Press, Inc.Boca Raton, FL, USA
41SciPy Developers, “SciPy documentation,” http://www.scipy.org/, 2013, Last checked: 04/23/2015
42HardyL.RandG.RittlerM. C.1954HRR polychromatic platesJ. Opt. Soc. Am.44509521509–2110.1364/JOSA.44.000509
43NeitzJ.BaileyJ.H.R.R. Pseudoisochromatic Plates20024th ed.Richmond Products, Inc.Albuquerque, NM, USAoriginally developed by Hardy LeGrand, Getrude Rand, and M. Catherine Rittler
44KeelanB. W.UrabeH.2003ISO 20462: A psychophysical image quality measurement standardImage Qual. Syst. Perform.5294181189181–9
45WilsonE. B.1927Probable inference, the law of succession, and statistical inferenceJ. Am. Stat. Assoc.22209212209–1210.1080/01621459.1927.10502953
46LøvåsG. G.Statistikk for Universiteter Og Høgskoler20082nd ed.UniversitetsforlagetOslo, Norway
47MontagE. D.2006Empirical formula for creating error bars for the method of paired comparisonJ. Electron. Imaging15010502010–50210.1117/1.2181547
48PeirceJ.“PsychoPy documentation,” http://www.psychopy.org/index.html, 2014, Last checked: 04/23/2015
49NumPy Developers, “NumPy documentation,” http://www.numpy.org/, 2013, Last checked: 04/23/2015
50Matplotlib Development Team, “Maplotlib documentation,” http://matplotlib.org/, 2014, Last checked: 04/23/2015
51PyData Development Team, “Pandas documentation,” http://pandas.pydata.org/, 2012, Last checked: 04/23/2015
52KovacJ.PeerP.SolinaF.2003Human skin color clustering for face detectionIEEE2
53BlomgrenP.ChanT. F.1998Color TV: Total Variation Methods for Restoration of Vector-Valued ImagesImage Process. IEEE Trans.7304309304–910.1109/83.661180
54SapiroG.Vector-valued active contoursProc. 1996 IEEE Computer Society Conf. on Computer Vision and Pattern Recognition (CVPR)1996IEEEPiscataway, NJ680685680–5
55SapiroG.1997Color snakesComput. Vis. Image Underst.68247253247–5310.1006/cviu.1997.0562
56PurvesD.LottoR. B.Why We See What We Do Redux: A Wholly Empirical Theory of Vision2011Sinauer Associates, Inc.Sunderland, Massachusetts, USA