Back to articles
Work Presented at Electronic Imaging 2024
Volume: 67 | Article ID: 060407
Image
Spatio–Temporal Retinex–Inspired Envelopes with Anisotropic Diffusion
  DOI :  10.2352/J.ImagingSci.Technol.2023.67.6.060407  Published OnlineNovember 2023
Abstract
Abstract

Since the introduction of the Retinex theory by Land and McCann in 1971, a multitude of different families, versions, interpretations, implementations, and applications have been proposed. The applications for image enhancement mainly differ in (i) how they explore the locality of the images to determine the local context, and (ii) how they recompute the pixel values based on this context. STRESS (spatio-temporal Retinex-inspired envelopes with stochastic sampling) is one of many quite successful members of the family of Retinex-based image enhancement algorithms. It explores the locality using a stochastic sampling technique, resulting in two envelope images – one maximum and one minimum envelope, completely enclosing the image signal and serving as a representation of the local image context. In this paper, we propose to exchange the stochastic sampling technique of STRESS, which causes significant chromatic noise, with an adapted version of constrained linear anisotropic diffusion for computing the envelopes, resulting in almost noise-free images. Using both subjective experiments and objective image metrics, we show that it improves the perceived and measured image quality and reduces noise artefacts.

Supplementary Material
Subject Areas :
Views 90
Downloads 19
 articleview.views 90
 articleview.downloads 19
  Cite this article 

Petter Sagvold, Ivar Farup, Marius Pedersen, "Spatio–Temporal Retinex–Inspired Envelopes with Anisotropic Diffusionin Journal of Imaging Science and Technology,  2023,  pp 1 - 18,  https://doi.org/10.2352/J.ImagingSci.Technol.2023.67.6.060407

 Copy citation
  Copyright statement 
Copyright © Society for Imaging Science and Technology 2023
 Open access
  Article timeline 
  • received July 2023
  • accepted December 2023
  • PublishedNovember 2023
jist
JIMTE6
Journal of Imaging Science and Technology
J. Imaging Sci. Technol.
1062-3701
1943-3522
Society for Imaging Science and Technology
1.
Introduction
The primary purpose of image enhancement is to improve the perceived quality of an image for a human observer. Many techniques have been proposed over the years, with varying effectiveness and efficiency. A common strategy for many algorithms is that they in one way or another, try to mimic some properties of the human visual system. Many such algorithms are based on the Retinex theory of colour vision [13]. Retinex-based image enhancement is often a two-step procedure. First, the local context of the image is computed. Second, the pixel values are recomputed based on the local context. Many families, versions, interpretations, and implementations of Retinex-based image enhancement techniques have been proposed over the years, and it has been used for various colour imaging applications such as colour correction, computational colour constancy, HDR image rendering [4], colour gamut mapping, and colour-to-greyscale conversion [5]. More recent developments take Retinex-based methods in the direction of deep learning [68].
STRESS – Spatio-temporal Retinex-inspired envelopes with stochastic sampling – is one quite successful member of the family of Retinex-inspired algorithms [9]. In STRESS, the locality is represented by two envelope colour images with gamma-corrected RGB values, Emax and Emin, which have the properties 0 ≤ Eminu0Emaxu0, where u0 is the original image. Similar to other Retinex-based algorithms such as RSR [10], these envelopes are computed by a stochastic sampling technique, and are thus subject to chromatic noise. The noise in each channel is caused by random sampling, and its chromatic content is due to the independent sampling of the three colour channels. In the second step, the (gamma-corrected) values of the original image are linearly rescaled using the envelopes.
In this paper, we propose another method for exploring the locality in the STRESS algorithm to significantly reduce the noise caused by the stochastic sampling. Similar to more recent methods like STRETV (based on total variation, which is isotropic) [11] and ReMark (based on Markov chains, also isotropic) [12], we focus our attention on diffusion-based approach. By introducing an adapted and constrained version of linear anisotropic diffusion – a technique originally aimed at reducing image noise that has recently been applied to colour imaging applications beyond denoising [13, 14] – for computing the envelopes, we can minimise the image noise resulting from the noise in the envelopes.
In Section 2, we present the basic ideas of the STRESS algorithm and anisotropic diffusion. Then, in Section 3, we detail the proposal of using anisotropic diffusion for computing the envelopes and show example results. The experimental setup for evaluating its performance both in terms of overall image preference and noise is described in Section 4, and the results are given in Section 5, before concluding in Section 6.
2.
Background
2.1
STRESS
Some Retinex-based implementations explore the images by using paths or computing ratios with neighbours in a multilevel framework [3, 1519] or using models of Brownian motions to analyse the image along paths [20, 21]. Other implementations compute values over the given image with convolution masks or weighting distances [2226]. In a study [10], the path-based scanning was substituted by a new approach using random sampling of a cloud of points.
A similar approach was followed for the STRESS algorithm [9]. Here, the visual context was characterised using two envelopes Emax and Emin. For each pixel, p0, the values of the maximum and minimum envelopes at the corresponding positions, are computed through N iterations. In every iteration, M pixel values pi in each channel are sampled at random with a probability proportional to 1∕d, d being the Euclidean distance in the image from the sampled pixel to the pixel in question. The value of the centre pixel is not eligible for random sampling but is always included in the sampled set. From these samples, the maximum and minimum samples in the spray are found: smax = max(pj), smin = min(pj). Since p0 is always among the sample points, it is granted that sminp0smax. These maximum and minimum points could be taken as direct estimates for the envelopes. However, better results were achieved when the relative position vi of the pixel p0 within the range ri = smaxsmin was used.
The final envelopes were computed as
(1)
Emin=p0+v̄r̄
(2)
Emax=Emin+r̄,
where v̄ is the average of the v values, and r̄ is the average of the r values over the N iterations. The new image is recomputed by stretching the image to these envelopes,
(3)
p=p0EminEmaxEmin
It should be noted that this is a heavy computational technique requiring O(NMP) operations, where N is the number of iterations, M is the number of samples per iteration, and P is the number of pixels in the image.
The sampling technique also introduces a significant chromatic noise. The type of noise is quite particular to STRESS. To the best of our knowledge, this type of noise has not been characterised in the literature. A histogram of the noise in each colour channel, produced by computing the difference between STRESS images with 100 (noisy) versus 1000 (virtually noiseless) iterations, is shown in Figure 1. It is symmetric, but far from Gaussian. There is no correlation between the noise of the different image channels.
Figure 1.
Histogram of the noise caused by random sampling in the STRESS algorithm.
2.2
Anisotropic Diffusion
Since this method produces significant chromatic noise, another approach is taken in the STRETV algorithm [11]. Here, the constrained total variation method is used to calculate the envelopes. Total variation minimisation results in a process very similar to non-linear isotropic diffusion. This implementation showed promising results when used in contrast enhancement and in automatic colour correction, with significantly reduced noise levels. However, due to the non-linearity of total variation, the method requires a tiny time-step and thus many iterations to converge. Although it behaves nicely near edges in the original image, it creates some artefacts near corners and lines of high curvature.
Various diffusion techniques have been widely used in computer vision and image processing to reduce image noise without removing significant information from the image. One important technique is the Perona–Malik diffusion [27], which is an isotropic, local, non-linear diffusion technique, not too different from total variation minimisation. Unfortunately, Perona–Malik diffusion was misnomed “anisotropic diffusion”. Real anisotropic diffusion for image processing was first described by Tschumperle and Deriche [28] as a non-linear process.
The starting point for Tschumperle and Deriche non-linear anisotropic diffusion is the 2 × 2 structure tensor S of the original image [29], whose components for every single pixel can be expressed as
(4)
Sij=μu0μxiu0μxj.
Here u0 denotes the original image, the indexes μ and ν denote the colour channels, and xi and xj denote the two spatial directions. The eigenvalues of the structure tensor S are denoted λ+ and λ, and the corresponding normalised eigenvectors e+ and e are stored as columns in the orthonormal eigenvector matrix V , such that the structure tensor can be written S = V Tdiag(λ+, λ)V  [14]. From this, the diffusion tensor is then defined as
(5)
D=VTdiag (d(λ+),d(λ))V,
where d(λ) is a nonlinear diffusion coefficient function (Eq. (6)) [14] whose task is to suppress the diffusion across the edges while preserving it along the edges,
(6)
d(λ)=11+κλ2
and κ is a suitably chosen numeric constant. Higher values of κ will give more edge preservation in the image.
Having defined the diffusion tensor, D, anisotropic diffusion results from solving the Euler–Lagrange equations for minimising its eigenvalues by gradient descent using the artificial time parameter t (corresponding to the iterations when discretised),
(7)
ut=(Du).
It has been ascertained in various studies (see, e.g., [13]) that the structure tensor, and thus the diffusion tensor, can be computed once and for all from the original image. Then, the diffusion equation, Eq. (7) becomes linear. In the same study, it was also found that the anisotropic diffusion was better than the isotropic one (Perona–Malik-type) for preserving edges and, in particular, corners.
It should be noted that, even after linearisation, the solution of the anisotropic diffusion equation employing iterative gradient descent is, like STRESS, a computationally heavy procedure. The diffusion lengths, and thus the number of iterations needed, are based on the image size, and the diffusion tensor that reduces the diffusion locally increases the need for iterations further.
3.
Proposed Algorithm
We introduce a new model for spatio-temporal image enhancement called STREAD (Spatio-Temporal Retinex-Inspired Envelope with Anisotropic Diffusion). This model is based on the STRESS algorithm, which has a main feature of computing the envelopes Emax and Emin for each channel of the image. However, instead of applying stochastic sampling to obtain Emax and Emin as in STRESS, we use anisotropic diffusion [28]. The second part of the algorithm, i.e., the recomputation of the pixel values based on the computed envelopes, remains unaltered.
3.1
Anisotropic Diffusion for Computing the Envelopes
The envelopes of STRESS are images Emax and Emin with the property that, for each image channel in the original image u0, 0 ≤ Eminu0Emax ≤ 1. The basic idea here, is to use the diffusion tensor of anisotropic diffusion, Eq. (5) to compute alternative versions of the STRESS envelopes. This can be achieved in two different ways. Either, the original image is used as the initial value for both envelopes, or a black image is used as the initial value for the minimum envelope and a white image for the maximum one. In both cases, adding a data attachment term to the diffusion equation will ensure that the envelopes will stay reasonably close to the image. The resulting equations for the envelopes are
(8)
Emaxt=(DEmax)λ(Emaxu0)s.t. Emaxu0
(9)
Emint=(DEmin)λ(Eminu0)s.t. Eminu0.
Normal boundary conditions are applied to the envelopes to make sure that there are no problems when calculating with the pixels at the border of the image. The equations are solved by the explicit Euler method for the time integration, and centred differences for the spatial derivatives. For each iteration, Emax and Emin are constrained so that they are greater than or smaller than the original image, respectively. The envelopes and the original image are finally used to recompute the image exactly as in the original STRESS algorithm.
3.2
Resulting Envelopes
In Fig. 2, the envelopes for STRESS and STREAD are shown. The envelopes contain some of the original image content, always brighter (for Emax) or darker (for Emin), and preserve the edges of the image. A plot of the corresponding scan lines is shown in Figure 3. One can see that the envelopes of STREAD are smoother than those of STRESS, and also that they, in general, are not so close to the original image. This means that STREAD will lead to less dramatic changes of the images. Moreover, both algorithms can follow sharp edges in the image (left part of the graphs). The less sharp transitions for the STREAD envelpes on the right part of the graph can be explained by other image information transversal to the scan line that diffuses into the shown line of the image.
Figure 2.
Envelopes: κ = 1000 for STREAD, M = 3 sampling points for STRESS.
Figure 3.
Scan lines for the envelopes shown in Figure 2.
3.3
Impact of Parameters
As with the STRESS algorithm, the behaviour of STREAD varies with the values of its parameters. The influence of these parameters on the output of the algorithm is explained in detail.
Although both STRESS and STREAD converge to the final solution, iterations in STRESS and STREAD have quite different effects. STRESS iterates the stochastic sampling and computes the average to reduce the sampling chromatic noise, while iterations in STREAD leads to the stationary solution of the constrained PDEs.
The algorithm was tested with N ∈{100,200,300, 400,500,600,700,800,900,1000} iterations. With this test, it was easier to see the influence of higher iterations on the output. In Figure 4 the envelopes are shown for the extreme values of N in this set, and Figure 5 shows the resulting images. The edges are much sharper in the image with the most iterations. One can also notice some artefacts starting to appear near the edges.
Figure 4.
STREAD envelopes for N ∈{100,1000} iterations, κ = 1000.
Figure 5.
STREAD: 100/1000 iterations, κ = 1000.
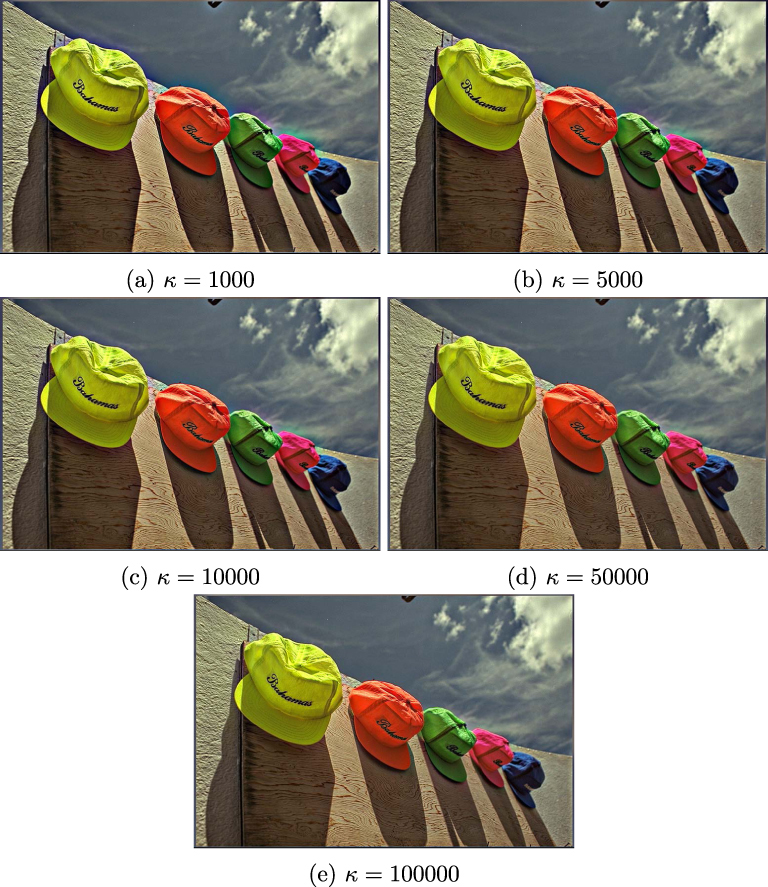
As for the iterations, experiments were performed with κ to determine what value it had to be to give the best output. While testing the highest value for iterations, a value of κ = 1000 was used. When the number of iterations became higher than 700, artefacts like halos started to appear on edges in the image. Results for different values of κ are shown in Figures 6 and 7 for the envelopes and resulting images, respectively. In Fig. 7(a), we can see how the halos appear around the edges in the image (see, e.g., the greenish area in the sky close to the red/pink caps, number four from the left). To counter this, a higher value of κ is needed, since higher values of κ will give more edge preservation in the image. Even with κ = 100000 and N = 1000, some artefacts still appear around some edges, but lower number of iterations does not result in these artefacts. Based on this, κ was set to 10000 and N ∈{300,350,400,450,500,550,600} for the remaing studies.
Figure 6.
Envelopes for κ = 1000 and κ = 100000.
Figure 7.
Images with different values of κ.
Figure 8.
Images with different values of λ and N. κ = 1000, λ ∈{0.01,0.001}, and N ∈{250,500}.
The last variable is λ, which is used to control the strength of the data attachment. The data attachment term λ(uu0) in Eqs. (8) and (9) is a regularisation term that incorporates the prior information about the original image into the enhancement process, and acts as a constraint that minimises the discrepancy between the envelope and the original image [30, 31]. If λ = 0, the envelopes will be flat, resulting in the algorithm becoming spatially independent or global. If λ, the envelopes will be the same as the original image. Results for different values of λ can be seen in Figure 8.
Figure 9 shows a comparison between STREAD and STRESS for different numbers of iterations. It can be seen that STREAD is better at enhancing the vertical lines on the wall. STRESS also amplified the noise present in the more uniform areas.
Figure 9.
Comparison between STREAD and STRESS for different iterations. The images have been cropped to better show differences.
3.4
Colour Balance
One challenge with the preliminary experiments was that while STREAD kept more or less the same colour balance as the original, STRESS made the images a bit brighter and a bit blue, see Figure 11. In order for the images to become more comparable, the last stage of STRESS was modified to counteract this. Two linear scalings for preserving white and gray and a gamma correction for preserving gray were added. The difference between these two can be seen in Figure 10. Linear scaling to preserve gray was chosen, as it was the one that looked most similar to the original and STREAD. The scaling is performed for each channel separately by multiplying the result with the mean of the original image, and then dividing it by the mean of the resulting image. After these preliminary experiments, the final image set was chosen.
Figure 10.
Colour-corrected images for STRESS.
4.
Subjective Experiment
4.1
Comparing STREAD with STRESS
In a preliminary experiment, we compared visually the images resulting from STREAD to those of STRETV [11], and found that the STREAD images were so much better than the STRETV ones, that STRETV was left out of the experiments. The images generated by STREAD and STRESS were compared using a subjective survey and objective image metrics. Initial tests indicated that STREAD performed well with κ = 10000, λ = 0.001 and N ranging from 300 to 600. A sample of 10 standard RGB test images was selected for a paired comparison evaluation. The selected images are standard test images with a good range of different properties in terms of level of detail, contrast, and colours. The original images are shown in Figure 12. Seven pairs (STRESS and STREAD) were computed for each original image, with iterations N ∈{300,350,400,450,500,550,600}. All the resulting images are available as supplementary material.
Figure 11.
Image after STREAD and STRESS.
Figure 12.
Image set used in survey.
QuickEval [32] was used for setting up and running the experiment in the lab. A gray background was used behind the images and a 200 ms delay was added before going to the next image to avoid the memory effect from the previous stimulus. The experiment was run in a controlled room to make sure that there were no other disturbances during the experiment. The computer screen, an Asus PA32UCG with a resolution of 3840×2160, was calibrated using an i1 Display Pro. The colours for the screen were in sRGB and the luminance 300 cd/m2. The distance from the participants was 70 cm, with the room fully lit. The dynamic ranges of the display and the selected images were not so high that glare was a relevant factor.
The experiment was set up on campus and students from the university were picked for the experiment. The students had different academic backgrounds and genders. A total of 22 observers participated in the experiment. The experiment was conducted in two parts. The first part analysed image preference and the second part analysed image noise. For both parts, the observers were given instructions on what to do. For the image noise part, the observers were first shown an image with chromatic noise, Figure 13, to indicate the kind of noise sought. To make sure only results of comparable computational complexity were compared, the participants were shown only the pair of images that had the same number of iterations. So, e.g., STRESS_300 was compared to STREAD_300. The image pairs that were shown had their placement randomized, to avoid bias toward one of the images.
Figure 13.
A comparison of the chromatic noise. STREAD above, STRESS below, cropped and zoomed version on the right.
4.2
Comparing STREAD with the Original Images
To assess how well STREAD performs in comparison with the original images, we set up a pair-comparison experiment where the 10 original images (Fig. 12) were compared to STREAD with 300, 450 and 600 iterations. This resulted in 30 pairs for observers to evaluate, shown in random order. Observers were asked to select the image they preferred. The experiment was carried out using QuickEval [32], as an uncontrolled online experiment. A total of 31 observers participated in the experiment.
5.
Results and Discussion
5.1
Subjective Experiments
The raw data from QuickEval for the image preference part of the subjective experiment is shown in Table I. The table contains the number of times the given image was preferred by the participants. The table is set up such that the image on the y-axis is the one selected. For example, for the Alley image at N = 300 iterations, the STRESS image was selected by 6 observers and the stress image STREAD image by 16. The same data is shown graphically in Figure 14.
Table I.
Raw data for image preference for the individual images (down) and iterations N (across).
300350400450500550600
AlleySTRESS6331323
STREAD16191921192019
CapsSTRESS1012119678
STREAD12101113161514
ChurchSTRESS2233322
STREAD20201919192020
FlowerSTRESS8657433
STREAD14161715181919
OverheadSTRESS4541232
STREAD18171821201920
Red boatSTRESS6434223
STREAD16181918202019
Small alleySTRESS3554423
STREAD19171718182019
SunriseSTRESS2127323
STREAD20212015192019
SunsetSTRESS2275732
STREAD20201517151920
White flowerSTRESS2212433
STREAD20202120181919
Figure 14.
Results from image preference experiment. The bar plot shows the number of times STRESS and STREAD were preferred by the observers for the different images.
To analyse the statistical significance of the results from the experiment, a two-sided binomial test with the null hypothesis H0 : p = 1∕2 was conducted. The resulting p-values for the individual comparisons are given in Table II. Using a threshold of p < 0.05, as shown in the coloured cells of Table II, we can see that many of the results are statistically significant, all in favour of STREAD. Even with thresholds of p < 0.01 and p < 0.001, many results are still significant. Even though not all the individual comparisons are statistically significant, it should be noted that there is not one single occurrence of a statistically significant preference of STRESS over STREAD.
Table II.
p-values for image preference with individual images (across) and iterations N (down). White: p ≥ 0.05, yellow: 0.05 > p ≥ 0.01, green: 0.01 > p ≥ 0.001, blue: p < 0.001.
Combining all iterations for STREAD and STRESS for each image, the binomial test gives the p-values shown in Table III. Here we see that the p-values are so small that we can easily draw conclusions about which algorithm is best for image preference. Finally, a last binomial test was done on all STREAD versus all STRESS images, resulting in a p-value p = 5.5 × 10−153.
Table III.
p-values for each image across iterations.
Alley4.2 × 10−21
Caps2.9 × 10−2
Church1.7 × 10−24
Flower2.2 × 10−11
Overhead4.2 × 10−21
Red boat8.2 × 10−19
Small alley2.2 × 10−17
Sunrise6.5 × 10−22
Sunset4.8 × 10−16
White flower1.7 × 10−24
The raw data from QuickEval for the subjective experiment on resulting image noise is shown in Table IV. It is set up similar to Table I, and shows the number of times one image was perceived to be more noisy than the other. The corresponding graphical representation is shown in Figure 15. A brief look at the table shows us that the images created with STRESS are selected by far the most, and in some cases, they are the only one selected.
Table IV.
Raw data for image noise for the individual images (down) and iterations N (across).
300350400450500550600
AlleySTRESS21212018181719
STREAD1124453
CapsSTRESS21212020192020
STREAD1122322
ChurchSTRESS22222222222222
STREAD0000000
FlowerSTRESS21212020212120
STREAD1122112
OverheadSTRESS20192017212118
STREAD2325114
Red boatSTRESS21222120192220
STREAD1012302
Small alleySTRESS19211818171817
STREAD3144545
SunriseSTRESS22212119221919
STREAD0113033
SunsetSTRESS22222222182221
STREAD0000401
White flowerSTRESS22222220222122
STREAD0002010
Figure 15.
Results from image noise experiment. The bar plot shows the number of times STRESS and STREAD were selected to have higher noise by the observers for the different images.
The trend is even more pronounced than for the image preference, which is also confirmed by the individual p-values for the binomial tests shown in Table VI. Contrary to the image preference, there is no p-value for this test that has a value larger than 0.05. Using a threshold of p < 0.05, the coloured cells, we can infer that the result is statistically significant. However, when performing so many statistical tests from the same data, a Bonferroni correction should be applied, leading to a lower p-value threshold. Even with stricter thresholds of p < 0.01 and p < 0.001, the results are still robust. A binomial test was also conducted on all iterations for STREAD and STRESS for each image, and the results are displayed in Table V. Here, we observe that the p-values are so small that we can confidently conclude which algorithm is superior for image preference. Finally, a binomial test was carried out on all STREAD versus all STRESS images, which yielded a p-value of p = 8.99 × 10−288.
Table V.
p-values for image preference with individual images (across) and iterations N (down). White: p ≥ 0.05, yellow: 0.05 > p ≥ 0.01, green: 0.01 > p ≥ 0.001, blue: p < 0.001.
Table VI.
p-values for each image across iterations.
Alley6.5 × 10−22
Caps2.5 × 10−28
Church8.8 × 10−47
Flower1.4 × 10−31
Overhead1.3 × 10−23
Red boat9.9 × 10−33
Small alley2.2 × 10−17
Sunrise1.9 × 10−30
Sunset6.1 × 10−38
White flower5.3 × 10−41
Comparison of STREAD with the original images is shown in Table VII, where the number of times STREAD or the original is preferred is shown. This reveals that overall for the 10 images, STREAD is, according to a binomial test, significantly better than the original (p = 1.73 × 10⁻⁷). Conducting the binomial test on 300, 450 and 600 iterations gives a similar conclusion, being statistically significant at p < 0.05 for all p-values are p = 0.0005, p = 0.0007, and p = 0.0354 for 300, 450 and 600 iterations, respectively. We can notice that with higher iterations, the preference towards the original is increasing slightly. Analysis of the images reveals that in 7 images STREAD has a higher number than the original and lower in 3 images (Alley, Sunrise, and White flower). This can indicate that content plays a role.
Table VII.
Raw data for image preference for the individual images (down) and iterations N (across) for STREAD compared to the original. A total of 31 observers participated in the experiment.
300450600Sum
AlleyOriginal21222366
STREAD109827
CapsOriginal13111145
STREAD18202058
ChurchOriginal1291132
STREAD19222061
FlowerOriginal1091130
STREAD21222063
OverheadOriginal8121232
STREAD23191961
Red boatOriginal99927
STREAD22222266
Small alleyOriginal97824
STREAD22242369
SunriseOriginal14181547
STREAD17131646
SunsetOriginal981128
STREAD22232065
White flowerOriginal19202564
STREAD1211629
SumOriginal124125136385
STREAD186185174545
5.2
Objective Image Metrics
We evaluated the performance of the suggested STREAD and compared it to STRESS using objective metrics. The Visual-Signal-to-Noise-Ratio (VSNR) [33] is a full-reference metric for the detection of distortions in natural images; this is done by using contrast thresholds and visual masking to determine if the distortion is visible. VSNR is therefore a good metric to compare visible distortions in STREAD and STRESS. Default parameters for VSNR are used, these being Alpha = 0.04 and viewing parameters equal to b = 0, k = 0.02874, g = 2.2, r = 138, v = 27.5, num_levels = 5 and filter_gains =2.̂ (1:num_levels) The second metric is the no-reference Natural Image Quality Evaluator (NIQE) [34], which is a no-reference metric based on analysis of statistical features from natural scene statistics and correlates well with subjective scores on various distortions, including noise [35]. For NIQE, we calculate the results for each colour channel and average them. The last objective metric is a contrast metric, the RSC [36] which is a weighted multilevel contrast metric. For RSC, we have used the optimal parameters from Simone et al. [36]. We calculate the difference in contrast between the contrast enhanced images and the original image, so a higher value will indicate increased contrast and a lower value indicates decreased contrast compared to the original.
The results for VSNR, NIQE, and RSC are shown in Figure 16. Higher VSNR values are better, given in dB in the range 0 - Inf, while for NIQE, lower values are better, where it has been found that values higher than 40 rarely occur [37]. We see that for VSNR, all values for STREAD are higher than STRESS, while for NIQE, all values for STREAD are lower than STRESS. For all images, VSNR indicates that STREAD has less visible distortions compared to STRESS. It can also be seen that the difference between STREAD and STRESS is image-dependent, and consistent with the results from the subjective experiment. For the contrast metric RSC, we notice that increasing the number of iterations produces images with higher contrast compared to the original. The exception is the image Church, where the STREAD algorithm produces very uniform areas without noise, which lowers the local contrast and therefore leads to a lower RSC value. It can also be seen that STRESS produces higher RSC values, which is partly due to the global contrast change because of the colour shift in STRESS.
Figure 16.
VSNR (top), NIQE (middle) and RSC (bottom) for the 10 images. For VSNR, higher values are better; for NIQE, lower values are better; and for RSC, higher values indicate higher contrast than the original. We can see that for VSNR and NIQE, the proposed STREAD in all images has better values compared to STRESS. For 9 out of the 10 images, STREAD produces images with higher contrast. Colour in the legend indicates the number of iterations.
To supplement the analysis, we have also calculated the difference between the original and the enhanced images. This has been done by taking the normalized sum of the absolute difference between the original and enhanced images for each pixel for both STREAD and STRESS. We visualize the results for the church image with 600 iterations in Figure 17. It can be seen that the higher differences that STRESS produces in the sky, the noise increases. The result for the caps image is shown for 400 iterations in Figure 18. We can notice the same observation regarding noise in the sky for STRESS, and that STREAD, in general, makes fewer changes to the images and treats the image more locally. STRESS increases the edge of the shadows of the caps, while STREAD can also enhance the areas between the shadows.
Figure 17.
The difference between the original and enhanced images for each pixel for the church image, with 600 iterations for each method.
Figure 18.
The difference between the original and enhanced images for each pixel for the caps image, with 400 iterations for each method.
6.
Conclusion
We have proposed an alternative algorithm for computing the envelopes of the STRESS algorithm using linear anisotropic diffusion, leading to the STREAD algorithm. The main goal of the transition was to reduce the chromatic noise and thus increase the overall image preference. Both subjective experiments and objective image metrics show that both of these goals were achieved with the new approach, and that the STREAD images were preferred over both STRESS images and the originals with statistical significance.
Acknowledgment
This research was funded by the Research Council of Norway over the project “Individualised Colour Vision-based Image Optimisation”, Grant No. 287209.
References
1LandE. H.The retinexAmerican Scientist1965Vol. 52WileyHoboken, NJ247264247–64
2LandE. H.MccannJ. J.1971Lightness and retinex theoryJ. Opt. Soc. Am.611111–1110.1364/JOSA.61.000001
3LandE. H.1977The Retinex Theory of Color VisionSci. Am.237108129108–2910.1038/scientificamerican1277-108ISSN: 00368733, 19467087 http://www.jstor.org/stable/24953876 (visited on 22/05/2023)
4McCannJ. J.RizziA.The Art and Science of HDR Imaging2011John Wiley & SonsNew York
5PariharA. S.SinghK.A study on Retinex based method for image enhancement2018 2nd Int’l. Conf. on Inventive Systems and Control (ICISC)2018IEEEPiscataway, NJ619624619–2410.1109/ICISC.2018.8398874
6BaslamisliA. S.LeH.-A.GeversT.CNN based learning using reflection and retinex models for intrinsic image decompositionProc. IEEE Conf. on Computer Vision and Pattern Recognition2018IEEEPiscataway, NJ667466836674–83
7WeiC.WangW.YangW.LiuJ.Deep retinex decomposition for low-light enhancementBritish Machine Vision Conf. 2018201810.48550/arXiv.1808.04560
8LiangJ.XuY.QuanY.WangJ.LingH.JiH.“Deep bilateral retinex for low-light image enhancement,” Preprint, arXiv:2007.02018 (2020)
9KolásØ.FarupI.RizziA.2011Spatio-temporal retinex-inspired envelope with stochastic sampling: A framework for spatial color algorithmsJ. Imaging Sci. Technol.55040503-1040503-10040503-1–040503-1010.2352/J.ImagingSci.Technol.2011.55.4.040503
10ProvenziE.FierroM.RizziA.CarliL. D.GadiaD.MariniD.2007Random spray retinex: A new retinex implementation to investigate the local properties of the modelIEEE Trans. Image Process.16162171162–7110.1109/TIP.2006.884946
11SimoneG.FarupI.Spatio-temporal retinex-like envelope with total variation6th European Conf. on Colour in Graphics, Imaging, and Vision (CGIV)2012AmsterdamThe Netherlands176181176–81
12GianiniG.RizziA.DamianiE.2016A retinex model based on absorbing markov chainsInf. Sci.327149174149–7410.1016/j.ins.2015.08.015
13ThomasJ.-B.FarupI.2018Demosaicing of periodic and random color filter arrays by linear anisotropic diffusionJ. Imaging Sci. Technol.6250401-110.2352/J.ImagingSci.Technol.2018.62.5.050401
14FarupI.2020Individualised halo-free gradient-domain colour image daltonisationJ. Imaging611610.3390/jimaging6110116
15FrankleJ. A.McCannJ. J.“Method and apparatus for lightness imaging,” US Patent 4,384,336 (1983)
16MariniD.RizziA.2000A computational approach to color adaptation effectsImage Vis. Comput.18100510141005–1410.1016/S0262-8856(00)00037-8
17RizziA.MariniD.CarliL. D.2002LUT and multilevel Brownian Retinex colour correctionMach. Graphics Vis. Int. J.11153168153–68
18McCannJ. J.2004Capturing a black cat in shade: Past and present of Retinex color appearance modelsJ. Electron. Imaging13364736–4710.1117/1.1635831
19CooperT. J.BaqaiF. A.2004Analysis and extensions of the Frankle-McCann Retinex algorithmJ. Electron. Imaging13859285–9210.1117/1.1636182
20FinlaysonG. D.HordleyS. D.DrewM. S.Removing shadows from imagesProc. 7th European Conf. on Computer Vision2002SpringerBerlin823836823–3610.1007/3-540-47979-1_55
21MontagnaR.FinlaysonG. D.2011Constrained pseudo-Brownian motion and its application to image enhancementJ. Opt. Soc. Am. A28167716881677–8810.1364/JOSAA.28.001677
22JobsonD. J.RahmanZ.-u.WoodellG. A.1997Properties and performance of a center/surround retinexIEEE Trans. Image Process.6451462451–6210.1109/83.557356
23BarnardK.FuntB.Investigations into multi-scale retinexProc. Colour Imaging in Multimedia’9819989179–17
24HuckF. O.FalesC. L.DavisR. E.Alter-GartenbergR.2000Visual communication with retinex codingAppl. Opt.39171117301711–3010.1364/AO.39.001711
25CowanJ. D.BressloffP. C.2002Visual cortex and the Retinex algorithmProc. SPIE4662278285278–85
26RahmanZ.-u.JobsonD. J.WoodellG. A.2004Retinex processing for automatic image enhancementJ. Electron. imaging13100110100–1010.1117/1.1636183
27PeronaP.MalikJ.1990Scale-space and edge detection using anisotropic diffusionIEEE Trans. Pattern Anal. Mach. Intell.12629639629–3910.1109/34.56205
28TschumperleD.DericheR.2005Vector-valued image regularization with PDEs: A common framework for different applicationsIEEE Trans. Pattern Anal. Mach. Intell.27506517506–1710.1109/TPAMI.2005.87
29Di ZenzoS.1986A note on the gradient of a multi-imageComput. Vis. Graph. Image Process.33116125116–2510.1016/0734-189X(86)90223-9 https://www.sciencedirect.com/science/article/pii/0734189X86902239
30RombachR.BlattmannA.LorenzD.EsserP.OmmerB.High-resolution image synthesis with latent diffusion models2022 IEEE/CVF Conf. on Computer Vision and Pattern Recognition (CVPR)2022IEEEPiscataway, NJ10.1109/CVPR52688.2022.01042
31XiaB.ZhangY.WangS.WangY.WuX.TianY.YangW.GoolL. V.DiffIR: Efficient diffusion model for image restorationProc. IEEE/CVF Int’l. Conf. on Computer Vision (ICCV)202310.48550/arXiv.2303.09472
32NgoK. V.DokkebergC. A.FarupI.PedersenM.2015Quickeval: A web application for psychometric scaling experimentsProc. SPIE9396212224212–24
33ChandlerD. M.HemamiS. S.2007VSNR: A wavelet-based visual signal-to-noise ratio for natural imagesIEEE Trans. Image Process.16228422982284–9810.1109/TIP.2007.901820
34VenkatanathN.PraneethD.BhM. C.ChannappayyaS. S.MedasaniS. S.Blind image quality evaluation using perception based features2015 21st National Conf. on Communications (NCC)2015IEEEPiscataway, NJ161–610.1109/NCC.2015.7084843
35MittalA.SoundararajanR.BovikA. C.Making a “completely blind” image quality analyzerIEEE Signal Processing Letters2012Vol. 20IEEEPiscataway, NJ209212209–1210.1109/LSP.2012.2227726
36SimoneG.PedersenM.HardebergJ. Y.2012Measuring perceptual contrast in digital imagesJ. Vis. Commun. Image Represent.23491506491–50610.1016/j.jvcir.2012.01.008
37ZvezdakovaA.KulikovD.KondraninD.VatolinD.Barriers towards no-reference metrics application to compressed video quality analysis: On the example of no-reference metric NIQE29th Int’l. Conf. on Computer Graphics and Vision, CEUR Workshop Proc.2019RWTHAachen222722–710.48550/arXiv.1907.03842