Back to articles
Work Presented at Electronic Imaging 2024
Volume: 67 | Article ID: 060406
Image
Kiviat Defense: An Empirical Evaluation of Visual Encoding Effectiveness in Multivariate Data Similarity Detection
  DOI :  10.2352/J.ImagingSci.Technol.2023.67.6.060406  Published OnlineNovember 2023
Abstract
Abstract

Similarity detection seeks to identify similar, but distinct items over multivariate datasets. Often, similarity cannot be defined computationally, leading to a need for visual analysis, such as in cases with ensemble, computational, patient cohort, or geospatial data. In this work, we empirically evaluate the effectiveness of common visual encodings for multivariate data in the context of visual similarity detection. We conducted a user study with 40 participants to measure similarity detection performance and response time under moderate scale (16 items) and large scale (36 items). Our analysis shows that there are significant differences in performance between encodings, especially as the number of items increases. Surprisingly, we found that juxtaposed star plots outperformed superposed parallel coordinate plots. Furthermore, color-cues significantly improved response time, and attenuated error at larger scales. In contrast to existing guidelines, we found that filled star plots (Kiviats) outperformed other encodings in terms of scalability and error.

Supplementary Material
Subject Areas :
Views 47
Downloads 11
 articleview.views 47
 articleview.downloads 11
  Cite this article 

Mirko Mantovani, Andrew Wentzel, Juan Trelles Trabucco, Joseph Michaelis, G. Elisabeta Marai, "Kiviat Defense: An Empirical Evaluation of Visual Encoding Effectiveness in Multivariate Data Similarity Detectionin Journal of Imaging Science and Technology,  2023,  pp 1 - 13,  https://doi.org/10.2352/J.ImagingSci.Technol.2023.67.6.060406

 Copy citation
  Copyright statement 
Copyright © Society for Imaging Science and Technology 2023
 Open access
  Article timeline 
  • received July 2023
  • accepted December 2023
  • PublishedNovember 2023
jist
JIMTE6
Journal of Imaging Science and Technology
J. Imaging Sci. Technol.
1062-3701
1943-3522
Society for Imaging Science and Technology
1.
Introduction
Similarity detection seeks to identify items which resemble other items without being identical to them, sometimes over collections of multivariate items. Detecting similarity is an intrinsic part of comparison, along with judging dissimilarity or differences between items. However, comparison is oftentimes a detailed, precise, finely tuned operation using specific channels such as size. Furthermore, comparison is usually performed in a one-to-one setting, where two items are placed side-by-side and compared pairwise. In contrast, similarity detection over moderate or large collections of items often involves a simultaneous, fast, coarse assessment of multiple items at the same time, where the items are characterized by multiple variables.
Interestingly, similarity cannot always be defined computationally in a dataset; for example, when the weights of the different features of the items with respect to similarity are yet to be determined. These situations lead to a need for visual analysis. Visualization allows direct interaction with the user, and user steering of the analysis process, which is hard to achieve through non-visual means. Such situations arise commonly in the analysis of ensemble simulations [1], multiple computational models [2, 3], patient data repositories [46], geospatial data [7], computer networks [8, 9], and sports games [10]. In these common practical instances, the collection of items to analyze is typically of moderate size: most of these datasets feature dozens of items [1, 11], but not hundreds, and the data items are multivariate [1, 4, 5], but not necessarily high-dimensional.
From a visual analysis perspective, the design space explored by practitioners for encoding similarity is surprisingly narrow. One option is using, whenever possible, relative position to encode similarity, based on Gestalt and visual-cue perception theory [12, 13]; items grouped together in space are also perceived as more similar to each other than items outside the group [14, 15]. However, the use of spatial position is not always possible, for example, when the data itself is spatial in nature. When the use of spatial position to encode similarity is not feasible, the multivariate items to be visually analyzed are typically encoded as superposed (overlaid) multivariate encodings, such as parallel coordinate plots. A common variation of this option is the use of radial axes, such as overlaid star plots, despite a contrary body of evidence in the literature and popular culture that indicates radial layouts are less legible than linear layouts [13, 16, 17]. As these superposed representations suffer from clutter, they are often augmented with color-cues and interaction. Last but not least, when screen real estate is available, a third option is encoding the items as juxtaposed (i.e., next to each other) glyphs.
Whereas these alternative approaches for representing multivariate data have been studied in the context of various specific tasks (relationship, composition, distribution, one-on-one comparison), there is no rigorous evaluation as to which encoding, or even what layout paradigm is better for similarity detection over multivariate data involving several items. For example, parallel coordinate plots are known to be effective in detecting correlation between neighboring axes when showing hundreds of items [13], but there is no equivalent knowledge on their performance in similarity detection. We note that similarity detection seeks to identify similar, but distinct items over multivariate datasets. In contrast, correlation detection is the process of establishing a relationship or connection between two or more variables (or measures), although the strength of positive correlation can indicate similarity of multivariate items. Likewise, several variations of juxtaposed radial layouts have been examined in the context of one-on-one similarity detection, where lines-only star glyphs, which encode variables using radial axis lengths, have been found to be superior to star glyphs using an enclosed polygon [18]. However, it is not clear whether those findings generalize to multiple items similarity detection. We furthermore do not know what is the impact of color-cues on encoding effectiveness. Additionally, recent studies [19, 20] have re-examined, in a part-to-whole context, the value of radial layouts versus linear layouts, with surprising results. Furthermore, we do not know if or how the effectiveness of a specific encoding may scale with the number of items. Anecdotally, in our own lab, we have also witnessed passionate disputes between visiting visualization researchers (against) and application domain experts (pro) regarding the use of Kiviat diagrams (a juxtaposed radial glyph) to help detect similarity.
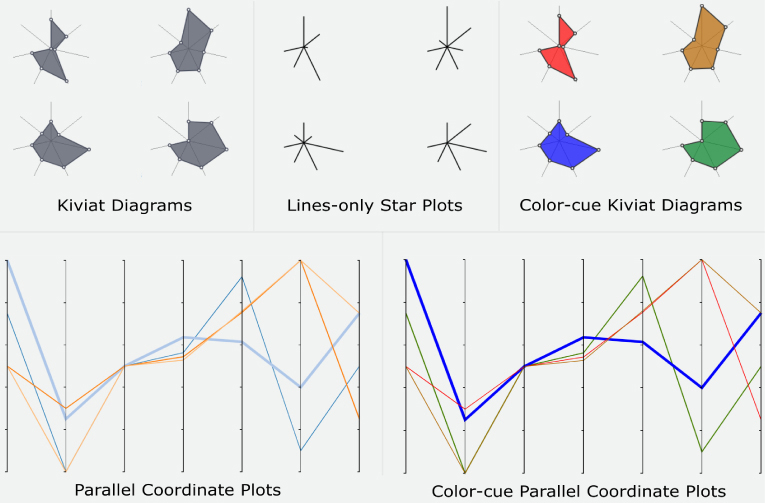
To help elucidate these issues, and motivated by these disputes, we conducted an exploratory empirical evaluation with 40 participants. We measured similarity detection accuracy and response time under two conditions; 16 items (moderate scale) and 36 items (large scale). We approached this problem by examining variants of several encodings commonly used in similarity detection; lines-only glyphs, Kiviat diagrams, and parallel coordinate plots (Figure 1). Our statistical analysis shows that there are significant differences in encoding performance, especially in the large-scale setting of the experiment.
Figure 1.
Similarity detection over multivariate data using five visual encodings (clockwise order from top left): Kiviat diagrams, Lines-only glyphs, Color-cue Kiviat diagrams, Parallel coordinate plots, and Color-cue parallel coordinate plots. In these experiments, star-glyph variants use a juxtaposed layout, whereas parallel coordinate plot variants use superposition.
2.
Related Work
2.1
Visual Encodings for Multivariate Data
Chan et al. [21] have identified a taxonomy of four broad categories for visualizing multivariate data; pixel-oriented techniques, hierarchical display, geometric projection, and iconography. Before discussing the use of these representations in similarity detection, let us briefly examine these classes.
Pixel-based techniques represent individual attributes via various color schemes. The most popular of these are stacked bar-chart variants, as well as lesser-known methods such as trend images [22, 23], or pixel-oriented dense visual encodings [24]. However, these techniques require the existence of a known similarity measure item dimensions, not items, in order to create the pixel layout. Without this optimization, the representation quickly becomes noise [25]. Likewise, hierarchical methods such as treemaps and dimensional stacking [21] are appropriate for hierarchical structures, but are not a good fit with similarity detection when that hierarchical structure does not exist and it is not introduced as part of the computational analysis process [26].
Projection-based methods attempt to map the higher-dimensional space into a lower dimensional space. These methods are typically considered a good choice for identifying correlations, and scale well with large datasets. These methods are most often variants of scatter plots or parallel coordinate plots (PCPs). Whereas scatter plots do not scale to support multi-dimensional individual item analysis and comparison, PCPs and their variations allow individual items to be displayed as a continuous contour across multiple dimensions, making PCPs a popular encoding used for identifying similar data points.
Finally, in iconography, items are shown as glyphs. A glyph is the visual representation of a data item where the attributes of a graphic entity are dictated by one or more attributes of a data [15]. Glyph-based methods are well-suited for similarity detection, as visual feature similarity can map directly to numerical similarity.
2.2
Using Position to Encode Similarity
Lee et al. [14] evaluated the effectiveness of four different visual encodings when conveying similarity information in multivariate data, and found that encodings which used spatial arrangement of the items yielded faster and more accurate answers. Likewise, Borgo et al. [15] indicate that elements arranged on a line or curve are perceived to be more related than elements not on the line or curve. To take advantage of these principles, similar multivariate item representations over large datasets can be placed in close proximity in a 2D space, for example via techniques such as lower-dimensional embeddings. However, it is not always possible to encode similarity using position when the data itself is spatial in nature—for example, when the representations are anchored to zipcodes on city maps or to anatomical locations in medical visualization [27]. Furthermore, dimensionality reduction or aggregation are not always acceptable, for example, in algorithm explainability [28]. Finally, similarity may not always be computed a priori, as in our driving examples from ensemble simulations, or in the analysis of multiple computational models.
2.3
Similarity Detection: Juxtaposed Glyph Encodings
When relative location cannot be used as an indicator of similarity, multivariate data-points are oftentimes encoded by glyphs placed side by side, i.e., juxtaposed [29], or at discrete locations. Juxtaposed glyphs may support similarity detection through icon attributes such as shape, colors, texture and so on [30]. One of the earliest proposed glyphs are Chernoff faces [31], where the different parts of a conceptualized human face (mouth, nose, etc.) encode different dimensions of an multidimensional data set.
Given their small graphic footprint, radial layout glyphs, including juxtaposed star plots and their variations, are also frequently used [32]. Fuchs et al. [33] systematically reviewed 64 user-study papers on glyphs, many of which compare the performance of different types of glyphs when dealing with similarity or comparison tasks, including Borg and Staufenbiel’s study of snow flake and sun glyph performance [34]. Star plots and their variations, in particular, were found to be effective, although a multitude of studies have tried to understand if the ordering of the axes in the glyphs has any impact on their performance [35, 36]. Furthermore, Fuchs et al. [18] studied how contours in star plots influence similarity perception. Their results showed that the “Data Lines Only” variation of the star plot, which does not include a glyph contour, performed best. However, their study only considered a 3 × 3 grid placement of the glyphs, with the target in center, whereas, potential matches surrounded the target. This setting is not realistic for similarity detection over larger collections of multivariate data.
Keim [37] categorized different types of visual encodings for multidimensional data, including icon-based (e.g., Chernoff faces, stick figures [38]), or pixel-oriented. Keim and Kriegel later carried out an experiment [25] to assess the performance of charts for visual data mining tasks, including finding groups of similar data, finding correlations between attributes, and similarity retrieval. They specifically designed a pixel-oriented technique, which was able to represent as many items as possible in the same display, and compared it to classical approaches such as parallel coordinate plot and stick figure techniques. They concluded that the pixel-oriented approach they developed was superior with respect to standard techniques when trying to visualize thousands of items of data, subject to the window size and data limitations discussed in the earlier subsection. However, pixel-oriented representations require optimization of the layout based on an existing similarity measure among the item dimensions.
2.4
Similarity Detection: Superposed Encodings
PCPs and their older variation, nomograms [4] are superposed encodings [29] that assign variables to parallel axes, and overlay multiple items. Due to their scalability and ability to deal with many dimensions, these encodings are often used to explore variable correlation or similarity [3942]. PCPs are effective for the exploration of hundreds to thousands of items [13]. However, Keim and Kriegel [25] posit that on a set of thousands of data items, a pixel-oriented encoding outperformed PCPs. Radar charts or star plots can also be superposed for the exploration of a large number of items.
3.
Methods
3.1
Experimental Design
This study has a well-defined scope, motivated by practice in visual analysis. We focus on analyzing the efficiency of commonly used visual encodings in a multidimensional similarity detection task. Given a target item, we seek to determine whether the chosen visual encoding affects the ability of a person to identify the most similar items in a set of candidate items. In this context, we first explore the effectiveness of several commonly-used encodings, and the influence of dataset scale over encoding effectiveness. In a secondary analysis, we explore the influence of color-cue use.
3.1.1
Encodings Selection
We begin by noting that the juxtaposed and superposed terminology originates from Gleicher’s theoretical framework for visual comparison [29], which distinguishes comparison methods along juxtaposition, superimposition, and explicit difference encoding. The juxtaposed and superposed terminology is also appropriate in similarity detection, although explicit difference encoding does not carry over to multiple item similarity detection beyond, arguably, the simple use of color-cues. However, comparison methods and visual encodings are not independent design variables. For example, all parallel coordinate plots are superposed. Likewise, all traditional star plots, including transparent radar charts, use a radial layout and can be used as superposed encodings. At the same time, several encodings related to star plots, including lines-only glyphs and Kiviat diagrams, are always juxtaposed encodings. Thus, the specific visual encodings and comparison methods are not independent variables, and should not be analyzed as separate dimensions. In this study, we focus on visual encoding effectiveness.
We then consider the space of appropriate visual encodings, according to visualization theory, as well as the encodings used in similarity detection practice. Overall, we selected our encodings set based on the following criteria:
Popularity:
We chose encodings, which are commonly used in the visual analytics literature and can be implemented with common data visualization software. Linear and radial plots are common in many popular software packages, while more esoteric encodings such as many pixel-based methods or Chernov faces are not, making the usability of findings related to those methods of limited use.
Losslessness:
Because visual similarity detection is typically used when no computable similarity measure is available, it is important to be able to quantify when important information is reduced away. Therefore, we avoided lossy data encodings, such as dimensionality reduction techniques and normalized bar charts.
Footprint Scalability:
We included visual encodings whose footprint scales at most linearly with either the number of items or dimensions, as opposed to methods such as scatterplot matrices that require a quadratically scaling number of plots.
Coverage:
We included encodings that cover both juxtaposition and superposition paradigms, as well as schemes with and without color-cues.
Parsimony:
We included a representative and reasonable set of encodings and scales, that allow us to better understand scale issues in similarity detection without undue hardship to the user. This criterion allows us to circumvent the need to factor user fatigue.
From the possible space of multivariate encodings, as indicated earlier, pixel-based techniques and hierarchical displays are not a good fit with encoding several possible independent variables. We therefore did not pursue this category of encodings.
Next, we considered projection-based encodings. PCPs, including their radial variations, allow individual items to be displayed across multiple dimensions, and have been found to be superior in visualizing clusters than other projection based methods [43], making them a good candidate for similarity detection. Whereas, parallel coordinate plots are not anchored to a spatial location, in practice they can be linked to specific item spatial locations via brushing and linking across coordinated views. We include two variants of this encoding in our study.
Under the parsimony criterion, because overlaid star plots are also used in visualization practice, we performed a calibration pilot usability study (five participants, 12 trials per participant) in order to assess the overlaid star plot potential as a similarity detection encoding, compared to that of linear parallel coordinate plots. The pilot results agreed with the existing literature [13, 16]. We also found that parallel coordinate plots outperformed slightly overlaid star plots, and that the similarity detection tasks took significantly more time to complete in the overlaid radial layout (22% error increase and 49% more time in the larger setting). In consequence, overlaid star plots were not included in the final experiment.
Last, we considered the space of glyph-based representations. Under the popularity and parsimony criteria, we excluded from our study esoteric methods such as Chernov faces or stick figures [38]. Furthermore, with respect to juxtaposed star glyph variants, the Fuchs et al. [18] study had found that lines-only star glyphs outperformed polygon-outline-only glyphs. In consequence, in our study we excluded polygon-outline-only glyphs. In the similarity detection literature, we furthermore noted the use of Kiviat diagrams [4, 5, 44], a glyph encoding related to star plots. Often confused with star plots or radar charts, this diagram is a radial glyph introduced in 1974 [45], where, as in standard star plots, each radial axis represents a variable and the position along the axis encodes the quantitative value. However, in a Kiviat diagram the resulting contour is filled with solid color. Kiviat diagrams are thus a type of glyph and are typically juxtaposed. We included Kiviat glyphs, along with line-only glyphs.
We note that our resulting encoding selection closely reflects the encodings used in current practice of similarity detection [110]. Overall, we considered 3 base encodings. In a secondary analysis, we included 2 color-cue variations as well. These encodings include methods that rely on the juxtaposition paradigm (Kiviat and line-only glyphs), where the encodings are laid out at specific locations, as well as methods that rely on a superposition paradigm (PCPs), where visual marks for the items are superimposed on top of each other. The encodings we studied are:
Parallel coordinate plots (PCPs). Because in a pilot test unicolor polylines were not distinguishable without interacting with each polyline, each line was colored, based on a categorical color scheme, and testers could use interactive brushing to highlight a particular polyline. The target item was represented using higher thickness to make it more visible. We further allowed the user to filter items by selecting sub-sections of different axes and to highlight items by increasing their line thickness when moused-over.
Lines-only star plots (LSP). These plots are a glyph variant of the star plot with only the radial segments extending from the center, and no filled contour. These plots have also been referred to as whisker plots or fan plots [18].
Kiviat diagrams, a glyph variant of star plots. Traditionally, a contour is formed by connecting the quantity marks along each radial axis. In our default Kiviat diagram, the contour was filled in with a neutral gray.
Color-cue Kiviat diagrams (CCue Kiviat). This encoding is a variation of the Kiviat diagram, in which the glyph polygon is filled with color. In the practitioner literature, the Kiviat color is typically mapped to an attribute of that item. To test whether Kiviat color could be interpreted as a similarity cue, we deliberately mapped color to our simulated ground truth similarity measure instead. We deliberately did not inform the users that color was mapped to a simulated measure of similarity. We used a divergent red-green-blue color scheme from ColorBrewer2 [46], where red indicated completely dissimilar items, and blue indicated identical items.
Color-cue parallel coordinate plots (CCue PCP). This encoding is a variation of the PCPs, in which polylines are colored, as in the color-cue Kiviats above, based on their similarity with the target polyline. Testers could use interactive brushing to highlight a particular polyline. Again, we deliberately did not inform the testers that color was mapped to our simulated measure of similarity.
3.1.2
Dimensions and Scalability with Number of Items
Next, we considered the number of data dimensions and the number of items to show during the study. Because the common instances of the similarity detection problem feature multi-dimensional, but not highly-dimensional data; we considered the number of dimensions reported in the existing literature related to similarity detection. Juxtaposed star plots are typically used in similarity detection for data with five to seven dimensions in real datasets [1, 4, 5], and up to ten dimensions in synthetically-generated user study datasets [18]. Given these considerations, and the value of real visual analytics data and scenarios, we selected a real dataset with seven dimensions rather than a synthetic dataset for our experiments. To simulate realistic charts for our study, we used an anonymized cancer dataset of 1100 patients with seven features of interest [4]. The dataset included a mixture of continuous and categorical variables with 2–4 categories, which were treated as ordinal variables that were uniformly distributed between 0 and 1. Continuous variables were individually scaled to be between 0 and 1. Values or axis labels were not shown.
In our study, we additionally tested the effect that scale had on the encoding effectiveness, where scale refers to the number of items on the screen during an individual comparison task. Because the common instances of the similarity detection problem typically feature dozens, but not hundred of items [1, 11], we decided to examine two different scale factors; a moderate scale, with 16 total items, and a large scale, with 36 total items, including the target item. These factors ensured easily legible renditions of all our visual encodings, whether juxtaposed or overlaid, on a 15.4 inch laptop display, similar to the displays routinely used by our collaborators across disciplines (Figure 2).
Figure 2.
Experimental setup for user study protocol. From left to right: (a) 36-item trial with Kiviat encodings, with the target item identified via its ID in the top-screen message; (b) item selection in a 16-item trial with Kiviat encodings, with the currently selected item highlighted; (c) 16-item trial with PCP encodings, with the target item identified via a thicker mark; (d) 16-item trial with PCP encodings, with the currently selected item highlighted.
In total, five encodings were tested at two different scales, resulting in 10 total trials per participant, excluding introductory practice tests.
3.2
Hypotheses
We identified and tested four main hypotheses, based on previous findings reported in the literature [18] and on practical visual analytics experience:
H1.
At moderate scale (16 items), all encodings studied will yield equivalent scores.
H2.
At large scale (36 items), juxtaposed encodings will outperform superposed encodings with respect to score.
H3.
At large scale (36 items), LSPs will outperform other encodings with respect to score.
H4.
At both scales, color-cue encodings will outperform other encodings with respect to time, but not score.
3.3
Participants and Protocol
We recruited 40 volunteers (12 females, 28 males, age between 18 and 59 years) from our university campus, following institutional review board (IRB) approval. One participant disclosed a color-vision issue, but was able to complete the tasks adequately. Participants had a variety of expertise with data visualization (2 novices, 13 with basic familiarity, 14 familiar and 11 experts). The familiar- and expert-level participants had experience with both glyphs and PCPs, although they did not use visual encodings to analyze data in daily activities. They also had diverse educational backgrounds (5 with a high school degree, 23 with a Bachelor’s, 10 with a Master’s and 2 with a PhD). No monetary or material incentives were given.
3.3.1
Protocol
We designed a similarity detection task to evaluate our hypotheses. For each different type of visual encoding and color variant, we showed seven variables of either 16 (moderate scale) or 36 (large scale) items. The items were randomly sampled from the patient dataset, to ensure adequate case coverage. In each trial, we asked the participant to select, in order, the top three items most similar to a specified target item in the display. We selected two grid arrangements to test the scalability of the encodings. For the juxtaposed encodings, participants first worked on a 4 × 4 grid (16 items), then on a 6 × 6 grid (36 items). The target item was placed randomly among the other 15 or 35 candidate items. For the PCP encodings, we presented 16 or 36 superposed lines on a single chart, respectively. Due to the random selection, none of the screen arrangements was repeated among participants. Once the participant selected the similar top three items, they would proceed to the next trial.
A study session consisted of four steps; introduction, tutorial, experiment trials, and debriefing questionnaire. During introduction, the testers were briefed on the purpose of the study and asked to fill out a demographics survey. Participants were also informed that the test would be timed, but that they were not expected to optimize for time.
In each trial, the data items were shown on the screen; each item was identified by a numerical ID displayed next to that item (Fig.  2). The tutorial consisted of 3 trials, one for each encoding, excluding color-cue variants. For the glyph encodings section of the tutorial, participants performed the similarity task on a 3 × 3 grid. Instructions were displayed at the top of the screen, in the following format: “This is a demo serving as introduction to the tasks. Click on the 3 most similar items to the item number 4.” The tester selections were acknowledged by a brief highlighting of their selection. For the overlaid encoding section of the tutorial, the target item was shown with a thicker line, and hovering over another item highlighted that item, to better support visual identification of that item. This implementation replicated the brushing operation available in practice for this type of encodings. After each tutorial trial, we revealed the right answer by expanding the text message at the top of the screen (i.e.,“The correct answers are: 8, 2, 7”). During this stage, we answered any questions the participants had about the study or how similarity was measured.
For each trial, items were selected randomly from the database, and one item was randomly selected to be the “target” item. To discount the possible influence of the distance between the target item and the similar items, the target item was placed randomly on the display grid and referenced in the selection task only by its ID. For the glyph encodings, items were arranged in a grid of 4 × 4 (16 items), or 6 × 6 (36 items). Regardless of the encoding, the tester was prompted to select 3 items that were most similar to the target item by clicking on them with the mouse. After 3 items were selected, the tester was allowed to process to the next trial by selecting the “next” button. In the main experiment, participants performed 10 trials each, for the two test scales. During the test session, the ground truth was not revealed to the tester. A progress bar allowed participants to see their overall experiment progress.
After finishing all trials, participants were asked to fill out a short-answer questionnaire with the following questions:
Which was the most complicated visual encoding to process?
Which was the easiest visual encoding to process?
Which of the visual encodings was the most scalable?
Which of the visual encodings scaled the worst?
We explicitly defined scalability as “scalability with the number of items” in the online questionnaire, and encouraged participants to explain their reasoning in appropriate text boxes.
Each study session was performed on a web browser on the same laptop (15.4-inch display, 2880 × 1800 resolution). The participants used only mouse interaction during each trial. For each experiment trial, we logged the time spent per task, the similarity ranking of the items selected by the participant for each task, and the total experiment time. The time spent per task ended when the tester clicked the Next button. Additionally, we recorded the demographic survey and debriefing questionnaire results.
3.4
Scoring
In this study, the existence of a computable similarity measure is only required for the purpose of measuring the tester performance. In order to simulate the ground truth similarity between items and to measure performance, we used cosine similarity over the seven variables of the data points. The cosine measure is reasonably appropriate in information retrieval tasks over high-dimensional categorical data, such as our dataset based on patient records [47], and in the case of text data [48]. The cosine measure has the additional benefit of not being misleadingly based on an immediate set of visual cues, in contrast to other distances like the Euclidean distance. Arguably, if similarity could be easily calculated and reported, based on Euclidean distance, visual analysis would not be as beneficial to the analyst.
Nevertheless, to account for variations in the similarity ground truth for other possible datasets, our score formula, described below, was carefully crafted to be robust with variations in how the ground truth was measured. To quantify the influence of the ground truth measure, we used the cosine measure and an Euclidean measure to calculate pairwise similarity among a sample dataset. To this end, we generated 500 datasets of 16 items from the patient repository, and selected for each dataset a random “target” item. For each sample, we ranked the most similar items in that sample set based on each metric, and calculated the overlap between the two rankings. In terms of the top three ranked items, the average number of shared items was 2.52, whereas in terms of all 16 ranked items, the average number of shared items was 6.86. These result suggest that the difference in the ground truths will be exacerbated more for the harder trials, i.e., our cosine metric results would be more different, relative to an alternative (Euclidean) ground truth, when there is a high error already.
Based on this calibration, the error for each trial was computed based on the average difference in rank between the selected items and the 3 most similar items. For each trial, items were ranked in order of similarity with the target item. Given the ranks of a tester’s answer denoted by r1, r2, r3, sorted in ascending order of their rank, we then compute the Manhattan distance between their answer and the optimal solution (i.e. when r1 = 1, r2 = 2, r3 = 3). The error is given by the formula below, where 6 denotes the sum of the rankings of the 3 optimal choices, and thus allows the error to be 0 when the same top 3 items are selected by the tester, regardless of rank, as the top 3 items indicated by the ground truth:
(1)
Error=r1+r2+r363.
In summary, this formula accounts for randomness in the generated trials by aggregating the top 3 selections. The formula also makes the calculated error order-agnostic. The resulting error can be interpreted as the average number of items in each trial that had a greater similarity than the selected items.
3.5
Statistical Analysis
We report the mean error and trial time, along with 95% confidence intervals for each encoding type at each scale, as well as the change in mean values. The data was tested for extreme outliers using boxplot analysis, and we confirmed that all score data-points were more than 1.5% of the interquartile range from the upper or lower quartile [49]. The time data included three outliers, not correlated with the scores. We removed these outliers from the time analysis. The raw data was furthermore skewed, as typical with count data. Therefore, we tested the normality of the data using a Shapiro-Wilk normality test and found that both trial error (M = 4.82, skew = 1.46, kurtosis = 2.02, W(39) = 0.86, p < 0.001) and trial time (M = 48.6s, skew = 1.51, kurtosis = 3.77, W(36) = 0.90, p < 0.001) were not normally distributed, overall. As the data was not normally distributed, 95% confidence intervals were calculated using non-parametric bootstrapping with 10,000 samples for each distribution [50]. We chose this route, as opposed to a power transformation, for increased interpretability of our results, and also because applying a Yeo-Johnson power transform [51], which could handle zero error cases, did not result in normally-distributed trial error data.
Linear mixed-effect models were created to test for multivariate significant effects for trial error and trial time. This approach was chosen over a repeated measures ANOVA because it does not require that the dependent variable be normally distributed. For each model, the encoding type, the number of items, and whether the encoding was a color-cue variant were modeled as fixed effects, while each participant was modeled as a random effect by fitting an intercept to each participant. Chart type was dummy encoded as binary variables for when an encoding was a variant of a LSP or PSP. Number of items and use of color-cues were coded as binary variables to indicate whether 36 items were shown and whether color-cues were used. Models that considered user’s self-reported familiarity with data visualization and the interaction between trial time and error were also tested, but were excluded as they did not have significant effects.
Each effect was tested for statistical significance using a likelihood ratio test [52]. To provide an approximation of effect size, we report Cohen’s f2 factor, which is a calculation of the amount of variance explained in the model by adding in a variable, given by formula:
(2)
fvariable2=RFull model2R Model without variable21RFull Model2,
where R2 is the residual of the mixed effect model [53].
We further performed the non-parametric Wilcoxon signed-rank test to compare error and trial time between each encoding type at different scales to identify statistically significant differences between encodings. Family-wise error correction was performed across all significance tests using the Holm-Bonferroni method [54].
The study interface was built upon Experimentr.js [55], a front-end framework that aids in the data collection process and application hosting. Our backend, a Node.js server and a Redis database (BSD licensed), ran locally on our machine (offline). We developed the visual encodings using D3.js. Data analysis was performed in python using the statsmodels package [56] and R. Reproducibility is discussed in our Supplemental Materials.
4.
Results
4.1
Encoding and Scale Effects on Score
For trial error, we found within the transformed data the largest effect from encoding type (f2 = 0.29, p < 0.001), followed by the number of items shown (f2 = 0.21, p < 0.001). We found a small but measurable interaction effect between encoding and number of items (f2 = 0.02, p < 0.01), and a non-significant effect from color-cue (f2 = 0.01, p > 0.05).
Mean raw error within each encoding type and item count is shown, for easier interpretability, in Table I, and raw error distributions, including confidence intervals, are plotted in Figure 3. Kiviat diagrams had the lowest error, followed by LSPs and PCPs. PCPs had the highest error at both the moderate scale (M = 4, 95% CI = [3.4,4.5]) and large scale (M = 10.8, 95% CI = [9.5,12.1]). Color-cue Kiviat diagrams had the lowest error at both the moderate (M = 2.3, 95% CI = [1.8,2.9]) and large scale (M = 4.0, 95% CI = [2.9,5.0]).
Figure 3.
Notched box plots of mean trial error and time for each encoding type at different scales. Upper and lower bounds of the boxes show the upper and lower quartiles of the data within each setting, whereas notches show the estimated median of the data, along with 95% confidence intervals estimated via bootstrapping with 10,000 samples. Mean error (left) increased with the number of items, and was highest for parallel coordinate plot variants at both scales while color-cue Kiviat diagrams performed the best. Trial time (right) was lowest in all settings for color-cue Kiviat diagrams followed by color-cue parallel coordinate plots.
Table I.
Mean rank error and 95% confidence intervals for each encoding. Error was affected least for Kiviat plot variants (bold) when scaling up the number of items.
Encodings16 Items36 ItemsΔ Error
Mean95%CIMean95%CI
PCP4.03.4–4.510.89.5–12.16.8
CCue PCP4.13.6–4.78.57.1–9.94.4
LSP2.62.1–3.06.24.8–7.53.6
Kiviat2.51.9–3.05.03.6–6.42.6
CCue Kiviat2.31.8–2.94.02.9–5.01.6
Significant results from pairwise comparisons between encoding types within each setting are shown in Table II. At each scale, juxtaposed encodings consistently outperformed superposed encodings. Kiviats and LSPs outperformed PCPs, and color-cue Kiviats outperformed color-cue PCPs at both scales. The difference was most pronounced for non-color-cue variants and at larger scales, where PCPs had over twice the error of Kiviats (ΔError = 5.8, p < 0.001) and LSPs (ΔError = 4.6, p < 0.001). Kiviat diagrams had a non-significantly lower error than LSPs at both the moderate scale (ΔError = 0.1, p > 0.05) and large scale (ΔError = 1.2, p > 0.05).
Table II.
Pairwise comparisons for rank error between encodings. Mean differences and Holm-adjusted p-values are reported for statistically significant results. At each scale, juxtaposed encodings outperform superposed encodings.
Encoding 1Encoding 2ItemsΔ ErrorP
KiviatPCP365.8<0.001
LSPPCP364.6<0.001
CCue KiviatCCue PCP364.5<0.01
KiviatPCP161.5<0.01
LSPPCP161.4<0.05
CCue KiviatCCue PCP161.8<0.05
In terms of error, color-cue variants weakly outperformed their non-color-cue variants as the number of items increased. In large scale, color-cue Kiviat diagrams weakly outperformed normal Kiviat diagrams (ΔError = 1.0, p > 0.05), and color-cue PCPs performed better than non-color-cue PCPs (ΔError = 2.3, p > 0.05). However, this difference was not observed in the moderate 16 item setting.
Relative differences between encodings were amplified when scaling from 16 to 36 items. Of encodings without color-cues, PCPs scaled the worst with an increase average error of 6.8, followed by LSPs with an error increase of 3.6, and Kiviat diagrams with an increase of 2.6. Color-cue variants scaled better, with color-cue Kiviat digrams having an increased mean error of 1.6, which is the only encoding with a relative increase of less than 100%.
4.2
Encoding and Scale Effects on Response-time
With respect to response time, we found a small but significant effect from use of color-cue (f2 = 0.039, p < 0.001) and choice of encoding (f2 = 0.030, p < 0.001). There was an insignificant effect from the number of items (f2 = 0.006, p = 0.08), and no significant interaction effects.
Response time for each encoding type and item scale is shown in Table III; time distributions are plotted in Fig. 3. Response time was longest for PCPs with 16 items (M = 71s, 95% CI = [60s, 80s]) and lowest for color-cue Kiviats with 16 items (M = 40s, 95% CI = [35s, 45s]). Color-cue encodings always outperformed with respect to time non-color-cue encodings, regardless of encoding type or scale.
Table III.
Mean trial time in seconds, and 95% confidence intervals for each encoding, at two scale settings. Response time was affected least for color-cue variants (bold) when scaling up the number of items. Time decreased with scale for normal PCP and Kiviat variants, and increased for color-cue PCP and LSPs. Values reported use 37 testers, with 3 extreme outliers removed.
Encodings16 Items36 ItemsΔ Time
Mean95%CIMean95%CI
PCP7160–805849–65 − 12.9
CCue PCP4641–514641–520.4
LSP4738–545043–562.9
Kiviat5448–594844–53 − 5.6
CCue Kiviat4035–453732–422.6
Significant results for the pairwise comparisons are reported in Table IV. At the moderate scale, PCPs had a significantly longer response time than LSPs (ΔSeconds = −24, p < 0.01) and color-cue PCPs (ΔSeconds = −25, p < 0.001). Color-cue Kiviat diagrams also outperformed their regular variants at the moderate scale (ΔSeconds = −14, p < 0.01), and the large scale (ΔSeconds = −11, p < 0.01).
Table IV.
Pairwise encoding-comparisons for response time, color-cue variant versus regular variant. Mean differences and Holm-adjusted p-values are reported only for statistically significant results. At both scales, color-cue Kiviats are faster (see Fig. 3 Right for further data).
Encoding 1Encoding 2ItemsΔTime (s)P
LSPPCP16 − 24<0.01
CCue PCPPCP16 − 25<0.001
CCue KiviatKiviat16 − 14<0.01
CCue KiviatKiviat36 − 11<0.01
The relative number of items did not have a consistent effect on the average response time, and the effect of items count overall had a very small effect on time. Response time decreased for PCPs (− 12.9 s), Kiviats (− 5.6 s), and color-cue Kiviats (− 2.6 s), while LSPs and color-cue PCPs had an increase in their average time (2.9 s and 0.4 s, respectively). Overall, color-cue variants had the smallest absolute change as well as baseline average time.
4.3
Subjective Feedback
Figure 4 shows the number of times either Kiviat diagrams, LSPs, or PCPs were referenced in the exit questionnaire with respect to difficulty or scalability. Cases where testers did not specify any of the encoding types are excluded from these counts. Kiviat diagrams had the most (11) positive ratings in terms of difficulty and scalability, as well as the fewest negative ratings. Only three participants reported Kiviat diagrams as the most difficult, and one participant believed that Kiviat diagrams did not scale well. LSPs received fewer positive ratings in terms of difficulty (3) and scalability (5), and more negative votes (12 and 8, respectively). PCPs had the most negative reviews. 23 out of 40 participants considered PCPs to be the most challenging encoding, and 25 reported that it was the least scalable, while only 3 participants rated it as the easiest or most scalable. Most testers reported difficulties telling items apart in regular PCPs, for reasons related to the presence of a large amount of partially or totally overlapping segments. Regular PCPs further used a 10-hue color scheme for 36 items, which made brushing, and thus additional interaction, necessary in order to distinguish similarly colored items when they crossed through the same point. Color-cue helped alleviate the issue; testers felt the polylines in other hues but the target hue could be ignored.
Figure 4.
Subjective ratings of encoding difficulty (left) and scalability (right). Among the testers who expressed an opinion, Kiviat diagrams were rated most positively in terms of both difficulty and scalability, whereas PCPs were rated the worst.
Overall, the number of negative ratings were proportional to the mean error for each encoding, where more difficult ratings correspond to higher trial error, suggesting that the testers’ perceived difficulty accurately followed their actual performance.
4.4
Time-Score Analysis
Correlation between trial time and error was measured for each setting using the Pearson correlation coefficient. Interestingly, time and error were not significantly correlated overall (r36 = −0.01, p = 0.80), or in any setting except for the color-cue PCP with 36 items, which showed a significant negative correlation between time and error (r36 = −0.51, p < 0.01). PCPs showed a non-significant negative correlation between error and time except for PCPs in the moderate setting, which showed a non-sigificant positive correlation (r36 = 0.06, p = 0.7), while correlation for juxtaposed encodings was inconsistent in direction. Plots of time versus error across both scales for Kiviat diagrams versus PCPs, with and without color-cue are shown in Figure 5 and in the Supplemental materials. The plots indicate testers invested significant time and effort into the task, even when the resulting error was high.
Figure 5.
Log response-time versus error per trial for Kiviat diagrams and parallel coordinate plots with a robust linear regression fit shown with 95% confidence intervals for each encoding. Plots show results for plots without color-cue (left) versus with color-cue (right). Regression lines highlight the overall lack of correlation between error and time. The plots indicate several testers invested significant time into the task, even when the resulting error was high.
PCP variants showed more extreme cases with very low time and high error, suggesting that the stronger general correlation between error and time may be due to a larger number of cases where the tester “gave up” and guessed the answer, but the general payoff for additional time beyond a baseline was not beneficial.
5.
Discussion
Evaluation of the results shows that for accuracy in similarity detection, juxtaposed star plot variants (Color-cue Kiviats, Kiviats, LSPs) outperform superposed encodings (non-color-cue PCPs, color-cue PCPs) at both the moderate and the large scale. We therefore reject hypothesis H1 (At moderate scale (16 items), all encodings studied will yield equivalent scores), as encodings do not have equal performance at moderate scale; superposed encodings are worse.
At the same time, we accept hypothesis H2 (At large scale, juxtaposed encodings will outperform superposed encodings), and we furthermore find that it holds at moderate scale as well. This is an interesting finding, because our moderate and large scales are significantly below the suggested PCP effectiveness threshold of hundreds of items [13]. One interpretation is that, PCPs are excellent tools for correlation detection and analysis, and similarity detection does not necessarily involve inter-variable correlation. We also note that color-cue in PCPs helps with respect to similarity detection scores, but does so only at large scale, and the effect is moderate.
Within the star glyph variants, color-cue Kiviats and Kiviats scored similarly at both scales. At the large scale, color-cue Kiviats scored significantly better than LSPs. At moderate scale, all star glyph variants perform similarly with respect to error. These findings are in direct contradiction with the results of Fuchs et al. [18], who found that LSPs outperformed all other star glyph variations, including Kiviats. We believe the experimental setting may explain this discrepancy. First, in a 3 × 3 grid layout (9 items) with the target located centrally, as in Fuchs et al., similarity detection turns into a series of one-on-one comparison tasks with all items near the target. When scale increases, as in our experiments, items can no longer be placed immediately side by side for comparison. Second, when the number of variables encoded in the Kiviats is artificially large, as in the synthetic data used in the Fuchs et al. study, the shape of a Kiviat becomes harder to discern. With lower-dimensional items, Kiviats may benefit more from the pre-attentive nature of shape. In general, Kiviat-style glyphs may yield superior results in similarity tasks, as they do in pattern recognition tasks [57, 58].
As a result, we reject hypothesis H3 (At large scale, LSP encodings will outperform other encodings), and we furthermore find that H3 does not hold at the moderate scale, either. Overall, our results support the use of Kiviats and color-cue Kiviats for similarity detection at scales and dimensions used in this study. As expected, most encodings yield significantly worse scores as scale grows. The one notable exception are color-cue Kiviats, which further supports their use in practice. The qualitative feedback also indicates that juxtaposed Kiviats are easier to read and interpret than both LSP encodings and superposed encodings.
With respect to time, we found significant differences across encodings in both settings, and a significant correlation between use of color-cues and trial time was found in our mixed-effects model. Color-cue variants were, overall, less affected by scale, and were non-significantly faster than their non-color equivalents at the larger scale. Color-cue Kiviats were faster than Kiviats at both scales (p < 0.01), and were the fastest encoding at the large scale. At the moderate scale, LSPs, and color-cue PCPs were significantly faster than non-color-cue PCPs, but this difference was not significant at the large setting due to a drastic drop (− 12.9 s) in average trial time for regular PCPs when going from 16 to 36 items, that was not seen in other encodings. However, differences in trial time between settings did not correlate with trial error, and use of color cues did not have a significant effect on error. H4 is therefore valid (At both scales, color-cue encodings outperform other encodings with respect to time, but not with respect to score). The one moderate exception are PCPs in the large scale, where color-cue PCPs only weakly outperformed regular PCPs (p > 0.05).
Because color-cue does not lead to better similarity detection scores for Kiviats at either scale, it may be safe to map the Kiviat color to one of the item variables, as currently done in practice. The notable improvement that color-cues had on response time as the number of items increased may be due to the effect of perceptual grouping. Color-cues may help testers scan the candidate items for “similar” items while filtering out the “dissimilar” items. This interpretation is consistent with previous findings that show that search tasks are easier when distractors are more dissimilar to a target item [5962]. We also note that we deliberately chose a red-green-blue divergent colormap, as it would be harder for testers to associate with order. We speculate that a more easily interpretable color scale (e.g., one with monotonic variation in lightness) would have an even larger effect, as variations in lightness has been shown to have a larger effect on perceived bias than hue [63].
The complex relationships between the number of items, error, and response time suggest that the perceived task difficulty may influence the tester approach to the similarity detection process. For PCPs, the mean and median time decreased drastically, while the error increased, suggesting that testers may have “given up” for particularly difficult tasks, or encountered more mental fatigue when performing an initial search. Mean trial time for color-cue encodings, however, stayed within 5% of the trial time at 16 items, which could be interpreted as a regulating effect from color-cue by keeping the perceived difficulty of the task manageable as the number of items increased.
In terms of the effect of tester background, we note that most of our participants were knowledgeable about visual encodings, with two outliers. While statistical analysis is not feasible on such a small sample, we note that the two testers with no visualization expertise were outliers with respect to both error (higher error) and time (less time).
In terms of limitations, our study examines two relatively modest settings, and a relatively moderate set of variables, based on a real dataset. However, the significant variation in encoding performance indicates that even this scale can capture and document visual encoding scalability issues. Our study furthermore reports error with respect to a ground truth calculated via cosine similarity, which is appropriate for our dataset. However, our score function was designed to be resilient with variation in how the ground truth was calculated. Moreover, when compared against Euclidean ground truth in a post-hoc analysis, the rankings of the encodings in terms of average score/error were the same as in our results using cosine similarity (color-cue Kiviats > Kiviats > LSP > color-cue PCP > PCP). The results indicate that our findings are significant enough to stand with variations in the similarity ground truth calculation.
Additionally, our experiments were focused on evaluating error due to the encoding choice, and so rely on randomized samples of data from each trial. In order to generate adequate coverage of the dataset samples, and to avoid learning effects from repeating trials with the same encoding for the tester, our score formula used the average error for 3 item choices instead of 1, which smoothed the variance in the error without introducing as many learning effects from repeated trials in the same setting. This effect was modeled in the mixed-effects model for estimating trial size, and so our statistical tests and results hold. However, this comprehensive study did not generate enough samples to model trial-specific variation, and thus we only report inter-subject variation; in contrast, we can not draw strong conclusions about time versus score. It is possible testers spent most of the trial time scanning the candidate items before doing a granular comparison, and thus the difficulty of a given sample may have had a greater effect on the time the tester spent on each trial. Whereas, our results show consistent, comprehensive findings with respect to the effect encoding has on error, our response time results showed inconsistent effects from encoding and scale, which may be due to large changes in difficulty that are not captured in the mixed effects model. Despite this aspect of time analysis, our error findings are statistically rigorous and account for random variance in the data.
In the interest of limiting tester fatigue, ensuring glyph legibility on a relatively small screen, and based on critiques and earlier reports on the efficiency of specific encodings, we also did not include a wider range of encodings and scales. However, given the qualitative tester feedback and our numerical results, we expect our findings will also hold at larger scales. Last but not least, in terms of generalizability, our findings may not generalize to similarity detection tasks that involve hundreds of items, simply because juxtaposition requires more screen space than superposition.
Despite these limitations, our study involved 40 participants, 2 scale settings, and 10 trials per session. This setup enabled us to successfully investigate how accurately and quickly people can identify similar data points using different encodings. We found, surprisingly, that Kiviat diagrams were the most suitable encoding in terms of accuracy, especially in a large-scale context. In contrast, superposition-based approaches under-perform due to difficulties in distinguishing between items, and are often slower to read, possibly due to these difficulties.
5.1
Visual Analytics Similarity Guidelines
Similarity among multi-dimensional items may sometimes be computed, for example, using an Euclidean metric, in which case the exact ranking can and should be reported to the analyst in numerical form. In situations where the similarity is not directly computable, for example, when the weights of various features still need to be determined, visual similarity detection is particularly appropriate and beneficial.
With respect to visual similarity detection, overall, for multivariate, but not highly-dimensional collections similar to our dataset and up to several dozens of items, our findings support the use of juxtaposed Kiviats. For datasets with fewer than five dimensions, Kiviats would degenerate into simpler shapes, and other glyphs may be equally successful. In general, our findings support the use of juxtaposed encodings as opposed to superposed encodings. Where appropriate, the use of color-cues may furthermore assist the analyst in pre-filtering dissimilar items, and mitigate the effects of scale.
In the case of collections of a hundred to thousands of items, screen space becomes an issue and juxtaposition may not be feasible. Still, our analysis indicates that the legibility of superposed encodings is problematic with increasing scale. Wherever possible, it is worth introducing filtering or sorting operations to reduce the number of items considered simultaneously at any given time. For example, in a large repository of electronic health record data, it is worth stratifying the patient data first into smaller cohorts, and using a juxtaposed layout for visual analysis on the smaller cohort. Where PCPs are the only design option available, we strongly recommend the use of more advanced variants of PCPs than the plain PCP versions currently used by practitioners. Doing so may require the explicit integration of these more advanced variants into popular visualization platforms.
6.
Conclusion
In conclusion, we examined the effectiveness of five visual encodings for multivariate data in the context of similarity detection. We conducted a user study with 40 participants to measure similarity detection accuracy and response time under two conditions: moderate scale (16 items) and large scale (36 items). Our study produced new evidence that similarity judgments are easier using juxtaposed glyph than superposed visualizations, and that color-cues can mitigate detriments in performance that otherwise occur by increasing the size of the dataset. Our statistical analysis shows that there are significant differences in encoding performance, especially in the large scale setting of the experiment. In all settings, we found that plain PCPs are slower to read and lead to lower accuracy than juxtaposed (side-by-side) star glyph approaches. Among juxtaposed approaches, glyph variants like the Kiviat and color-cue Kiviat encodings scale well, are reasonably fast to read, and achieve good accuracy. When the number of items grows, juxtaposed color-cue Kiviats outperform other encodings, including LSPs, and are therefore suitable for similarity detection when dealing with larger multivariate datasets. Findings from this user study provide empirical evidence and guidance for the visualization design in similarity detection.
Acknowledgment
We acknowledge awards from the U.S. National Institutes of Health (NLM R01LM012527, NCI R01CA258827) and the U.S. National Science Foundation (CNS-1828265, CDSE-1854815). We thank all members of the Electronic Visualization Laboratory, and our collaborators at the M.D. Anderson Cancer Center, and at the University of Iowa.
References
1LucianiT.BurksA.SugiyamaC.KomperdaJ.MaraiG. E.2018Details-first, show context, overview last: Supporting exploration of viscous fingers in large-scale ensemble simulationsIEEE Trans. Vis. Comp. Graph.251111–11
2MaC.Visual Analysis Techniques for Dynamic Biological Networks.” Ph.D. Thesis (University of Illinois at Chicago, 2018). Available athttp://hdl.handle.net/10027/22644
3ChoiJ.LeeS.-E.ChoE.KashiwagiY.OkabeS.ChangS.JeongW. K.Interactive dendritic spine analysis based on 3D morphological featuresProc. 2019 IEEE Visualization Conf. (VIS)2019IEEEPiscataway, NJ171175171–510.1109/VISUAL.2019.8933795
4MaraiG. E.MaC.BurksA. T.PellolioF.CanahuateG.VockD. M.MohamedA. S.FullerC. D.2018Precision risk analysis of cancer therapy with interactive nomograms and survival plotsIEEE Trans. Vis. Comp. Graph.25173217451732–4510.1109/TVCG.2018.2817557
5ThomasM.KannampallilT.AbrahamJ.MaraiG. E.Echo: A large display interactive visualization of ICU data for effective care handoffs2017 IEEE Workshop on Visual Analytics in Healthcare (VAHC)2017IEEEPiscataway, NJ475447–5410.1109/VAHC.2017.8387500
6Meyer-SpradowJ.SteggerL.DöringC.RopinskiT.HinrichsK.2008Glyph-based spect visualization for the diagnosis of coronary artery diseaseIEEE Trans. Vis. Comp. Graph.14149915061499–50610.1109/TVCG.2008.136
7JäckleD.FuchsJ.KeimD.2016Star glyph insets for overview preservation of multivariate dataElec. Imaging2016191–910.2352/ISSN.2470-1173.2016.1.VDA-506
8FischerF.FuchsJ.MansmannF.Clockmap: Enhancing circular treemaps with temporal glyphs for time-series dataEuroVis Short Papers2012IEEEPiscataway, NJ9710197–101
9KintzelC.FuchsJ.MansmannF.Monitoring large IP spaces with clockviewProc. 8th Int’l. Symposium on Visualization for Cyber Security2011Association for Computing MachineryNew York10.1145/2016904.2016906
10LeggP A.ChungD. H.ParryM. L.JonesM. W.LongR.GriffithsI. W.ChemM.2012Matchpad: Interactive glyph-based visualization for real-time sports performance analysisComput. Graph. Forum31125512641255–6410.1111/j.1467-8659.2012.03118.x
12RicheN. H.HurterC.DiakopoulosN.CarpendaleS.Data-Driven Storytelling2018CRC PressBoca Raton, FL
13MunznerT.Visualization Analysis and DesignAK Peters Visualization Series2014CRC PressBoca Raton, FL
14LeeM. D.ReillyR. E.ButaviciusM. E.An empirical evaluation of Chernoff faces, star glyphs, and spatial visualizations for binary dataProc. Australian Symposium on Information Visualisation2003Australian Computer SocietyAustralia1101–10
15BorgoR.KehrerJ.ChungD. H.MaguireE.LarameeR. S.HauserH.WardM.ChenM.Glyph-based visualization: Foundations, design guidelines, techniques and applicationsEurographics (STARs)2013COREMilton Keynes396339–63
16O’BrienT.RitzA.RaphaelB.LaidlawD.2010Gremlin: An interactive visualization model for analyzing genomic rearrangementsIEEE Trans. Vis. Comput. Graph.16918926918–2610.1109/TVCG.2010.163
18FuchsJ.IsenbergP.BezerianosA.FischerF.BertiniE.2014The influence of contour on similarity perception of star glyphsIEEE Trans. Vis. Comp. Graph.20225122602251–6010.1109/TVCG.2014.2346426
19KosaraR.JohanssonJ.SadloF.MaraiG. E.Circular part-to-whole charts using the area visual cueEuroVis Short Papers2019The Eurographics AssociationEindhoven
20KosaraR.JohanssonJ.SadloF.MaraiG. E.The impact of distribution and chart type on part-to-whole comparisonsEuroVis Short Papers2019The Eurographics AssociationEindhoven
21ChanW. W.-Y.“A survey on multivariate data visualization,” Technical Report, Hong Kong University of Science and Technology (2006)
22LucianiT.CherinkaB.OliphantD.MyersS.Wood-VaseyW. M.LabrinidisA.MaraiG. E.2014Large-scale overlays and trends: Visually mining, panning and zooming the observable universeIEEE Trans. Vis. Comput. Graph.20104810611048–6110.1109/TVCG.2014.2312008
23LucianiT.WenskovitchJ.ChenK.KoesD.TraversT.MaraiG. E.FixingTIM: Interactive exploration of sequence and structural data to identify functional mutations in protein familiesBMC Proc.2014SpringerCham10.1186/1753-6561-8-S2-S3
24KeimD.2000Designing pixel-oriented visualization techniques: Theory and applicationsIEEE Trans. Vis. Comput. Graph.6597859–7810.1109/2945.841121
25KeimD.KriegelH.1996Visualization techniques for mining large databases: A comparisonIEEE Trans. Know. Data Eng.8923938923–3810.1109/69.553159
26FerstlF.KanzlerM.RautenhausM.WestermannR.2016Time-hierarchical clustering and visualization of weather forecast ensemblesIEEE Trans. Vis. Comp. Graph.23831840831–4010.1109/TVCG.2016.2598868
27RopinskiT.PreimB.Taxonomy and usage guidelines for glyph-based medical visualizationProc. Simulation and Visualization (SimVis)2008121138121–38
28HolzingerA.BiemannC.PattichisC. S.KellD. B.“What do we need to build explainable ai systems for the medical domain?” Preprint, arXiv:1712.09923 (2017)
29GleicherM.2018Considerations for visualizing comparisonIEEE Trans. Vis. Comput. Graph.24413423413–2310.1109/TVCG.2017.2744199
30MacEachrenA. M.How Maps Work: Representation, Visualization, and Design2004Guilford PressNew York, NY
31ChernoffH.1973The use of faces to represent points in k-dimensional space graphicallyJ. Am. Stat. Assoc.68361368361–810.1080/01621459.1973.10482434
32WareC.Information Visualization: Perception for Design20123rd ed.Morgan Kaufmann Publishers Inc.San Francisco, CA
33FuchsJ.IsenbergP.BezerianosA.KeimD.2017A systematic review of experimental studies on data glyphsIEEE Trans. Vis. Comp. Graph.23186318791863–7910.1109/TVCG.2016.2549018
34BorgI.StaufenbielT.1992Performance of snow flakes, suns, and factorial suns in the graphical representation of multivariate dataMultivariate Behav. Res.27435543–5510.1207/s15327906mbr2701˙4
35KlippelA.HardistyF.WeaverC.2009Star plots: How shape characteristics influence classification tasksCartography Geo. Inf. Sci.36149163149–6310.1559/152304009788188808
36MillerM.ZhangX.FuchsJ.BlumenscheinM.Evaluating ordering strategies of star glyph axesProc. VIS Short Papers2019IEEEPiscataway, NJ919591–510.1109/VISUAL.2019.8933656
37KeimD.Visual techniques for exploring databasesProc. Knowledge Discovery Databases1997AAAI PressWashington, DC
38PickettR. M.GrinsteinG. G.Iconographic displays for visualizing multidimensional dataProc. 1988 IEEE Int’l. Conf. on Systems, Man, and Cybernetics1988IEEEPiscataway, NJ514519514–910.1109/ICSMC.1988.754351
39SiirtolaH.Combining parallel coordinates with the reorderable matrixProc. CMV2003IEEEPiscataway, NJ637463–7410.1109/CMV.2003.1215004
40SchmidC.HinterbergerH.Comparative multivariate visualization across conceptually different graphic displaysInt. Conf. Scientific Stat. Database Management1994IEEEPiscataway, NJ425142–5110.1109/SSDM.1994.336963
41BotellaC.JolyA.BonnetP.MonestiezP.MunozF.2018Species distribution modeling based on the automated identification of citizen observationsApps. Plant Sci.6e102910.1002/aps3.1029
42PocoJ.DasguptaA.WeiY.HargroveW.SchwalmC.CookR.BertiniE.SilvaC.2014SimilarityExplorer: A visual inter-comparison tool for multifaceted climate dataComput. Graph. Forum33341350341–5010.1111/cgf.12390
43ZhaoY.LuoF.ChenM.WangY.XiaJ.ZhouF.WangY.ChenY.ChenW.2019Evaluating multi-dimensional visualizations for understanding fuzzy clustersIEEE Trans. Vis. Comput. Graph.25122112–2110.1109/TVCG.2018.2865020
44MariesA.LucianiT.PisciuneriP. H.NikM. B.YilmazS. L.GiviP.MaraiG. E.A clustering method for identifying regions of interest in turbulent combustion tensor fieldsVisualization and Processing of Higher Order Descriptors for Multi-Valued Data2015SpringerCham323338323–3810.1007/978-3-319-15090-1_16
45MorrisM. F.1974Kiviat graphs: conventions and figures of meritACM Sigmetrics Perf. Eval. Rev.3282–810.1145/1041691.1041692
46BrewerC.Colorbrewer 2.0 https://colorbrewer2.org
47BrownS.-A.2016Patient similarity: Emerging concepts in systems and precision medicineFrontiers Physiol.71110.3389/fphys.2016.00561
48HuangA.Similarity measures for text document clusteringProc. Sixth New Zealand Computer Science Research Student Conf. (NZCSRSC2008)20086495649–56
49HoaglinD. C.IglewiczB.TukeyJ. W.1986Performance of some resistant rules for outlier labelingJ. American Stats. Assoc.81991999991–9
50OrloffJ.BloomJ.Intro to probability and statistics. https://ocw.mit.edu (2014)
51YeoI.-K.JohnsonR. A.A new family of power transformations to improve normality or symmetryBiometrika2000OUPOxford
52CrainiceanuC. M.RuppertD.2004Likelihood ratio tests in linear mixed models with one variance componentJ. R. Stat. Soc.: Series B (Stat. Method.)66165185165–8510.1111/j.1467-9868.2004.00438.x
53SteigerJ. H.Beyond the f test: Effect size confidence intervals and tests of close fit in the analysis of variance and contrast analysisPsychological Methods2004APAWashington, DC
54HolmS.1979A simple sequentially rejective multiple test procedureScandinavian J. Statistics6657065–70
55HarrisonL. experimentr: a hosting/data-collection backend and module-based frontend for web-based visualization studies (2019)
56SeaboldS.PerktoldJ.Statsmodels: Econometric and statistical modeling with pythonProc. Python Sci. Conf.2010ScipyAustin, TX
57van OnzenoodtC.VázquezP.-P.RopinskiT.2023Out of the plane: Flower vs. star glyphs to support high-dimensional exploration in two-dimensional embeddingsIEEE Trans. Vis. Comp. Graph.29546854825468–8210.1109/TVCG.2022.3216919
58KeckM.KammerD.GründerT.ThomT.KleinsteuberM.MaaschA.GrohR.Towards glyph-based visualizations for big data clusteringProc. 10th Int. Symp. Vis. Inf. Comm. Interact.2017ACMNew York, NY129136129–3610.1145/3105971.3105979
59DuncanJ.HumphreysG. W.1989Visual search and stimulus similarityPsychol. Rev.96433458433–5810.1037/0033-295X.96.3.433
60WertheimerM.1923Untersuchungen zur lehre von der gestalt. iiPsychol. Forsch.4301350301–5010.1007/BF00410640
61HarozS.WhitneyD.2012How capacity limits of attention influence information visualization effectivenessIEEE Trans. Vis. Comput. Graph.18240224102402–1010.1109/TVCG.2012.233
62GramazioC.SchlossK.LaidlawD.2014The relation between visualization size, grouping, and user performanceIEEE Trans. Vis. Comp. Graph.20195319621953–6210.1109/TVCG.2014.2346983
63SchlossK.GramazioC.SilvermanA. T.ParkerM.WangA.2019Mapping color to meaning in colormap data visualizationsIEEE Trans. Vis. Comput. Graph.25810819810–910.1109/TVCG.2018.2865147