Back to articles
Papers Presented at CIC30: Color and Imaging 2022
Volume: 66 | Article ID: 050406
Image
Visual Cortex based Material Appearance Transfer Model
  DOI :  10.2352/J.ImagingSci.Technol.2022.66.5.050406  Published OnlineSeptember 2022
Abstract
Abstract

MA (Material Appearance) is a perceptual phenomenon that our brain deciphers from the retinal image. What features of retinal image are most closely related to the stimulus inside the visual cortex of V1 ∼ V5? The function of V1 is the most well-studied. V1 has the function of seeing fine in the fovea and rough in the periphery, and is mathematically described by LPT (Log-Polar Transform).

Since LPT samples the retinal image at a higher rate in the fovea but at lower rate peripherally, the color information tends to gather in center of V1. Paying attention to this LPT features in V1, we reported a novel method to transfer MA from one to another scenes. After LPT, PCM (Principal Component Matching) is applied to match the color distribution between source and target scenes. By just showing the target scene as an example, our previously reported LPT-PCM model can transfer the MA of target to that of source without any a priori information. However, this model had drawbacks such as changes in appearance depending on the background margins and unpredictable results for the scenes consisting of multiple color clusters.

This article explores measures to overcome such drawbacks and discusses the applicability of proposed LPT-PCM. Finally we propose a new numerical index to evaluate the similarity between the target and the transferred with the examined samples.

Subject Areas :
Views 67
Downloads 9
 articleview.views 67
 articleview.downloads 9
  Cite this article 

Hiroaki Kotera, Norimichi Tsumura, "Visual Cortex based Material Appearance Transfer Modelin Journal of Imaging Science and Technology,  2022,  pp 050406-1 - 050406-10,  https://doi.org/10.2352/J.ImagingSci.Technol.2022.66.5.050406

 Copy citation
  Copyright statement 
Copyright © 2022 Society for Imaging Science and Technology 2022
 Open access
  Article timeline 
  • received May 2022
  • accepted August 2022
  • PublishedSeptember 2022
jist
JIMTE6
Journal of Imaging Science and Technology
J. Imaging Sci. Technol.
1062-3701
1943-3522
Society for Imaging Science and Technology
1.
Background
Human observers can recognize material property at a glance through sensory organs. Without touching materials, we can tell whether they would feel hard or soft, cool or warm, rough or smooth, wet or dry. Furthermore, it is possible to define the material such as metal or wood, leather or cloth.
The material appearance is a perceptual phenomenon of feeling or sensation that our brain perceives from optical image projected onto retina. Though, it is hard to untangle what information of the retinal image stimulates the visual cortex of V1 ∼ V5 and how it induces the material feeling in our brain. The mechanism of INNER VISION in brain is still a black box at present [1].
As a framework for material perception, N. Tsumura initiated the skin color appearance and proposed the concept of appearance delivering system [2].
In Brain Information Science research on SHITSUKAN (material perception) [3] by MEXT (Ministry of Education, Culture, Sports, Science and Technology) in Japan, the first stage (2010–2014 led by Dr. H. Komatsu) has concluded and the second stage (2015–2019 led by Dr. S. Nishida) stepped forward into “multi-dimensional” material perception and currently, further research on “deep texture” is progressing. The results so far are being put onto practical use.
Despite the complexity of MA mechanism, human sensations such as “gloss/matte”, “transparent/translucent”, “metal/cloth” are controllable by an intuitive, but a smart technique.
For instance, Motoyoshi, Nishida, et al. [4] noticed the “gloss” perception appears when the luminance histogram is skewed. If it’s stretched smoothly to the higher luminance, the object looks “glossy” but looks “matte” if compressed to the lower. Sawayama and Nishida [5] developed “wet” filter by a combination of exponent-shaped TRC (Tone Reproduction Curve) and boosted color saturation. It is very interesting that any “skew” in the image features induces a sensational material perception. However, the mechanism why and how such sensations as “gloss” or “wet” are activated by the “skew” effect in our cerebral visual cortex is not untangled yet.
Meanwhile, R & Ds for practical applications are making steady progress in private enterprises. BRDF (Bidirectional Reflectance Distribution Function) describes the specular and diffusion components of optical surface reflection, which carry “gloss” or “texture” appearance and used to adjust MA. As a successful example, a specular reflection control algorithm based on BRDF is implemented in LSI chip used for a commercial 4K HDTV set [6].
Motivated by that LPT mimics the structure of visual cortex V1, we intended to apply it to MR transfer from a different perspective.
2.
Scene Color Transfer Models
Since the material perceptions such as gloss or clarity are related to a variety of factors [7], it is hard to specify the cause of perceptual feeling to a single factor. Nevertheless, trials on material or textual appearances transfer between CG images [8] or 3D objects [9] are reported. Especially, color appearance plays an important role in the MA. Historically, Reinhard’s color transfer model [10] was epoch-making, where the color atmosphere of source scene A was transferred into that of target scene B. The clustered color distribution of A is roughly matched with that of B. There, the use of vision-based lαβ color space by Ruderman [11] attracted interest.
So far, various example-based models have been reported, but they needed troublesome segmentation processes prior to define the target color area.
Most recently, Chunzhi Gu et al. [12] improved this drawback by an extended Gaussian Mixed Model (GMM) instead of segmentation. But, it incurs high computation costs to optimize GMM by iterative EM (Expectation Maxmization) algorithm.
The author developed a novel joint LPT-PCM model by combining LPT and PCM to transfer scene colors between different materials [13]. The LPT-PCM is also an example-based model, but the principle is fundamentally different from the conventional methods. This is because we do not see the object with our eyes but with the visual cortex, that is, LPT-PCM is a cortex-based model, where LPT reflects the variable resolution sampling characteristics of visual cortex V1.
The LPT-PCM model worked well between the objects that form relatively simple color clusters, but had the problems such as the changes in appearance depending on the background margin size or unpredictable/unintended results for the targets with complex mixed color clusters.
At the last CIC29, we announced how to emphasize MA. This time, we discuss how to transfer MA between scenes, focusing on the visual cortex V1, which is deeply related to MA.
2.1
lαβ Color Transfer Model
The lαβ is known as an orthogonal luminance-chrominance color space simply transformed from RGB by the following Step 1 and Step 2 and the color distribution of source image is changed to match the target (reference) image by the scaling process in Step 3 and the color atmosphere of target is transferred to the source via the inverse transform in Step 4 as follows
Step 1: RGB to LMS cone response transform
(1)
LMS=0.3810.5780.0400.1970.7240.0780.0240.1290.844RGB.
Step 2: LMS to lαβ transform with orthogonal luminance l and chrominance αβ
(2)
lαβ=130001600012111112110×logLlogMlogS.
Step 3: Scaling of lαβ around the mean values {l¯,α¯,β¯} by the ratio of standard deviation to make match the color distributions between source and target images.
(3)
l=(σDSTlσORGl)(ll¯)α=(σDSTασORGα)(αα¯)β=(σDSTβσORGβ)(ββ¯),
where, σORGl and σDSTα denote the standard deviation of luminance l for the source image and that of chrominance α for the target image, and so on.
Step 4: Inverse transform [lαβ] ⇒ [LMS] ⇒ [RGB].
Finally, the scaled lαβ source image with color distribution matched to the target image is displayed on sRGB monitor.
2.2
PCM Color Transfer Model
Prior to lαβ model, the author et al. developed PCM (Principal Component Matching) model [14, 15] for transferring the color atmosphere from one scene to another as illustrated in Figure 1. The lαβ model works well between the scenes with color similarity but not for the scenes with color dissimilarity and often fails. While, PCM model works almost stable between the scenes with color dissimilarities and advanced toward automatic scene color interchange [1618].
In our basic object-to-object PCM model a vector X in a color cluster is projected onto a vector Y in PC space by Hotelling Transform as
(4)
Y=A(Xμ).
Where, μ denotes the mean vector and the matrix A is formed by the set of eigenvectors {e1 e2 e3} of covariance matrix ΣX as
(5)
A=[e1e2e3].
The covariance matrix ΣY of {Y} is diagonalized in terms of A and ΣX with the elements composed of the eigenvalues {λ1 λ2 λ3} of ΣX as
(6)
ΣY=A(ΣX)At=λ1000λ2000λ3.
Figure 1.
Scene Color Transfer Model based on PCM.
Thus the color vectors in source and target images are mapped to the same PC space and the following equations are formed to make match a source vector YORG to a target vector YDST through the scaling matrix S as follows.
(7)
YDST=ADST(XDSTμDST)andYORG=AORG(XORGμORG),
where,
(8)
YDST=SYORG
(9)
S=λ1DSTλ1ORG000λ2DSTλ2ORG000λ3DSTλ3ORG
Solving Eqs. (7) and (8), we get the following relation between a source color XORG and a target color XDST to be transferred and matched.
(10)
XDSTμDST=MPCM(XORGμORG).
The matching matrix MPCM is given by
(11)
MPCM=(ADST1)(S)(A ORG),
where, AORG and ADST denote the eigen matrices for the source color cluster and the target color cluster. In the scaling matrix S, λ1ORG means the 1st eigenvalue of the source and λ2DST the 2nd eigenvalue of the target, etc. These are obtained from each covariance matrix.
In general, the PCM model works better than lαβ even for the scenes with color dissimilarities, because of using the statistical characteristics of covariance matrix.
Figure 2 shows a successful example in both lαβ and PCM models for the images with color similarity. While, in case of Figure 3, lαβ fails to change the color atmosphere of A into that of B due to their color dissimilarities, but works well in PCM.
2.3
Spectral Decomposition Color Transfer Models
Following the lαβ model, a variety of improved or alternative color transfer models have been reported. As a basic drawback in lαβ model, Pitie et al. [18] pointed out that it’s not based on the statistical covariance but only on the mean values and variances in the major lαβ axes. Hence PCM model is better than lαβ because of using the statistical covariance matrix ΣX with the Hotelling transform onto the PC space. At the same time, Pitie [19] suggested to make use of orthogonal spectral decomposition paying the attention to the Hermitian (Self adjoint) property of symmetric matrix ΣX with real eigenvalues.
Figure 2.
Successful example between images with color similarity.
Figure 3.
Comparison in lαβ versus PCM for images with color dissimilarity.
In general, the covariance matrix Σ in a clustered color distribution of image is a real symmetric matrix. The square root of Σ for source and target images is decomposed by eigenvalues as
(12)
ΣORG12=A ORG1D ORG12A ORGand ΣDST12=A DST1D DST12A DST.
AORG and ADST denote the eigen matrices for source and target images. DORG and DDST are given by the diagonal matrices with the entries of their eigenvalues respectively.
(13)
DORG=λ1ORG000λ2ORG000λ3ORG,DDST=λ1DST000λ2DST000λ3DST.
Now, the color matching matrix MEigen corresponding to Eq. (11) is given by
(14)
MEigen=ΣDST12Σ ORG12=(ADST1D DST12A DST)(AORG1D ORG12A ORG)1=(ADST1D DST12A DST)(AORG1D ORG12A ORG).
2.4
Singular Value Decomposition (SVD)
A m × n matrix Σ is decomposed by SVD as the product of matrices U, V, and W
(15)
Σ=UWV.
Where, U and V are m × m and n × n orthogonal matrices. If Σ is a m × n rectangular matrix of rank-r, matrix W is composed of r × r diagonal matrix with the singular values as its entries and the remaining small null matrices.
Since the covariance Σ is a 3 × 3 real symmetric matrix, the singular values equal to the eigenvalues and SV D equals EV D.
2.5
Cholesky Decomposition
Cholesky, a compact spectral decomposition method, decomposes the covariance Σ as a simple product of lower triangular matrix and its transpose as follows.
(16)
ΣORG=LORGLORGTfor L ORG=Chol ΣORGChol [ΣORG]TΣDST=LDSTLDSTTfor L DST=Chol ΣDSTChol [ΣDST]T
2.6
Eigenvalue Decomposition (EVD)
Where, Chol[∗] denotes the Cholesky decomposition. The lower triangular matrix L is obtained by the iteration just like as Gaussian elimination method (details omitted).
The color matching matrix MChol to transfer the color atmosphere of target image into the source is given by
(17)
MChol=LDST(LORG)1.
3.
Visual Cortex Based LPT-PCM Color Transfer
3.1
Retina to Visual Cortex Log Polar Transform
The PCM model works well to transfer the color atmosphere between the images even with color dissimilarities. However, any human visual characteristic has not been taken into account. In this paper, a striking feature in the spatial color distributions in our visual cortex image is introduced to improve the performance in PCM.
The mapping to visual cortex from retina is mathematically described by Schwartz’s complex Logarithmic Polar Transform [20].
The complex vector z pointing a pixel located at (x, y) in the retina is transformed to a new vector log(z) by LPT as follows.
(18)
z=x+jy=ρejθ;ρ=|z|and θ=tan1(yx)log(z)=u+jv=log(ρ)+jθ;j=1.
The retinal image is sampled at spatially-variant resolution on the polar coordinate (ρ, θ), that is, in the radial direction, fine in the fovea but coarser towards peripheral according to the logarithm of ρ, while in the angle direction, at a constant pitch Δθ and stored to the coordinate (u, v) in the striate cortex of V1.
Figure 4 illustrates a sketch how the retinal image is sampled, stored in the striate cortex, and played back to retina.
Figure 4.
Outline of spatially-variant mapping to visual cortex from retina.
In the discrete LPT system, (ρ, θ) is digitized to R number of rings and S number of sectors. The striate cortex image is stored in the new Cartesian coordinates (u, v) as
(19)
(u,v)Δ̲̲{ρ(u),θ(v)}ρ(u)=ρ0aufor ρρ0,u=1,2,,Ra=exp[log(ρmaxρ0)R]θ(v)=vΔθ=(2πS)vfor v=1,2,,S.
ρ0 denotes the radius of blind spot and ρρ0 prevents the points near origin not to be mapped to the negative infinite-point. This regulation is called CBS (Central Blind Spot) model. Figure 5 illustrates how the image “sunflower” is sampled in LPT lattice and transformed to striate cortex image, and then stored in the coordinates (u, v).
The height h(u) and width w(u) of an unit cell between u + 1 and u are given by the following equations. Hence the area α(u) of unit cell increases exponentially with u.
(20)
h(u)=ρ(u+1)ρ(u)=ρ0a1auw(u)=12(2πS)ρ(u+1)+ρ(u)=πS1+aauρ0α(u)=h(u)w(u)=πρ02(a21)a2uS1.
As sensed in Fig. 5, the color is sampled finer in the center but coarser towards peripheral. The pixels in the yellow petals occupy a larger area than peripheral. This color distribution in striate cortex reflects that V1 has the spatial processing function that collects color information in the center of the viewpoint.
Figure 5.
“sunflower” sampled in LPT lattice, and stored in Striate Cortex.
Figure 6 is another example for a pink rose named “cherry shell”. It shows how the color distribution is concentrated on the pinkish petal area around at the central viewpoint in the striate cortex image. Hence it’ll be better for applying PCM not on the original, but on the striate cortex image after LPT to perform the color matching more effective for the object of attention.
Figure 6.
Spatially-variant color concentration effect in Striate Cortex by LPT.
Now the basic PCM matrix MPCM in Eq. (11) is applied to the covariance after LPT and we get the novel color transfer matrix as
(21)
MLPTPCM=(LPTADST1)(LPTS)(LPTAORG)LPTS=LPT1DSTLPT1ORG000LPT2DSTLPT2ORG000LPT3DSTLPT3ORG.
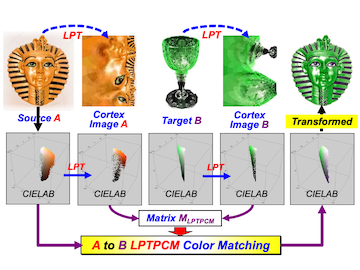
Figure 7 illustrates the color transfer process in LPT-PCM model. In this sample, both the source image A and target image B are first transformed to the visual cortex images by LPT, then the clustered color distribution in cortex image A is transformed to match the cortex image by PCM. As a result, the MA of greenish transparent wine glass B appears to be transferred to that of gold mask image A.
Figure 7.
Improved LPT-PCM color transfer model.
Since the original images A and B have color dissimilarity, it’s a hard to make the color matching only by the single use of basic PCM. While, by just placing LPT before PCM, the feeling of greenish wine glass B is well conveyed to that of gold mask A.
4.
Results in Comparison with Other Methods
The performance of proposed LPT-PCM model is compared with the other methods mentioned in Section 3. Figure 8 shows the results for the same images used in Fig. 7. The lαβ model fails for such images with color dissimilarity. The source colors remain almost unchanged. SVD and Cholesky decomposition reflect the greenish target colors a little bit, but look unnatural.
In the basic PCM model, the black in eyes and the green in mask face seem to have replaced the unnatural look. Mismatches in the directions of PC axes may occur. Meanwhile, LPT-PCM model worked successfully for transferring the color atmosphere of greenish wine glass to that of gold mask.
Figure 8.
Performance of LPT/PCM in comparison with other methods.
Figure 9 shows another example for color transfer between three glass vases with different textures. lαβ had a minimal effect leaving the source colors almost unchanged. Though SVD and Cholesky decomposition showed certain effects, a partial color mixing happened between the source B and target A as shown in B to A color matching. PCM and LPT-PCM looks like a neck and neck. But looking carefully, LPT-PCM gives a little bit better impression than PCM due to conveying the clean textures in the target.
Figure 9.
Performance of LPT/PCM for images with different textures.
Figure 10 is another result for the images with heterogeneous color & texture. The color atmosphere of “greenish wine glass” is attempted to transfer to that of “reddish Porsche”, where only LPT-PCM seems to be successful.
Figure 10.
A result for the images with heterogeneous color & textures.
5.
Problems and Discussion on Countermeasure
Since our LPT-PCM model utilizes the characteristics of visual cortex V1 that concentrates color information in the center of viewpoint, it has higher MA transfer performance than others.
However, it is not all-round, as occasionally we often encounter unexpected or unnatural results depending on the target. Below are some typical problems and examples of countermeasures.
5.1
Dependency on Background Margins and Cropping
Since the color transfer model is based on the color distribution of the source and the target, the background margin also affects the color distribution and has a simple problem of changing results.
Figure 11 shows an example of the resulting color change due to the background margins of the source image. One of the measures to prevent unintended MA caused by a large background margin is to crop in advance. The figure is such an example. LPT-PCM looks insensitive to the margins and robust than PCM.
Figure 11.
Problem of color change due to background margin.
5.2
How LPT-PCM Works for Multi-Cluster Target?
For the sake of simplicity, the basic PCM is designed assuming a single-cluster image. In the case of multi-cluster images, if segmentation is needed for separating the colored objects to each cluster then the object-to-object PCM is performed. however, it is hard to find the corresponding pair of objects particularly in the case of dissimilar color images [1416]. Hence, the proposed model may be limited to a single cluster image rather than universal.
Figure 12 shows a difficult example of multi-cluster image. However, LPT-PCM resulted in a color transfer function that matches the light green glass placed in the center of the three colored wine glasses. This is because light green occupies the largest area in the striate cortex image mapped to V1 as shown in the dotted circle.
Figure 12.
Performance of LPT/PCM for Multi-Cluster Target.
If the target B is rearranged so that the pink glass is in the center as target C, a pinkish Porsche is obtained as shown in the 3rd. line.
Why LPT? Because LPT mimics the spatial transform function of retina to/from visual cortex called foveation.
6.
Similarity Index
Since MA involves many factors as a perceptual phenomenon, it is difficult to quantitatively evaluate the similarity between the transferred result and the target.
As a simple way, the following similarity index ρ is tested.
(22)
ρ=Cor [Flatten{Cov [trnLab]},Flatten{Cov [dstLab]}].
Where, trnLab and dstLab denote CIELAB color distributions of Transferred result and that of Target to be matched.
Cor [X, Y ] means Correlation Operator between the vectors X and Y and Cov [Z] denotes Covariance of Z.
Here, Flatten works to convert 2-D matrix to 1-D array vector.
Figure 13 shows the examples of estimated similarity index ρ.
Figure 13.
Evaluated Similarity Index and Comparison with Other Methods.
Index values generally seem to reflect similarities, but do not always correspond to human visual senses. Verification by more cases and the search for more reliable indicators are future tasks.
7.
Conclusions
This paper discussed the applicability of LPT/PCM MA transfer model. It’s a model that combines LPT and PCM algorithms. Prior to PCM, the retinal images are transformed to striate cortex images by LPT. The key is to make use of color concentration features on the central viewpoint areas by LPT. The performance of basic PCM is significantly enhanced when combined with LPT. This innovative model worked better than others without any a priori information or optical measurement for the material properties. The question is how to evaluate the transformed image to be perceptually acceptable or not. A new similarity index ρ is proposed and showed some reasonable results. Towards future MA research, it’ll be an eternal goal to answer the question “how the brain feels beauty?” asked repeatedly by Semir Zeki in his book, INNER VISION [1].
References
1Semir Zeki, INNER VISION, “An Exploration of Art and the Brain” (Oxford University Press, Oxford, UK, 1999)
2TsumuraN.BabaK.YamamotoS.SambongiM.2015Estimating reflectance property from refocused images and its application to auto material appearance balancingJ. Imaging Sci. Technol.5930501-130501-630501-1–610.2352/J.ImagingSci.Technol.2015.59.3.030501
4MotoyoshiI.NishidaS.SharanL.AdelsonE. H.2007Image statistics and the perception of surface qualitiesNature447206209206–910.1038/nature05724
5SawayamaM.NishidaS.2015Visual perception of surface wetnessJ. Vis.1593710.1167/15.12.937
6KobikiH.NonakaR.BabaM.2013Specular reflection control technology to increase glossiness of imagesToshiba Rev.68384138–41
7FlemingR. W.2014Visual perception of materials and their propertiesVis. Res.94627562–7510.1016/j.visres.2013.11.004
8MihálikA.Durikovi£R.2009Material appearance transfer between imagesSCCG’09, Proc. Spring Conf., CG.555855–8ACMNew York, NY
9NguyenC. H.RitschelT.MyszkowskiK.EisemannE.SeidelH. P.20123D material style transferComputer Graphics Forum31431438431–810.1111/j.1467-8659.2012.03022.x
10ReinhardE.AdhikhminM.GoochB.ShirleyP.2001Color transfer between imagesProc. IEEE CG Appl.21344034–40IEEEPiscataway, NJ10.1109/38.946629
11RudermanD. L.CroninT. W.ChiaoC. C.1998Statistics of cone responses to natural images: implications for visual codingJ. Opt. Soc. Am. A15203620452036–4510.1364/JOSAA.15.002036
12GuC.LuX.ZhangC.2022Example-based color transfer with Gaussian mixture modelingJ. Pattern Recognit.12910871610.1016/j.patcog.2022.108716
13KoteraH.TominagaS.SchettiniR.TrémeauA.HoriuchiT.2019Material appearance transfer with visual cortex imageComputational Color Imaging. CCIW 2019Lecture Notes in Computer ScienceVol. 11418334348334–48SpringerCham10.1007/978-3-030-13940-7_25
14KoteraH.MorimotoT.SaitoR.1998Object-oriented color matching by image clusteringProc. IS&T/SID CIC6: Sixth Color Imaging Conf.154158154–8IS&TSpringfield, VA
15KoteraH.SuzukiM.ChenH. S.2001Object-to-object color mapping by image segmentationJ. Electron. Imaging10977987977–8710.1117/1.1407263
16KoteraH.HoriuchiT.2004Automatic interchange in scene colors by image segmentationProc. IS&T/SID CIC12: Twelfth Color Imaging Conf.939993–9IS&TSpringfield, VA
17KoteraH.MatsusakiY.HoriuchiT.SaitoR.Automatic color interchange between imagesProc. Congress of the Int’l. Color Association2005Vol. AIC 05101910221019–22
18KoteraH.2006Intelligent Image ProcessingJ. SID.14745754745–54
19PitiéF.KokaramA.2007The linear monge-kantorovitch colour mapping for example-based colour transferProc. IET CVMP.233123–31IETLondon
20SchwartzE. L.1977Spatial mapping in the primate sensory projection: analytic structure and relevance to perceptionBiol. Cybern.25181194181–9410.1007/BF01885636