Back to articles
JIST-first
Volume: 35 | Article ID: COLOR-207
Image
Three-Dimensional Adaptive Digital Halftoning
  DOI :  10.2352/J.ImagingSci.Technol.2022.66.6.060403  Published OnlineNovember 2022
Abstract
Abstract

Two-and-a-half and 3D printing are becoming increasingly popular, and consequently the demand for high quality surface reproduction is also increasing. Halftoning plays an important role in the quality of the surface reproduction. Three dimensional halftoning methods, that adapt the halftone structures to the geometrical structure of 3D surfaces or to the viewing direction, could further improve surface reproduction quality. In this paper, a 3D adaptive halftoning method is proposed, that incorporates different halftone structures on the same 3D surface. The halftone structures are firstly adapted to the 3D geometrical structure of the surface. Secondly, the halftone structures are adapted based on the normal vector to the surface at a specific voxel. Two simple approaches to approximate the normal vector are also proposed. The problem of edge artefacts that might occur in the previously proposed 3D Iterative Method Controlling the Dot Placement (IMCDP) halftoning method is discussed and a solution to reduce these artefacts is given. The results show that the proposed adaptive halftoning can combine different halftone structures on the same 3D surface with no transition artefacts between different halftone structures. It is also shown that using second-order frequency modulation (FM) halftone, in comparison to first-order FM, can result in more homogeneous appearance of 3D surfaces with undesirable structures on them.

Subject Areas :
Views 3
Downloads 0
 articleview.views 3
 articleview.downloads 0
  Cite this article 

Sasan Gooran, Fereshteh Abedini, "Three-Dimensional Adaptive Digital Halftoningin Electronic Imaging,  2022,  pp 060403-1 - 060403-12,  https://doi.org/10.2352/J.ImagingSci.Technol.2022.66.6.060403

 Copy citation
  Copyright statement 
Copyright © Society for Imaging Science and Technology 2022
  Article timeline 
  • received June 2022
  • accepted November 2022
  • PublishedNovember 2022

Preprint submitted to:
jist
JIMTE6
Journal of Imaging Science and Technology
J. Imaging Sci. Technol.
1062-3701
1943-3522
Society for Imaging Science and Technology
1.
Introduction
Two-dimensional halftoning is a well-established topic in image reproduction. There have been many 2D digital halftoning methods presented in literature over the past half a century. Iterative halftoning methods such as Direct Binary Search (DBS) halftoning algorithm [1] and Iterative Method Controlling the Dot Placement (IMCDP) [2] are two examples of more advanced but computationally more expensive 2D halftoning methods. Many of the developed 2D halftoning algorithms, such as error diffusion, DBS and IMCDP, belong to the category of frequency modulation (FM) halftoning methods, which we refer to as the first-order FM methods in this article. In these methods, the single dots are distributed “stochastically”. There is also another type of FM methods, referred to as the second-order FM halftoning in this article, that “stochastically” distributes the clustered dots [3]. One of the advantages of the 2D second-order FM halftoning over the first-order FM is that it results in halftones that give less grainy impression in the homogeneous parts of an image [4].
As 2.5D and 3D printing are becoming more and more popular and practically more feasible, the demand for high quality surface reproduction is also increasing. Since 3D halftoning methods directly affect the appearance of 3D surfaces, advanced 3D halftoning algorithms have received more attention over the past few years. Many of the proposed 3D halftoning algorithms are an extension of well-known 2D halftoning algorithms. Lou and Stucki were among the firsts who adapted 2D dithering and error diffusion to 3D domain [5]. In Ref. [6], 3D dithering has been applied to material composition as a halftoning approach. Zhou et al. applied error diffusion to layer-based 3D object halftoning for monochrome 3D halftoning [7]. Alexa and Kyprianidis addressed error diffusion on a surface in Ref. [8], where they analyzed different path orders to better distribute the error. Brunton et al. proposed an error-diffusion halftoning algorithm to produce full color with multi-jet 3D printer [9]. In order to diffuse the error as proposed in the original 2D error diffusion algorithm, they introduced a novel traversal algorithm for surface voxels. Later, in Ref. [10], they used the method presented in Ref. [9] for halftoning and by replacing assigned white materials with transparent material, they controlled the degree of translucency. Urban et al. have further standardized their halftoning techniques for the RGBA (Red, Green, Blue, Alpha) data format to control color layers of 3D color objects.[11]. Elek et al. improved details in color texture reproduction of the proposed 3D error diffusion in Ref. [9] by considering the scattering behavior of the materials on flat surfaces [12]. In Ref. [13], Michals et al. used the 3D traversal algorithm proposed in Ref. [9] and developed a 3D tone-dependent error diffusion method. Their proposed algorithm is a fast 3D halftoning method, which, according to the authors, produces results of quality close to iterative methods [13]. Morsy et al. presented a purely geometric and computationally efficient dithering method that removes quantization artefacts, which are a fundamental issue in 3D printing. Using an optimized 3D blue-noise mask, their proposed algorithm shifts low frequency quantization errors to higher frequencies that are mostly removed by the 3D printing process, which acts as a low-pass filter [14]. In Ref. [15], the authors presented the HANS3D content processing pipeline using a volumetrically-probabilistic approach, which is applicable to any printing material and printing system parameter. Halftoning becomes a problem of sampling a probability distribution. Parallel Random Area Weighted Coverage Selection (PARAWACS) is the halftoning method used in Ref. [15], which was originally developed for 2D, creating pre-computed halftone matrices making the process fully parallel. An extension of the 2D DBS halftoning algorithm has also been proposed in Ref. [16], which generates high quality surface reproduction. In Ref. [17], an iterative 3D halftoning method, called 3D IMCDP was introduced, which is an extension of the 2D IMCDP halftoning method discussed in Ref. [2]. In Refs. [18] and [19], the 3D IMCDP producing different halftone structures was applied to several 3D surfaces. It was shown in these studies that appropriate halftone structure could amplify or attenuate the 3D structure of a 3D surface.
In the present work, we propose a 3D adaptive halftoning method based on 3D IMCDP, in which the halftones could be adapted to either the spatial structure of the 3D surface or to the viewing/light direction. The problem of edge artefact that might occur at sharp edges on 3D shapes is discussed and a solution to reduce this artefact is also proposed. This article is organized as follows. Section 2 provides a brief description of the 2D IMCDP method and how it can produce different halftone structures. In Section 3, the 3D IMCDP is thoroughly described and an approach to reduce the edge effect problem at sharp edges is proposed. In Section 4, the 3D adaptive halftoning based on 3D IMCDP is described and an approach to partition a 3D surface into several structural areas is presented. Two approaches for approximating the normal vector to a 3D surface at a specific voxel are also proposed in this section. In Section 5, 3D halftone results of the proposed 3D adaptive method for several different 3D surfaces are illustrated and Section 6 provides a brief summary and the conclusion.
2.
Two-dimensional IMCDP
In this section, a description of IMCDP, the 2D iterative halftoning method is given. This method is described in detail in Ref. [2]. The IMCDP method starts with a blank image with the same size as the original image. The first dot is placed at the position where the original image holds the maximum pixel value. Then, a very small number is set at this position in the original image to make sure that this position will not be found as the maximum again. The effect of this dot placement is then fed-back into the halftoning process by subtracting a neighbourhood of the position of the found maximum by a filter, which is referred to as the feed-back filter, hereafter. By doing so, the probability to find the next maximum in that neighbourhood is reduced. This process proceeds and in each iteration one dot is placed at the position of the maximum pixel value and the effect of the placed dot is fed-back by an appropriate filter until a pre-determined number of dots are placed. The feed-back filter plays an important role on the halftone structure of the final reproduced image. Different appropriate filters can generate different halftone structures, shapes and alignments [3]. In order to generate symmetrical and well-formed first-order FM halftones having blue-noise characteristic, the following Gaussian function is used in the feed-back process,
(1)
f(m,n)=Ke(m2+n2)2σ2,
where K is a normalization factor to make the filter elements sum to one. In Ref. [4], it was discussed that σ = 1.7 generates halftones that result in the smallest average mean squared error when tested on many different test images. It is also possible to generate non-symmetrical first-order FM halftones with different alignments by using a non-symmetrical feed-back filter. Equation (2) shows such a non-symmetrical (elliptical) filter:
(2)
g(m,n)=Ke(Am2+Bmn+Cn2).
The constants A, B, and C are calculated by [20]
(3)
A=cos2ϕ2K1σ2+sin2ϕ2K2σ2,
(4)
B=sin2ϕ4K1σ2+sin2ϕ4K2σ2,
(5)
C=sin2ϕ2K1σ2+cos2ϕ2K2σ2.
The parameters K1 and K2 are used to adjust the symmetry of the filter. Note that, by setting K1 = K2 = 1 and ϕ = 0, the filter in Eq. (2) becomes identical to that in Eq. (1), representing a symmetrical Gaussian filter. On the other hand, K1 > K2 makes the halftone dots grow faster in the vertical direction creating vertical line halftones, while K1 < K2 performs the opposite. The parameter ϕ specifies the orientation of the line halftones, i.e. the angle between the line halftones and the positive y-axis if K1 > K2 or the angle between the line halftones and the positive x-axis if K1 < K2. Figure 1 shows the halftone images generated by three different feed-back filters. As can be seen in Fig. 1(a), the symmetrical Gaussian function in Eq. (1) was used, creating symmetrical first-order FM halftones. In Fig. 1(b), the function in Eq. (2) with k1 = 1, k2 = 3 and ϕ = 0 was used to create horizontal line halftones. In Fig. 1(c), the function in Eq. (2) with k1 = 3, k2 = 1 and ϕ=20 was used, which resulted in line halftones rotated 20 with respect to the positive y-axis. It is also possible to generate second-order FM, i.e., green-noise [21], halftones by the following feed-back filter,
(6)
h(m,n)=K(e(m2+n2)2σ12e(Am2+2Bmn+Cn2)).
The constants A, B, and C are calculated as shown in Eqs. (3)–(5), where σ is replaced by σ2. Hence, the filter in Eq. (6) is a Gaussian function subtracted from another Gaussian function with larger standard deviation, i.e., σ1 > σ2. By this filter, the pixel values around the found maximum are decreased with a radius decided by σ1. After the single dots have been distributed, the dots start to cluster and the maximum size of the clustered dots will depend on σ2. By appropriate choices of σ1 and σ2, it is possible to meet a specific demand for the size of the clustered dots at a certain gray level [3]. In order to generate symmetrical second-order FM halftones, the parameters K1, K2 and ϕ should be set to 1, 1 and 0, respectively. In order to create line halftones with different orientations, different values for K1, K2, and ϕ should be used, as described earlier. The only difference is that K1 < K2 makes the halftone dots grow faster in the vertical direction creating vertical line halftones, while K1 > K2 performs the opposite. Figure 2 shows three different halftone images achieved by the function in Eq. (6) with different parameters. In all of these three filters, σ1 = 2.5 and σ2 = 1. Fig. 2(a) is created using k1 = 1, k2 = 1 and ϕ = 0, generating symmetrical second-order FM halftones. In Fig. 2(b), the function in Eq. (6) with k1 = 3, k2 = 1 and ϕ = 0 was used to create horizontal line halftones. In Fig. 2(c), the function in Eq. (6) with k1 = 1, k2 = 3 and ϕ=20 was used, which resulted in line halftones rotated 20 with respect to the positive y-axis. It is worth mentioning that the proposed 2D first-order FM halftoning is suitable for printers, such as inkjet, that are able to stably print dispersed isolated dots. The second-order FM halftoning is, in addition, suitable for printers using electrophotographic (EP) technology, such as laser printers, that cannot stably print isolated dots.
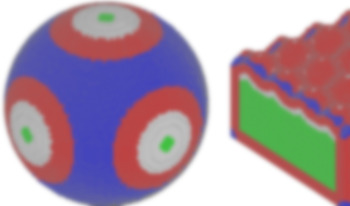
Figure 1.
The test image is halftoned using three different feed-back filters: (a) the Gaussian function in Eq. (1). (b) The Gaussian function in Eq. (2) with k1 = 1, k2 = 3 and ϕ = 0. (c) The Gaussian function in Eq. (2) with k1 = 3, k2 = 1 and ϕ=20. The print resolution is 150 dpi.
Figure 2.
The test image is halftoned using three different feed-back filters: (a) the function in Eq. (6) with k1 = 1, k2 = 1 and ϕ = 0. (b) the function in Eq. (6) with k1 = 3, k2 = 1 and ϕ = 0. (c) the function in Eq. (6) with k1 = 1, k2 = 3 and ϕ=20. The print resolution is 150 dpi.
3.
Three-dimensional IMCDP
In Ref. [17], an extension of the two-dimensional IMCDP to a 3D halftoning method, referred to as 3D IMCDP in this article, is presented. In Section 3.1, a brief description of that extension to 3D IMCDP is given. A major shortcoming of this extension approach is the occurrence of few artefacts close to sharp edges. In Section 3.2, an approach to reduce this artefact is proposed.
3.1
Extending 2D IMCDP to 3D
The 3D IMCDP, like the 2D IMCDP, starts by finding the position of the voxel holding the maximum value and assigning the same position in the halftoned 3D surface, to a “dot”, i.e. black voxel. The effect of this placed black voxel is fed-back to the halftoning process, like in the 2D IMCDP, by subtracting a neighbourhood around the found maximum by a filter. By the neighbourhood, we mean all surface voxels within an m × m × m box around the found maximum. In Figure 3, the red voxel shows the voxel holding the maximum value at an iteration and the green voxels show all surface voxels within an 11 × 11 × 11 box around the red voxel. The natural extension of IMCDP to 3D would then be to use a three-dimensional Gaussian function similar to that in Eqs. (1), (2) or (6) as the feed-back filter. However, the Euclidean distance between two 3D voxels does not always represent a good measure of the distance between the two voxels on a 3D surface. For example, there could be two voxels that are equally far from a voxel on the surface but having different Euclidean distances to the same voxel. This will give the voxel having longer 3D distance a higher chance to be chosen as the maximum than the other one, although both of them are equally far from the central voxel on the 3D surface. This might cause undesirable halftone structure artefacts, which was referred to as circular artefacts in Ref. [17]. Figure 4(a) shows the xz-view of a sphere of radius 150 with a constant absorptance of 0.5 being halftoned by 3D IMCDP using a three-dimensional Gaussian filter as the feed-back filter. Notice that an absorptance of 0 and 1 corresponds to white and black, respectively. This circular artefact is clearly visible in this figure, especially close to the origin of the circle. To overcome these circular artefacts, instead of using a three-dimensional Gaussian function, an m × m two-dimensional Gaussian function is constructed and its weights are sorted in descending order. The surface voxels within an m × m × m box around the found maximum are sorted by their 3D Euclidean distance to the central voxel (the position of the found maximum) in ascending order. The value of the closest voxel to the central voxel should be subtracted by the larger filter element value to reduce the possibility of that voxel being found as the next maximum. Thus, the closest voxel is subtracted by the first weight, i.e., the largest weight, and the second closest voxel by the second weight in the sorted list of the 2D filter elements, and so on. If there are more surface voxels around the found maximum than the filter elements, i.e., m2, only the first m2 surface voxels are affected. If there are less than m2 surface voxels around the found maximum, all surface voxels are subtracted by weights in the sorted list from position 1 to the number of surface voxels. Although the 3D Euclidean distance still decides the weight assigned to a voxel, it is not directly used in the Gaussian function and the weights are taken from a 2D Gaussian filter. This means that two voxels having the same distance to the central voxel on the 3D surface might still be subtracted by two different weights, but the difference is not as large as using a 3D Gaussian function [17]. Fig. 4(b) shows the xz-view of the same sphere as in (a) being halftoned by 3D IMCDP using the two-dimensional feed-back filter in Eq. (1) with σ = 1.7, generating first-order FM halftones. The XY and Y Z views of the sphere look identical to the XZ view and thus not illustrated. The halftone results generated by this approach show a well-formed first-order FM halftone structure without visible circular effect. Worth mentioning that in all 3D halftoned surfaces in this article m equals 11. This extension approach from 2D to 3D IMCDP works very well and the halftone structures look smooth and very similar to the 2D halftone structures when viewed from any viewing angle for most of the parts of a 3D surface. The only shortcoming is that when using large standard deviations, e.g. σ = 1.7, edge effects occur close to sharp edges in a 3D surface. The reason is that, close to sharp edges, there are voxels that are far from the found maximum on the 3D surface but have a very small 3D Euclidean distance to it. This will assign a large filter element to that voxel if a large standard deviation is used, even though we use the strategy to overcome the circular effects. This problem and a solution to it will be illustrated and discussed in the following subsection.
3.2
Reducing the Edge Artefact
As explained earlier, when a large standard deviation is used, the proposed 3D IMCDP method might create edge artefacts in areas close to sharp edges. Figure 5(a) shows a first-order FM halftoned box with a constant absorptance of 0.3. The feed-back filter is the Gaussian function in Eq. (1) with σ = 1.7. The artefact close to the sharp edges are clearly visible in this figure. One simple solution is to use a smaller standard deviation. Our experiments show that using σ = 1.3 creates halftones of almost the same quality as a larger standard deviation with the benefit that the edge artefacts are much less evident. If for any 3D shape or any texture being mapped on the 3D surface, it is important to use a larger standard deviation in flat areas, we propose the following solution. The solution is to use a larger standard deviation when the identified maximum is not close to a sharp edge and gradually reduce the standard deviation when the maximum gets closer and closer to the sharp edge. Assume that the identified maximum and its m × m neighbourhood are on a surface that is parallel to one of the coordinate planes. This will mean that all surface voxels in an m × m × m neighbourhood around the found maximum will be on a 2D plane parallel to one of the coordinate planes. We define three distances dx = maxx −minx, dy = maxy −miny and dz = maxz −minz, where maxx and minx mean the largest and the smallest x-coordinate in the neighbourhood, respectively. The other two distances are defined correspondingly. For an m × m area on a plane parallel to one of the coordinate planes, one of these three distances will be 0 and the other two equal m − 1. When the found maximum is close to an edge of a box, the least of these three distances, which was zero, becomes larger and larger. Therefore, we use Eq. (7) as a measure to decide whether a found maximum is close to an edge,
(7)
dmin=min(dx,dy,dz),
where the function min returns the minimum of its arguments. Fig. 5(b) shows the same box as in (a) being halftoned using variable standard deviation. In this figure, σ = 1.7 for dmin < 2, and it is gradually reduced to 1.3 when dmin becomes larger. As can be seen in this figure, the edge effects are considerably reduced.
Figure 3.
The red voxel shows the voxel holding the maximum value at an iteration and the green voxels show the neighbourhood of the red voxel, which are all surface voxels within an 11 × 11 × 11 box around the red voxel.
Figure 4.
The xz-view of a halftoned spherical surface with a radius of 150 and absorptance 0.5. The feed-back filter is: (a) a three-dimensional Gaussian function. (b) the two-dimensional Gaussian function in Eq. (1).
Figure 5.
The box with an absorptance of 0.3 is halftoned by first-order FM. (a) The feedback filter in Eq. (1) with σ = 1.7 is used. (b) The same feed-back filter with σ = 1.7 is used in areas close to 2D but smaller standard deviations are used close to edges.
4.
Three-dimensional Adaptive IMCDP
As discussed in previous sections, different feed-back filters can create different halftone structures. This can allow us to incorporate different halftone structures in different parts of a 3D shape. One of the possibilities is to use the appropriate halftone based on the geometrical structure of the 3D surface. Another possibility is to use the appropriate halftone structure based on the viewing/light direction. These two possibilities are described and illustrated in the following two subsections.
4.1
Three-Dimensional Structure-Based IMCDP
When a 3D shape is created, there might be different structures that exist on its surface. It could be undesirable structures caused by the voxelization or the printing process, which could be caused by the print resolution, the material being used, etc. It could also be the geometrical structure of the surface of the created 3D shape, for instance forehead wrinkles of a 3D face. We refer to these two types of structures as 3D structures. There might also be other structures coming from the texture/image content being mapped on the 3D shapes, similar to structures in 2D images. In this section, we focus on the 3D geometrical structures and describe how different halftones could be combined based on the structures of a surface. Different halftone structures might be suitable for different 3D structures. In Refs. [18] and [19], it has been illustrated that line halftones aligned in the same direction as the direction of the variation on the 3D surface will attenuate the waviness of the surface, while line halftones perpendicular to that will emphasize the waviness. It has also been shown that first- and second-order FM halftones might also behave differently on different 3D surface structures. In this section, we will describe an approach to partition a 3D surface into different structural areas. This will make it possible for 3D IMCDP to apply different halftones suitable for each structural partition by the use of different feed-back filters. It is logical to assume a 2D plane parallel to one of the coordinate planes to be a structureless 3D surface. Therefore, there shouldn’t be any 3D structures on such a surface, unless it is caused by the print process due to low resolution and/or print materials. As discussed in Section 3.2, in such an area, the surface voxels within an m × m × m box around the central voxel will only include m × m surface voxels on that 2D plane. The standard deviation of one of the three coordinates of the voxels on this area is zero, and that of the other two is m23. For instance, if this surface is parallel to the XY -plane, the standard deviations of the z-coordinates of these m × m voxels is zero and the standard deviation of x- and y-coordinates are both m23. Therefore, for such a surface the smallest and the largest standard deviation of the coordinates are zero and m23, respectively. Hence, the difference between the maximum and the minimum standard deviation of the coordinates of the surface voxels can be used as a measure/threshold to partition a surface into structural areas. Another surface worth considering is a 3D surface shape like ⊓ or ⊔, where the top (or bottom) of the area is one row of surface voxels and the two sides of it, which are m×m12 each, are parallel to one of the coordinate planes [18]. The standard deviation of the three coordinates of the voxels on such a surface are m23, mm+1 and m2+343. The threshold for this surface, i.e. the difference between the largest and the smallest standard deviation, would be m23mm+1 for m > 5. Considering the fact that in 3D IMCDP, m is always an odd integer greater than or equal to 11, this threshold is always valid for such a surface. The third interesting surface to investigate is when the central voxel is at the edge of a box and at least m+12 voxels away from the corner of the box. On such a surface, the standard deviation of one of the coordinates is m23 and that of the other two is 5m2+383. Hence, the threshold corresponding to this structure is m235m2+383. Finally, it is noteworthy to specify where this threshold is zero. The threshold is zero when all three standard deviations are equal, and this happens for example when the central voxel is located at the corner of a box. The area in this case will consist of 3(m12)2+3m12 surface voxels, on which all three coordinates have equal standard deviation giving the threshold of zero. Another 3D surface on which the coordinates of the surface voxels have equal standard deviation, is a plane tilted 45 with respect to one of the coordinate planes. As an example, these three aforementioned thresholds could be used to divide 3D surfaces into four different regions. Figure 6 shows this partitioning using m = 11 for a sphere of radius 50 and a box with additional structures on top of it. The green areas are those very close to 2D surfaces parallel to one of the coordinate planes, clearly seen on the box. As seen in both 3D surfaces, the green areas gradually turn to white, red and finally blue as the difference between the maximum and the minimum standard deviation of the coordinates of the surface voxels becomes smaller and smaller. For instance, the red regions are those having similar structure as the edge of a box, and the blue regions show the voxels close to the corner of the box or close to planes being tilted 45 on the sphere and the box. In Section 5, several 3D shapes are partitioned into a number of structural areas and halftoned by different halftone structures to illustrate the impact of the halftone structures on the appearance of the surface.
Figure 6.
Two different 3D surfaces divided into four different structural regions.
4.2
Three-Dimensional Viewing-Direction-Based IMCDP
Another aspect that might affect the appearance of a 3D surface is the viewing/light direction. Hence, it might be of interest to change the halftone structures based on the viewing direction. In order to take into account the viewing/light direction, there is a need to calculate the normal vector of the 3D surface at a specific voxel. Based on the information for the viewing/light direction and the calculated normal vector, the halftone structure can be adapted by appropriate feed-back filter. In the following section, we describe two similar approaches to approximate the normal vector at a surface voxel based on least-squares method.
For a specific voxel, we firstly find the x, y and z coordinates of the surface voxels within an n × n × n box around that specific voxel. Assume that there are l surface voxels within this box. In the first approach, we approximate the normal vector with the normal vector to the best plane approximating these l voxels using least-squares method. Assume that, the equation of this plane is given by z = Ax + By + C, giving the normal vector of (−A, −B, 1) or (A, B, −1). The goal is now to find A and B, such that the following squared error is minimized,
(8)
e=i=1l(zi(Axi+Byi+C))2,
where xi, yi and zi are the coordinates of the l voxels. By setting the derivative of Eq. (8) with respect to A, B and C to zero, the following equation system is achieved.
(9)
Axi2+Bxiyi+Cxi=xiziAxiyi+Byi2+Cyi=yizi.Axi+Byi+Cl=zi.
Notice that in Eq. (9), all summations are calculated for i varying from 1 to l, which has been discarded to make the equation system more readable. The normal vector to the plane and thereby the surface at this specific voxel is then (A, B, −1) or (−A, −B, 1). It is worth mentioning that the above equation system might be missing solutions, which happens for cases when the plane approximating the points is parallel to the z-axis and therefore independent of z. If the determinant of the matrix built of the coefficients to the left-hand side of Eq. (9) is close to zero, then we can assume that the plane can be written as y = Ax + Bz + C and solve the corresponding equation system. If this equation system has also a determinant close to zero, it means that the plane is parallel to the yz-plane, indicating that the normal vector should be (1,0,0) or (−1,0,0).
Another approach is to find the best plane approximating the l points that also goes through a specific voxel. The specific voxel is the position of the found maximum in the 3D IMCDP method. Assume again that we define the plane by z = Ax + By + C. In order for this plane to go through the specific point (x0, y0, z0), we will have C = z0Ax0By0, reducing the number of the variables to two, i.e. A and B. This will give z = A(xx0) + B(yy0) + z0, resulting in the following squared error,
(10)
e=i=1l(zi(A(xix0)+B(yiy0)+z0))2.
By setting the derivative of Eq. (10) with respect to A and B to zero, the following equation system is achieved.
(11)
A(xix0)2+B(xix0)(yiy0)=(xix0)(ziz0)A(xix0)(yiy0)+B(yiy0)2=(yiy0)(ziz0).
The normal vector to the surface is then approximated by (A, B, −1) or (−A, −B, 1). As explained above, if this equation system has a determinant close to zero then we can assume that the plane can be written as y = Ax + Bz + C and solve the corresponding equation system. It is worth pointing out that the two approaches will result in quite similar normal vectors when n and consequently l are small integers. Let us give an example. Consider a voxel with coordinates (158,138,28) on a sphere with a radius of 100 and the center of (50,50,50). Thus, this point is on the lower hemisphere and the surface normal pointing outwards should be a downward vector. The calculated normal vectors approximated by the first and the second approach with n = 3 are (0.77,0.43, −1) and (0.67,0.33, −1), respectively. As can be noticed, they are quite similar. As the second approach is less computationally expensive, it is probably more appropriate to use this approach.
Besides the normal vector, its orientation, i.e. pointing outward or inward the 3D object, is also important in order to be compared to the viewing/light direction/directions. For a closed surface such as a box or sphere, the orientation of the normal vector pointing outward the object is easily found by making a vector from the specific surface voxel to a point inside the closed object. If the scalar product between this vector and the normal vector, e.g. (A, B, −1), is negative, then this normal vector is pointing outwards, otherwise the normal vector pointing outwards is (−A, −B, 1). For more complicated objects, it is not so obvious and there might be many different approaches to decide the direction of the normal pointing outward the surface. If the 3D object, as specified in Ref. [9], consists of inner, surface and outer voxels, from the specific voxel, find the next voxel in the direction of the found normal vector. If this next voxel is an inner voxel, the normal vector pointing outwards will be the found vector multiplied by − 1. If the next voxel is an outer voxel, the found normal vector is the one pointing outwards. In Section 5, several halftone results are illustrated, where different parts of the shapes are halftoned by different halftone structures, based on the direction of the normal vector pointing outward the object.
5.
Results
In this section, we illustrate several halftone results of the proposed 3D adaptive iterative halftoning method. One of the basic requirements for a 3D halftoning method is that, it should behave the same as a 2D halftoning when it is applied to a surface close to two-dimensional. Figure 7 illustrates a sphere of radius 100 with an absorptance of 0.3 being halftoned by the proposed first- and second-order 3D IMCDP. To the left, the 3D view of the first-order FM halftoned sphere is illustrated using the azimuthal angle ϕ=45 and the polar angle θ=45. The middle top figure shows the 2D top view (parallel to the xy-plane) of the first-order FM halftoned sphere. To the right, the 3D view of the second-order FM halftoned sphere is illustrated. The middle-bottom figure is the 2D top-view of this halftoned sphere. The xz and yz 2D views of the halftones look identical to those illustrated and are therefore not illustrated. The 2D views of the halftones and the distributions of the dots verify that the 3D halftoning algorithm results in similar halftones achieved by 2D halftoning of a two-dimensional surface. Another observation is that the concept of two-dimensional first- and second-order halftoning can be extended to 3D.
Figure 7.
A sphere of radius 100 with a constant absorptance of 0.3 is halftoned by 3D IMCDP. (Left) First-order FM, viewing direction (ϕ,θ)=(45,45). (Middle-top) The top view of the first-order FM halftoned sphere. (Middle-bottom) The top view of the second-order FM halftoned sphere. (Right) Second-order FM, viewing direction (ϕ,θ)=(45,45).
In Section 4.1, an approach to partition a 3D surface into several structural regions has been proposed. In order to illustrate that, a box with some 3D structures on top of it with an absorptance of 0.3 has been portioned into a number of structural regions and adaptively halftoned. In Figure 8, the structure less areas, i.e. those close to 2D plane parallel to one of the coordinate planes, have been halftoned by second-order FM with moderately large cluster dot size. As the surface becomes more structured, the cluster dot size is gradually decreased and the most structured area, i.e. the top face, is halftoned by first-order FM. The right-top and right-bottom images in Fig. 8 show the 2D view of the top and bottom face of the box, respectively. As can be seen in the top face, the spatial 3D structure has a great impact on the appearance of the top face. In Figure 9, the cluster dot size is increased as the area becomes more structured. It means, the most structured area, the top face, is halftoned by second-order FM with moderately large cluster dot size and the structureless area, e.g. the bottom face, is halftoned by first-order FM (right-top and right-bottom images in Fig. 9). Comparing the top face views in Figs. 8 and 9 reveals that the top face looks more homogeneous when halftoned by second-order FM. Thus, it can be concluded that second-order FM halftone can attenuate the unwanted spatial geometrical structures.
Figure 8.
The cluster dot size gradually decreases from structureless area to highly structured areas according to the proposed measure in Section 4.1. (Right-up) Top face, the highly structured area is halftoned by first-order FM. (Right-bottom) Bottom face, the structureless area is halftoned by 2nd order FM using moderately large cluster dot size.
Figure 9.
The cluster dot size gradually increases from structureless area to highly structured areas according to the proposed measure in Section 4.1. (Right-up) Top face, the highly structured area is halftoned by 2nd order FM using moderately large cluster dot size. (Right-bottom) Bottom face, the structureless area is halftoned by first-order FM.
As the main goal of this work is to present the theoretical background for the 3D adaptive halftoning method, only the digital halftones obtained by the proposed method have been illustrated. We believe that the main application area for such halftones would be within 2.5D and 3D printing technologies with the possibility of voxel-level control in the printing process, such as Stratasys J-series 3D printers. One of our ultimate future work will be to apply these halftones using this type of printers. However, in order to give an illustration on how different halftones behave on structured areas in practice, we did tests using Canon Elevated Printer. The R&D version of the Elevated Printing RIP (Raster Image Processor software) gives the option to print each pixel with one droplet. In this test droplet size 30 pl black is chosen. A box with sinusoidal structure on top of it having 0.3 absorptance has been halftoned by second-order FM using two different cluster dot sizes. The smaller cluster dot size was created by setting σ1 = 1.3 and σ1 = 0.9 in Eq. (6). The larger cluster dot size was created by σ1 = 1.9 and σ1 = 1.0. The top-left image in Figure 10 shows the top face of the simulated digital halftoned box using the smaller cluster dot size and the bottom-left image illustrates the simulated digital halftone obtained by using the larger cluster dot size. As can be seen in these two images, the larger cluster dot size creates halftones that attenuate the waviness of the surface. The images in the middle of Fig. 10 are the scanned version of the ones to the left being printed on a flat surface (height of 0 mm). The images to the right illustrate the scanned version of the 2.5D print results of the left images based on the height information, i.e. the value of the z-coordinates for each surface voxel (maximum height of 2.5 mm). Note that, these images are supposed to illustrate how the actual printouts look like and each printed patch is 1 inch × 1 inch being scanned at 300 ppi. As can be seen in the scanned version of the printed results, larger cluster dot size attenuates the waviness and creates a more homogeneous surface appearance.
Figure 10.
Second-order FM has been used. For the top row smaller cluster dot size and for the bottom row larger cluster dot size has been used. (Left) The top-view of the digital simulated halftoned surface. (Middle) The halftone in the left has been printed on a flat surface and scanned at 300 ppi. (Right) The halftone in the left has been 3D printed based on the height map information from the 3D box (maximum height of 2.5 mm) and scanned at 300 ppi.
In order to investigate the halftone structures’ impact on a regular image being printed on a structured surface, a test image has been mapped on the structured face of a box. Figure 11 (Left) and (Right) show the surface halftoned by first- and second-order FM, respectively. As can be seen in the left image, the chequered-like structure originated from the surface structure, is visible, while the right image shows a more homogeneous appearance and the geometrical structure has been “hidden” by the halftone structure.
Figure 11.
The image mapped on the structured face of a box is halftoned by: (Left) first-order FM. (Right) second-order FM.
Another aspect of the proposed 3D halftoning method, discussed in Section 4.2, is that it can adapt the halftone structure to the viewing direction or the lighting conditions. This is done by approximating the normal vector to the surface at the found maximum in each iteration. For example, calculating the dot product between the normal vector and the viewing direction or the direction of the light source, depending on the conditions, the halftone structure can be adapted. Figure 12 shows a box with sinusoidal structures on its top face being halftoned by first- and second-order FM. The halftone has been adapted based on the angle between the normal vector and the up-direction, i.e. ẑ=(0,0,1). In this figure, if the angle between the normal vector and the up-direction is less than 30, first-order FM is used and otherwise a second-order FM is used. As can be seen, specially in the 2D top view, first-order FM is used on the peaks and the pits of the structure. The side faces are also halftoned with the same second-order FM, but the halftone structures on them could also be easily adapted, if desirable. There might also be a practical application to this type of combining different halftones. As an example, assume that there is a light source above the box in Fig. 12, i.e. the light direction is ẑ=(0,0,1). According to Lambert’s cosine law, the radiant intensity is directly proportional to the cosine of the angle between the direction of the incident light and the surface normal. In this example, it would mean that the areas close to the peaks and the pits will reflect more diffuse light than areas on the walls of the dales. As the first-order FM usually causes larger dot gain than second-order FM, this phenomenon could be taken into account and compensated by incorporating appropriate halftones, as done in Fig. 12.
Figure 12.
The box with a structured top face has been halftoned by first- and second-order FM, where the normal vector decides the halftone. The right image shows the 2D top view.
In order to verify the approach to approximate the normal vector and investigate how smooth the transition from one halftone structure to another is, a sphere of radius 100 with an absorptance of 0.3 has been halftoned, as seen in Figure 13. The normal vector to the surface at each found maximum was approximated according to the first approach proposed in Section 4.2 using n = 5. The angles between the normal pointing outward the sphere and the up-direction (ẑ=(0,0,1)) in the upper hemisphere and between the normal and the down-direction (ẑ=(0,0,1)) in the lower hemisphere were used to decide the halftone structure. In Fig. 13, first-order FM was used for angles less than 30. For larger angles, second-order FM with three different cluster dot sizes was used. The size of the dot was increased once at 45 and for the second time at 60. This means that, four different halftones have been used to halftone this sphere. As can be seen in the middle (xy-view) and the right (xz-view) images in Fig. 13, the transition is very smooth, although we purposely chose to have big changes in the size of cluster dots for the sake of illustration.
Figure 13.
The sphere of radius 100 with an absorptance of 0.3 has been halftoned by first- and second-order FM with three different cluster dot sizes based on the direction of the normal vector. (Left) the 3D view. (Middle) the top (xy) view. (Right) The side (xz) view.
6.
Summary and Conclusion
In this article, a 3D adaptive halftoning method has been presented that is able to incorporate different halftone structures on the same 3D shape. It was shown how to partition a 3D surface into several structural areas and thereby halftone each partition by an appropriate halftone. Second-order FM halftone with appropriate cluster-dot size is able to “hide” the undesirable surface structures better than first-order FM, giving a more homogeneous appearance. Another advantage of the proposed method is its ability in adapting the halftone based on the normal vector of the surface at a specific voxel. Two different but similar approaches approximating the normal vector were also proposed. Having the normal vector at each voxel in each iteration makes it possible to choose an appropriate halftone, for example based on the viewing or the light source direction. To name a few examples, this possibility allows the user to have different halftones on different sides of a box, or on different hemispheres of a sphere or on different parts of any other 3D shape. One of the possible applications brought up in this article was to adapt the halftone to the light source direction. The diffuse reflection is maximum in points whose normal to the surface is parallel to the light source direction. If the surface is tilted with regards to the light source direction, less light will be diffusely reflected according to Lambert’s cosine law. In order to give a more homogeneous appearance, it could be beneficial to use a halftone causing smaller dot gain in tilted areas, for instance second-order FM. One of the main challenges when combining different halftone structures in the same shape is the possible transition artefacts that might occur. According to our experiments and all illustrations of the results obtained by the proposed adaptive halftoning in this article, the transition between different halftone structures is very smooth.
Because of the variability of 3D printing, it is important to evaluate the proposed 3D halftoning methods in practice. Thus, applying the proposed 3D halftoning method using 3D printing technologies with the possibility of voxel-level control, such as Stratasys J-series 3D printers, is among our main future works. In this article, however, we mainly focused on presenting the theoretical background of the proposed halftoning technique. Most of the illustrations have therefore been different views of several 3D halftoned surfaces. Nevertheless, to verify our observations based on the obtained digital halftones, we did a number of simple tests using Canon Elevated Printer. The print results show that it is possible to achieve a more homogeneous appearance for a structured surface by appropriate halftone structure.
Regarding the time aspect of the proposed halftoning method, we have not spent much time on streamlining our code. To give an indication on the time aspect, halftoning the sphere with a radius of 100 (consisting of 103734 surface voxels) in Fig. 13 took about 21 seconds in MATLAB on a MacBook Pro (Processor: 3.1 GHZ and memory: 16 GB, 2133 MHz). This time also includes the calculation of the normal vector in each iteration by the first approach proposed in Section 4.2. We believe that this method can become much faster if the code is optimized or written in programming languages other than MATLAB. It might also be possible to halftone the whole 3D surface by halftoning several slices at a time, which will be investigated and evaluated in our future works.
Acknowledgment
This project was funded by ApPEARS (Appearance Printing European Advanced Research School), the European Union’s Horizon 2020 programme under the Marie Skłodowska-Curie grant agreement No. 814158. The authors thank Clemens Weijkamp and Canon Production Printing for providing printed samples.
References
1AnalouiM.AllebachJ. P.1992Model-based halftoning using direct binary searchProc. SPIE16669610896–10810.1117/12.135959
2GooranS.2004Dependent color halftoning: Better quality with less inkJ. Imaging Sci. Technol.48354362354–62
3GooranS.KruseB.2015High-speed first- and second-order frequency modulated halftoningJ. Electron. Imaging24023016 (1-19)10.1117/1.JEI.24.2.023016
4GooranS.2022A comprehensive halftone image quality evaluation of first- and second-order fm halftonesJ. Imaging Sci. Technol.66010506 (1–27)10.2352/J.ImagingSci.Technol.2022.66.1.010506
5LouQ.StuckiP.Fundamentals of 3d halftoningInt’l. Conf. on Raster Imaging and Digital Typography1998SpringerBerlin, Heidelberg224239224–3910.1007/BFb0053273
6ChoW.SachsE. M.PatrikalakisN. M.TroxelD. E.2003A dithering algorithm for local composition control with three-dimensional printingComput. Aided Des.35851867851–6710.1016/S0010-4485(02)00122-7
7ZhouC.ChenY.2009Three-dimensional digital halftoning for layered manufacturing based on dropletsTrans. North American Manufacturing Research Institution of SME37175182175–82
8AlexaM.KyprianidisJ. E.2015Error diffusion on meshesComput. Graph.46336344336–4410.1016/j.cag.2014.09.010
9BruntonA.ArikanC. A.UrbanP.2015Pushing the limits of 3d color printing: Error diffusion with translucent materialsACM Trans. Graph.351131–1310.1145/2832905
10BruntonA.ArikanC. A.TanksaleT. M.UrbanP.20183d printing spatially varying color and translucencyACM Trans. Graph.371131–1310.1145/3197517.3201349
11UrbanP.TanksaleT. M.BruntonA.VuB. M.NakauchiS.2019Redefining a in rgba: Towards a standard for graphical 3d printingACM Trans. Graph.381141–1410.1145/3319910
12ElekO.SuminD.ZhangR.WeyrichT.MyszkowskiK.BickelB.WilkieA.KrivanekJ.2017Scattering-aware texture reproduction for 3d printingACM Trans. Graph.3610.1145/3130800.3130890
13MichalsA.LiuJ.JumabayevaA.LiZ.AllebechJ. P.3d tone-dependent fast error diffusionProc. IS&T Electronic Imaging: Color Imaging XXIV: Displaying, Processing, Hardcopy, and Applications2019101-1101-8101-1–810.2352/ISSN.2470-1173.2019.14.COLOR-101
14MorsyM.BruntonA.UrbanP.2022Shape dithering for 3d printingACM Trans. Graph.411121–1210.1145/3528223.3530129
15MorovicP.MorovicJ.GottwalsM.TastlI.DispotoG.Hans3d: A multi-material, volumetric, voxel-by-voxel content processing pipeline for color and beyondProc. IS&T CIC25: Twenty-five Color and Imaging Conference2017IS&TSpringfield, VA219225219–2510.2352/ISSN.2169-2629.2017.25.219
16MaoR.SarkarU.UlichneyR.AllebechJ. P.3d halftoningProc. IS&T Electronic Imaging: Color Imaging XXII: Displaying, Processing, Hardcopy, and Applications2017IS&TSpringfield, VA147155147–5510.2352/ISSN.2470-1173.2017.18.COLOR-048
17AbediniF.GooranS.NystromD.3d halftoning based on iterative method controlling dot placementProc. IS&T Printing for Fabrication2020IS&TSpringfield, VA697469–74
18GooranS.AbediniF.3d surface structures and 3d halftoningProc. IS&T Printing for Fabrication2020IS&TSpringfield, VA758075–80
19AbediniF.GooranS.NyströmD.The effect of halftoning on the appearance of 3d printed surfaces47th Annual Conf. of Iarigai2021DiVAUppsala
20AbediniF.GooranS.KitanovskiV.NyströmD.2021Structure-aware halftoning using the iterative method controlling the dot placementJ. Imaging Sci. Technol.65060404 (1–14)10.2352/J.ImagingSci.Technol.2021.65.6.060404
21LauD. L.ArceG. R.GallagherN. C.1998Green-noise digital halftoningProc. IEEE86242424442424–4410.1109/5.735449