The area of uncertainty visualization attempts to determine the impact of alternative representations and evaluate their effectiveness in decision-making. Uncertainties are often an integral part of data, and model predictions often contain a significant amount of uncertain information. In this study, we explore a novel idea for a visualization to present data uncertainty using simulated chromatic aberration (CA). To produce uncertain data to visualize, we first utilized existing machine learning models to generate predictive results using public health data. We then visualize the data itself and the associated uncertainties with artificially spatially separated color channels, and the user perception of this CA representation is evaluated in a comparative user study. From quantitative analysis, it is observed that users are able to identify targets with the CA method more accurately than the comparator state-of-the-art approach. In addition, the speed of target identification was significantly faster in CA as compared to the alternative, but the subjective preferences of users do not vary significantly between the two.

The area of uncertainty visualization attempts to determine the impact of alternative representations and evaluate their effectiveness in decision-making. Uncertainties are often an integral part of data, and model predictions often contain a significant amount of uncertain information. In this study, we explore a novel idea for a visualization to present data uncertainty using simulated chromatic aberration (CA). To produce uncertain data to visualize, we first utilized existing machine learning models to generate predictive results using public health data. We then visualize the data itself and the associated uncertainties with artificially spatially separated color channels, and the user perception of this CA representation is evaluated in a comparative user study. From quantitative analysis, it is observed that users are able to identify targets with the CA method more accurately than the comparator state-of-the-art approach. In addition, the speed of target identification was significantly faster in CA as compared to the alternative, but the subjective preferences of users do not vary significantly between the two.

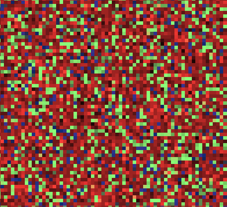
A novel technique for visualizing multispectral images is proposed. Inspired by how prisms work, our method spreads spectral information over a chromatic noise pattern. This is accomplished by populating the pattern with pixels representing each measurement band at a count proportional to its measured intensity. The method is advantageous because it allows for lightweight encoding and visualization of spectral information while maintaining the color appearance of the stimulus. A four alternative forced choice (4AFC) experiment was conducted to validate the method’s information-carrying capacity in displaying metameric stimuli of varying colors and spectral basis functions. The scores ranged from 100% to 20% (less than chance given the 4AFC task), with many conditions falling somewhere in between at statistically significant intervals. Using this data, color and texture difference metrics can be evaluated and optimized to predict the legibility of the visualization technique.

During these past years, international COVID data have been collected by several reputable organizations and made available to the worldwide community. This has resulted in a wellspring of different visualizations. Many different measures can be selected (e.g., cases, deaths, hospitalizations). And for each measure, designers and policy makers can make a myriad of different choices of how to represent the data. Data from individual countries may be presented on linear or log scales, daily, weekly, or cumulative, alone or in the context of other countries, scaled to a common grid, or scaled to their own range, raw or per capita, etc. It is well known that the data representation can influence the interpretation of data. But, what visual features in these different representations affect our judgments? To explore this idea, we conducted an experiment where we asked participants to look at time-series data plots and assess how safe they would feel if they were traveling to one of the countries represented, and how confident they are of their judgment. Observers rated 48 visualizations of the same data, rendered differently along 6 controlled dimensions. Our initial results provide insight into how characteristics of the visual representation affect human judgments of time series data. We also discuss how these results could impact how public policy and news organizations choose to represent data to the public.

The Conference on Visualization and Data Analysis (VDA) 2023 covers all research, development, and application aspects of data visualization and visual analytics. Since the first VDA conference was held in 1994, the annual event has grown steadily into a major venue for visualization researchers and practitioners from around the world to present their work and share their experiences. We invite you to participate by submitting your original research as a full paper, for an oral or interactive (poster) presentation, and attending VDA in the upcoming year.

The Conference on Visualization and Data Analysis (VDA) 2022 covers all research, development, and application aspects of data visualization and visual analytics. Since the first VDA conference was held in 1994, the annual event has grown steadily into a major venue for visualization researchers and practitioners from around the world to present their work and share their experiences. We invite you to participate by submitting your original research as a full paper, for an oral or interactive (poster) presentation, and attending VDA 2022.

This paper presents Nirmaan, an open-source web-based tool for generating synthetic datasets of multiclass blobs for use in research related to scatterplots. We demonstrate how to use Nirmaan to generate datasets in the context of a user study where users must determine the centers of each class, but this tool can be used to generate datasets for other scatterplot tasks as well.

Photogrammetric three-dimensional (3D) reconstruction is an image processing technique used to develop digital 3D models from a series of two-dimensional images. This technique is commonly applied to optical photography though it can also be applied to microscopic imaging techniques such as scanning electron microscopy (SEM). The authors propose a method for the application of photogrammetry techniques to SEM micrographs in order to develop 3D models suitable for volumetric analysis. SEM operating parameters for image acquisition are explored and the relative effects discussed. This study considered a variety of microscopic samples, differing in size, geometry and composition, and found that optimal operating parameters vary with sample geometry. Evaluation of reconstructed 3D models suggests that the quality of the models strongly determines the accuracy of the volumetric measurements obtainable. In particular, they report on volumetric results achieved from a laser ablation pit and discuss considerations for data acquisition routines.

We describe the development of a multipurpose haptic stimulus delivery and spatiomotor recording system with tactile mapoverlays for electronic processing This innovative multipurpose spatiomotor capture system will serve a wide range of functions in the training and behavioral assessment of spatial memory and precise motor control for blindness rehabilitation, both for STEM learning and for navigation training and map reading. Capacitive coupling through the map-overlays to the touch-tablet screen below them allows precise recording i) of hand movements during haptic exploration of tactile raised-line images on one tablet and ii) of line-drawing trajectories on the other, for analysis of navigational errors, speed, time elapsed, etc. Thus, this system will provide for the first time in an integrated and automated manner quantitative assessments of the whole ‘perception-cognitionaction’ loop – from non-visual exploration strategies, spatial memory, precise spatiomotor control and coordination, drawing performance, and navigation capabilities, as well as of haptic and movement planning and control. The accuracy of memory encoding, in particular, can be assessed by the memory-drawing operation of the capture system. Importantly, this system allows for both remote and in-person operation. Although the focus is on visually impaired populations, the system is designed to equally serve training and assessments in the normally sighted as well.
