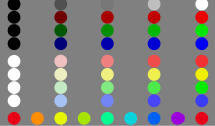
A digital color appearance test chart, akin to a ColorChecker® Chart for human perception, was developed and evaluated both perceptually and computationally. The chart allows an observer to adjust the appearance of a limited number of color patches to allow a quick evaluation of perceived brightness, colorfulness, lightness, saturation, and hue on a display. The resulting data can then be used to compared observed results with the predictions of various color appearance models. Analyses in this paper highlight some known shortcomings of CIELAB, CIECAM02, and CAM16. Differences between CIECAM02 and CAM16 are also highlighted. This paper does not provide new psychophysical data for model testing, it simply describes a technique to generate such data and a computational comparison of models.

The state-of-the art smartphones have a motion correction function such as an electric image stabilizer and record the video without shaking. As the motion is corrected in various ways according to the set maker, there is a difference in performance and it is difficult to distinguish clearly its performance. This paper defines the Effective angle of View and Motion, for video motion correction performance evaluation. In the case of motion, we classified the motion volume, motion standard deviation, and motion frequency parameters. The performance of motion correction on the electronic device can be scored for each of parameters. In this way, the motion correction performance can be objectively modelled and evaluated.

This paper describes a CMOS image sensor (CIS) horizontal band noise reduction methodology considering on-chip and offchip camera module PCB design parameters. The horizontal band noise is a crucial issue for high quality camera of modern smartphone applications. This paper discusses CIS horizontal band noise mechanism and proposes the solution by optimization of design factors in CIS and camera module. Analog ground impedance value and bias voltage condition of pixel array transfer gate have been found to be effective optimization parameters. Through the real experimental data, we proved that proposed solution is instrumental in reducing the horizontal band noise.

In this paper, we construct a model for cross-modal perception of glossiness by investigating the interaction between sounds and graphics. First, we conduct evaluation experiments on cross-modal glossiness perception using sounds and graphics stimuli. There are three types of stimuli in the experiments. The stimuli are visual stimuli (22 stimuli), audio stimuli (15 stimuli) and audiovisual stimuli (330 stimuli). Also, there are three sections in the experiments. The first one is a visual experiment, the second one is an audiovisual experiment, and the third one is an auditory experiment. For the evaluation of glossiness, the magnitude evaluation method is applied. Second, we analyze the influence of sounds on glossiness perception from the experimental results. The results suggest that the cross-modal perception of glossiness can be represented as a combination of visual-only perception and auditory-only perception. Then, based on the results, we construct a model by a linear sum of computer graphics and sound parameters. Finally, we confirm the feasibility of the cross-modal glossiness perception model through a validation experiment.

Three-dimensional (3D) displays become more and more popular in many fields. However, visual fatigue is one of the critical factors that impede the wide range of applications of 3D technology. Although many studies have investigated the 3D visual fatigue, a few of them are based on continuous viewing 3D contents. In this paper, we propose a method to evaluate visual fatigue through subjective scoring and objective measuring the physiological parameters during the continuous viewing 3D/2D movie. In the viewing, we test the objective and subjective indicators, including the heart rate (HR), blink frequency (BF) and percentage of eyelid closure over the pupil over time (PERCLOS) and the subjective scoring (SS). Before and after viewing the video, VRT, PMA and questionnaires are measured. Experimental results showed that the subjective score and objective indicates of visual fatigue increased gradually with viewing time although it was fluctuated. The symptoms of visual fatigue were generally more serious after viewing 3D movie than 2D ones. Based on the results above, a model was built to predict visual fatigue from HR and BF during continuous viewing 3D video processes.