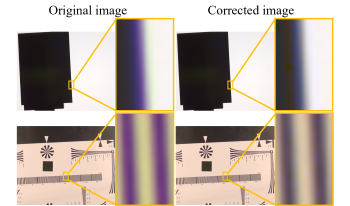
In digital cameras, the wavelength dependency of images captured through lenses and filters affects the spatial resolution characteristics of the images, which adversely impacts image quality. Previously, lens design and image processing techniques have been considered to address the aforementioned problem. Although aberrations could be improved, it was difficult to completely analyze the wavelength dependency of resolution characteristics. This study aims to reduce the wavelength dependency of the spatial resolution of digital cameras. Edge-based modulation transfer function (MTF) measurements using a 2D spectroradiometer were used to obtain wavelength-specific MTFs and quantitively reveal the wavelength dependency of the spatial resolution characteristics. Moreover, we experimentally confirmed that adjusting the MTFs of the CIEXYZ images obtained by combining spectral images to be closer reduces the difference in spatial resolution among color images while minimizing the color change before and after the adjustment.

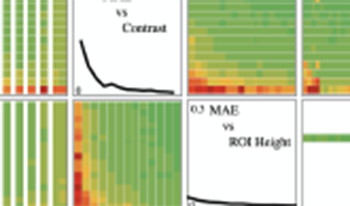
The edge-based Spatial Frequency Response (e-SFR) method was first developed for evaluating camera image resolution and image sharpness. The method was described in the first version of the ISO 12233 standard. Since then, the method has been applied in a wide range of applications, including medical, security, archiving, and document processing. However, with this broad application, several of the assumptions of the method are no longer closely followed. This has led to several improvements aimed at broadening its application, for example for lenses with spatial distortion. We can think of the evaluation of image quality parameters as an estimation problem, based on the gathered data, often from digital images. In this paper, we address the mitigation of measurement error that is introduced when the analysis is applied to low-exposure (and therefore, noisy) applications and those with small analysis regions. We consider the origins of both bias and variation in the resulting SFR measurement and present practical ways to reduce them. We describe the screening of outlier edge-location values as a method for improved edge detection. This, in turn, is related to a reduction in negative bias in the resulting SFR.

The edge-based Spatial Frequency Response (e-SFR) method is well established and has been included in the ISO 12233 standard since the first version in 2000. A new 4th edition of the standard is proceeding, with additions and changes that are intended to broaden its application and improve reliability. We report on results for advanced edge-fitting which, although reported before, was not previously included in the standard. The application of the e-SFR method to a range of edge-feature angles is enhanced by the inclusion of an angle-based correction, and use of a new test chart. We present examples of the testing completed for a wider range of edge test features than previously addressed by ISO 12233, for near-zero- and -45-degree orientations. Various smoothing windows were compared, including the Hamming and Tukey forms. We also describe a correction for image non-uniformity, and the computing of an image sharpness measure (acutance) that will be included in the updated standard.

The edge-based Spatial Frequency Response (e-SFR) is an established measure for camera system quality performance, traditionally measured under laboratory conditions. With the increasing use of Deep Neural Networks (DNNs) in autonomous vision systems, the input signal quality becomes crucial for optimal operation. This paper proposes a method to estimate the system e-SFR from pictorial natural scene derived SFRs (NSSFRs) as previously presented, laying the foundation for adapting the traditional method to a real-time measure.In this study, the NS-SFR input parameter variations are first investigated to establish suitable ranges that give a stable estimate. Using the NS-SFR framework with the established parameter ranges, the system e-SFR, as per ISO 12233, is estimated. Initial validation of results is obtained from implementing the measuring framework with images from a linear and a non-linear camera system. For the linear system, results closely approximate the ISO 12233 e-SFR measurement. Non-linear system measurements exhibit scene-dependant characteristics expected from edge-based methods. The requirements to implement this method in real-time for autonomous systems are then discussed.

The dead leaves pattern is very useful to obtain an SFR from a stochastic pattern and can be used to measure texture loss due to noise reduction or compression in images and video streams. In this paper, we present results from experiments that use the pattern and different analysis approaches to measure the dynamic range of a camera system as well as to describe the dependency of the SFR on object contrast and light intensity. The results can be used to improve the understanding of the performance of modern camera systems. These systems work adaptively and are scene aware but are not well described by standard image quality metrics.

Simulation is an established tool to develop and validate camera systems. The goal of autonomous driving is pushing simulation into a more important and fundamental role for safety, validation and coverage of billions of miles. Realistic camera models are moving more and more into focus, as simulations need to be more then photo-realistic, they need to be physical-realistic, representing the actual camera system onboard the self-driving vehicle in all relevant physical aspects – and this is not only true for cameras, but also for radar and lidar. But when the camera simulations are becoming more and more realistic, how is this realism tested? Actual, physical camera samples are tested in laboratories following norms like ISO12233, EMVA1288 or the developing P2020, with test charts like dead leaves, slanted edge or OECF-charts. In this article we propose to validate the realism of camera simulations by simulating the physical test bench setup, and then comparing the synthetical simulation result with physical results from the real-world test bench using the established normative metrics and KPIs. While this procedure is used sporadically in industrial settings we are not aware of a rigorous presentation of these ideas in the context of realistic camera models for autonomous driving. After the description of the process we give concrete examples for several different measurement setups using MTF and SFR, and show how these can be used to characterize the quality of different camera models.

The ISO 12233 standard for digital camera resolution includes two methods for the evaluation of camera performance in terms of a Spatial Frequency Response (SFR). In many cases, the measured SFR can be taken as a measurement of the camera-system Modulation Transfer Function (MTF), used in optical design. In this paper, we investigate how the ISO 12233 method for slantededge analysis can be applied to such an optical design. Recent improvements to the ISO method aid in the computing of both sagittal and tangential MTF, as commonly specified for optical systems. From computed optical simulations of actual designs, we apply the slanted-edge analysis over the image field. The simulations include the influence of optical aberrations, and these can present challenges to the ISO methods. We find, however, that when the slanted-edge methods are applied with care, consistent results can be obtained.

The Modulation Transfer Function (MTF) is a wellestablished measure of camera system performance, commonly employed to characterize optical and image capture systems. It is a measure based on Linear System Theory; thus, its use relies on the assumption that the system is linear and stationary. This is not the case with modern-day camera systems that incorporate non-linear image signal processes (ISP) to improve the output image. Nonlinearities result in variations in camera system performance, which are dependent upon the specific input signals. This paper discusses the development of a novel framework, designed to acquire MTFs directly from images of natural complex scenes, thus making the use of traditional test charts with set patterns redundant. The framework is based on extraction, characterization and classification of edges found within images of natural scenes. Scene derived performance measures aim to characterize non-linear image processes incorporated in modern cameras more faithfully. Further, they can produce ‘live’ performance measures, acquired directly from camera feeds.

Measuring the MTF of an imaging system at its operational working distance is useful for understanding the system’s use case performance. However, it is often not practical to test imaging systems at long distances (several meters to infinity), particularly in a production environment. Intermediate optics (relay lenses) can be used to simulate longer test distances. The Imatest Collimator Fixture is a machine developed for testing imaging systems at specified simulated distances up to infinity through the use of a relay lens and a test chart. The relay lens’s optical properties dictate the required distance between the optic and the test chart, or Collimator Working Distance (WDC), to project the correct simulated distance (SD). This paper provides a method for validating the accuracy of simulated test distances. Successful validation is achieved when the distances at which peak MTF occurs in the real world match the simulated distances at which peak MTF occurs on the collimator fixture, or if both distances are within the depth of field (DoF) of the imaging system in use.

Objective measurements of imaging system sharpness (Modulation Transfer Function; MTF) are typically derived from test chart images. It is generally assumed that if testing recommendations are followed, test chart sharpness (which we also call “chart quality”) will have little impact on overall measurements. Standards such as ISO 12233 [1] ignore test chart sharpness. Situations where this assumption is not valid are becoming increasingly frequent, in part because extremely high-resolution cameras (over 30 megapixels) are becoming more common and in part because manufacturing test stations, which have limited space, often use charts that are smaller than optimum. Inconsistent MTF measurements caused by limited chart sharpness can be problematic in manufacturing supply chains that require consistency in measurements taken at different locations. We describe how to measure test chart sharpness, fit the measurement to a model, quantify the effects of chart sharpness on camera system MTF measurements, then compensate for these effects using deconvolution–by dividing measured system MTF by a model of the chart MTF projected on the image sensor. We use results of measurements with and without MTF compensation to develop a set of empirical guidelines to determine when chart quality is • good enough so that no compensation is needed, and • too low to be reliably compensated.