Back to articles
Remote Research Special Issue
Volume: 7 | Article ID: 000407
Image
Uncovering Cultural Influences on Perceptual Image and Video Quality Assessment through Adaptive Quantized Metric Models
  DOI :  10.2352/J.Percept.Imaging.2025.7.000407  Published OnlineApril 2025
Abstract
Abstract

Evaluating perceptual image and video quality is crucial for multimedia technology development. This study investigated nation-based differences in quality assessment using three large-scale crowdsourced datasets (KonIQ-10k, KADID-10k, NIVD), analyzing responses from diverse countries including the US, Japan, India, Brazil, Venezuela, Russia, and Serbia. We hypothesized that cultural factors influence how observers interpret and apply rating scales like the Absolute Category Rating (ACR) and Degradation Category Rating (DCR). Our advanced statistical models, employing both frequentist and Bayesian approaches, incorporated country-specific components such as variable thresholds for rating categories and lapse rates to account for unintended errors. Our analysis revealed significant cross-cultural variations in rating behavior, particularly regarding extreme response styles. Notably, US observers showed a 35–39% higher propensity for extreme ratings compared to Japanese observers when evaluating the same video stimuli, aligning with established research on cultural differences in response styles. Furthermore, we identified distinct patterns in threshold placement for rating categories across nationalities, indicating culturally influenced variations in scale interpretation. These findings contribute to a more comprehensive understanding of image quality in a global context and have important implications for quality assessment dataset design, offering new opportunities to investigate cultural differences difficult to capture in laboratory environments.

Subject Areas :
Views 26
Downloads 5
 articleview.views 26
 articleview.downloads 5
  Cite this article 

Dietmar Saupe, Simon Hviid Del Pin, "Uncovering Cultural Influences on Perceptual Image and Video Quality Assessment through Adaptive Quantized Metric Modelsin Journal of Perceptual Imaging,  2025,  pp 1 - 13,  https://doi.org/10.2352/J.Percept.Imaging.2025.7.000407

 Copy citation
  Copyright statement 
This work is licensed under the Creative Commons Attribution 4.0 International License. To view a copy of this license, visit http://creativecommons.org/licenses/by/4.0/.
  Article timeline 
  • received March 2024
  • accepted December 2024
  • PublishedApril 2025

Preprint submitted to:
jpi
Journal of Perceptual Imaging
J. Percept. Imaging
J. Percept. Imaging
2575-8144
Society for Imaging Science and Technology
1.
Introduction
Subjective image quality assessment involves observers rating sets of images, but beneath the surface lies a complex interplay of cultural influences on response styles. This study investigated cross-cultural differences in image quality assessment by examining whether observers from different countries demonstrate distinct tendencies when providing their ratings.
Several phenomena may lead to variations in how people interpret and utilize discrete rating scales such as Absolute Category Rating (ACR) and Degradation Category Rating (DCR), which are ordinal scales with five categories ranging from ‘bad’ to ‘excellent’ for ACR and from ‘imperceptible’ to ‘very annoying’ for DCR.
We developed and applied statistical models to explore nation-based differences in the use of the 5-level ACR and DCR scales for image and video quality assessment. Our study was based on data collected from observers of diverse countries who rated the same images or videos. Our objective was to uncover whether cultural nuances play a role in how observers tend to assign stimuli to given quality categories and to what extent extreme ratings are chosen.
Many subjective image and video quality assessment studies were carried out across several countries, either in different labs or on crowdsourcing platforms. The category labels for the responses of the subjects were uniformly presented in English for participants from all countries, or may have been adapted to the respective languages. In either case, the interpretation of the category labels may depend on the cultural background of the participants.
For example, an Italian observer might rate an image as ‘mediocre’ (level 2) on the Italian language ACR scale shown in Table I, but rate the same image as ‘fair’ (level 3) on an English language scale, despite the primary meaning of ‘mediocre’ being ‘poor’ (level 2). This is because ‘mediocre’ can also be translated as ‘moderate’ indicating ‘average in quality’, i.e., something that is neither particularly good nor particularly bad, which is just how ‘fair’ quality can be defined.
Table I.
Graphical scaling for the CCIR (Consultative Committee on International Radio) quality scale terms in two populations with different languages. Data from [16].
ACRUSItaly
OrdinalNameValueNameValue
5Excellent6.5 ± 0.6Ottimo6.4 ± 0.6
4Good4.9 ± 0.7Buono5.5 ± 0.7
3Fair3.5 ± 0.8Discreto4.3 ± 1.0
2Poor1.4 ± 0.6Mediocre1.9 ± 1.5
1Bad1.1 ± 0.6Cattivo1.5 ± 1.3
Thus, the interpretation of the terms for perceived quality on ACR and DCR scales can be influenced by language and culture. This was already investigated nearly 30 years ago in several studies using a technique known as graphic scaling. In [16], for example, subjects placed a marker for each of the terms on an interval scale with a length of 7.1 inches. Table I shows abridged results, demonstrating that the terms are anchored at different positions by two study groups of US and Italian citizens. Moreover, the labeled positions of the ACR categories are not evenly distributed on the interval scale. Other studies have confirmed this, e.g., for the Dutch-language terms [29].
Moreover, subjects from different cultural backgrounds may give different category ratings for the same stimulus, even when the perceived qualities are identical. For example, the chances for an image of very good quality to receive a rating ‘excellent’ could be much larger when asking subjects from one country than from another one.
Similarly, some people, due to cultural background or personal style, prefer choosing the most extreme option on the scale instead of more moderate middle responses. This is called an extreme response style. It means they are more likely to pick ‘bad’ or ‘excellent’ on the 5- point ACR scale rather than a mid-point response like ‘fair’ [6, 7, 9].
An extreme response style is not inherently positive or negative. However, it can lead to biases when comparing research findings across different cultures. If a particular group consistently leans towards extreme responses, it could distort the perceived cultural differences, making them appear larger or smaller than they truly are. A thorough understanding of response styles is crucial for the accurate interpretation of results. Perceived image and video quality is inherently subjective and cannot be directly measured. We therefore rely on latent variable models to infer perceived quality from observable data like subjective ratings. These models assume that an underlying latent variable, representing the viewer’s perceived visual quality of a stimulus, drives the observed ratings. This latent variable is influenced by objective factors like resolution or color fidelity. The observer’s judgement can also be shaped by subjective factors, including individual preferences and cultural background. Our study focuses on uncovering how cultural influences affect these judgements, leading to systematic differences in how viewers from different cultures interpret and use rating scales.
Our study is presented as follows. In the next section, we provide a brief overview of related work on cultural differences that focused on the use of rating categories. We then explain our main modeling tools, namely discrete models derived from quantized continuous models of perceived quality on a latent scale, which we adapt to examine national differences in rating behavior. We then explain the two computational approaches for these models, i.e., maximum likelihood estimation and cumulative link mixed effect models that are usually solved by Bayesian estimation. In Section 4, we present the previously published large datasets that we selected for our study and explain how we created more balanced subsets of them. Moreover, we provide details of the analysis of the complete datasets and their subsets using different models and reconstruction techniques. Section 5 presents the computational results of our models, focusing on adaptive country-specific thresholds for the rating categories and probabilities for extreme ratings. Before concluding, we point out the limitations of our study.
This article builds upon and extends our previous work presented in [23], “National differences in image quality assessment: An investigation on three large-scale IQA datasets,” at the 16th International Conference on Quality of Multimedia Experience (QoMEX 2024). In that study, we investigated nation-based differences in image and video quality assessment using large-scale crowdsourced datasets and adaptive quantized metric models. We explored country-specific variations in rating thresholds and extreme response styles using maximum likelihood estimation (MLE) on the full datasets. We extend that study to the present one in several key aspects. First, recognizing potential biases due to the unbalanced nature of the full datasets, we introduce carefully constructed balanced subsets of KonIQ-10k, KADID-10k, and NIVD. This allows for a more controlled comparison of rating behavior across countries. Second, in addition to MLE, we employ cumulative link mixed effects models (CLMMs) with Bayesian parameter estimation, offering an alternative robust and nuanced approach to analyzing ordinal rating data while accounting for dependencies within the data. Finally, we refine the taxonomy and presentation of the different modeling approaches, providing a clearer and more comprehensive overview of the methodologies employed.
Frequently used acronyms
ACRAbsolute category rating
DCRDegradation category rating
VASVisual analog scale
MOSMean opinion score
NIVDNetflix International Video Dataset
KonIQ-10kKonstanz Image Quality Dataset
KADID-10kKonstanz Artificially Distorted Image Quality
Database
MLEMaximum likelihood estimation
CLMMCumulative link mixed effects models
2.
Related Work Regarding Cultural Differences in Perceptual Rating Categories
Cultural effects are expressed in international image quality assessment studies using CCIR terms (Consultative Committee on International Radio, founded 1927). However, little work has been done to extract national differences. An international study [21] did not determine any apparent influence of language or culture on the Mean Opinion Score (MOS) from ACR of audio-visual stimuli.
Scott et al. [25] investigated how personality and cultural traits influenced the perception of multimedia quality. Their study used a dataset of 144 video sequences rated by 114 participants from diverse cultural backgrounds. Analysis showed that personality and cultural traits accounted for 9.3% of the variance in perceived quality, a significant proportion compared to system factors. Specifically, cultural dimensions like individualism, masculinity, uncertainty avoidance, and indulgence showed correlations with perceived quality and enjoyment, highlighting the impact of national cultural differences on subjective video quality experiences. The study underscored the importance of considering individual and cultural factors in multimedia quality assessments.
Recently, Bampis et al. created a much larger video quality dataset (NIVD) by collecting ratings from 12,812 people of four countries [1]. The work focused on how different spatial video resolutions and screen sizes affected perceived quality. Few scatter plots showed that there were nation-based differences. The authors suggested development of better subject models to reduce cross-national biases, which would aggregate the data across countries appropriately. Their NIVD dataset has been made publicly available and has been used in our study.
Extreme response styles can vary across cultures. For example, participants from individualistic cultures, like the US, are often more inclined towards extreme responses than those from collectivist cultures, like East Asian countries [4, 5, 10]. Even within the US, there are differences in extreme response styles among different ethnic groups [6, 11]. In a study by Zax and Takahashi (1967), it was determined that US respondents were 41% more likely to select the extreme responses compared to Japanese respondents (19.2% versus 13.6% respectively). Conversely, Japanese respondents selected the neutral response 33% more frequently (23.2% versus 17.4%) [34].
In another study by Chen, Lee, and Stevenson (1995), respondents from four cultures were found to make differential use of certain points on scales. Japanese and Chinese students were more likely than US and Canadian students to select midpoints; US students, more frequently than Japanese, Chinese, or Canadian students, selected the extreme values [4].
The design of questionnaires can also impact the prevalence of extreme response styles. Adjustments such as modifying the number of response options, altering the phrasing of questions, or changing the response format can reduce a scale’s sensitivity to a respondent’s cultural inclinations [6, 13].
Given the large Japanese and American subsamples in the NIVD dataset, we focus our examination on whether these previously documented cultural differences in extreme response styles manifest in these video quality ratings.
3.
Adaptive Quantized Metric Models
By nature, perceived image or video quality is a latent variable. It cannot be measured directly, but must be inferred by a mathematical model from responses of subjects who judge the quality of the stimuli in an experiment. In these models, latent variables are commonly treated as continuous normally distributed variables. Such models were introduced by Thurstone in 1927 [30] and are referred to as Thurstonian.
Likert items, commonly used in research to collect subjective judgments, provide ordinal data often summarized as a metric model by per-item means and standard deviations. For example, the five ACR categories are commonly interpreted as values 1,2, …, 5 on an interval scale, i.e., the categories are not only ordered but also have values that are evenly spaced. The mean opinion score (MOS) is the average of the collected ratings for a stimulus. It follows that the MOS is the maximum likelihood estimate (MLE) of the mean of the corresponding normally distributed random variable [18].
In a recent study, Liddell and Kruschke found for three top-tier journals in psychology that treated ordinal data as interval/ratio scale data is the rule rather than the exception [19]. However, this approach may lead to erroneous conclusions due to the inherent unequal distances between categories and the different variances of stimulus ratings. Metric models combined with statistical tests such as the t-test may fail to detect existing differences between stimulus qualities, lead to reversals in the ranking of quality estimates, and produce unreliable effect size estimates. The debate about the validity of applying metric models to discrete, categorical data is not new. It has been going on for decades in many areas of science, as elucidated by Seufert [26].
As in psychology, the vast majority of data analyses for ACR/DCR data in quality of experience research to date have used the metric modeling approach, i.e. reporting the MOS values and occasionally the variances. In addition, such methods are recommended in the published standards of the International Telecommunication Union [14].
In this study, we depart from this position and apply ordinal statistical models derived from quantized metric models, which are outlined in this section and elaborated in Sections 4.2 and 4.3. We thus follow the conclusion of Liddell and Kruschke [19]: “Because it is impossible to know in advance whether or not treating a particular ordinal dataset as metric would produce a different result than treating it as ordinal, we recommend that the default treatment of ordinal data should be with an ordinal model”. Another, equally important reason is that our adaptive quantized metric models permit inclusion of country-specific components that can better explain the differences between groups than simply comparing their MOS.
As an alternative to MOS, Liddell and Kruschke proposed the use of cumulative ordinal models. In these models, a continuous cumulative density function of perceived quality is thresholded at multiple values, which yields the modeled probabilities of the rating categories.
This approach can also be described as a quantized metric model based on continuous distributions that model the perceived stimulus quality on the latent scale (Figures 1 and 2). The probabilities for the rating categories are determined by quantizing the corresponding random variable using fitted thresholds. These thresholds when used in quantization permit consideration of potential nonlinear associations between ordinal data and the latent quality scale, providing a more accurate interpretation of the ordinal data.
Figure 1.
The quantized metric model for perceived quality. The probabilities for the ACR ratings ‘poor’ to ‘excellent’ can be modeled in a two-stage process. The latent perceived quality is assumed to be a normally distributed random variable parameterized by its mean and variance. Second, the random variable is quantized into ACR categories that correspond to successive intervals on the quality scale and are separated by thresholds τ1 < ⋯ < τ4. The probabilities of an ACR classification are indicated by the areas under the curve in the corresponding interval. Here, the mean value is 3.0 and the probability of a ‘fair’ rating (3) is the highest.
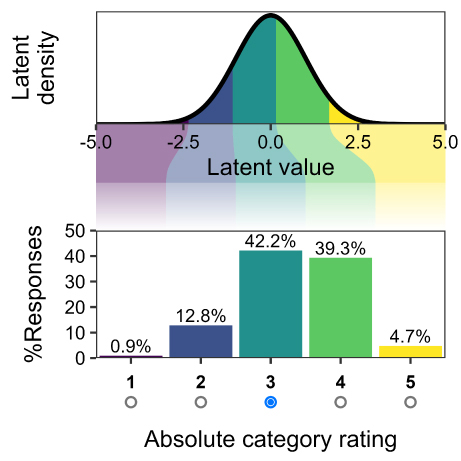
Figure 2.
The quantized metric model as viewed in cumulative models with random effects. The figure shows how a typical person from the US would rate a typical video in the NIVD dataset. For a concrete video stimulus, the distribution would be shifted left or right by the value of an appropriate intercept. The figure is based on code provided by [28].
There is a fundamental difference between a metric model and a quantized one: The metric model specifies the likelihood of a rating as the corresponding density value of the continuous distribution [14, 18], while the cumulative ordinal model specifies the probability of an ACR-type rating as the integral of the density function over the interval corresponding to the rating. This integral is equal to the difference between the values of the cumulative density function at the boundaries of the interval.
To account for the effect that the ACR categories may not be equally spaced on the quality scale, we let the thresholds define intervals of different widths. For the five categories this yields a sequence of five successive intervals that partition the real number line, as shown in Figs 1 and 2. For a given number of observers and a set of stimuli, the corresponding statistical model is given by the mean and variance for each stimulus and the list of thresholds as intercepts in a cumulative model that separate the category intervals in the figures.
The quantized metric model was introduced by Thurstone in his lectures in the framework of his Law of Categorical Judgement. It was first reported by Saffir in 1937 [22] titled as Method of Successive Intervals. In the following years, a number of techniques were developed to solve the system of equations for the parameters that arises with the approach, the most prominent ones being least-squares methods. The standard reference is Torgerson’s book [31]. (The Law of Categorical Judgement is more general by letting the thresholds be random variables instead of fixed numbers. However, this allows the order of the thresholds to vary which complicates theory and algorithms.)
A quantized metric model is probabilistic by definition and gives rise to two natural computational approaches to estimate their model parameters. The first one is maximum likelihood estimation (MLE), and the other is Bayesian estimation. Only when electronic computing machinery became available, it became practical to consider MLE to estimate the model parameters. Schönemann and Tucker were the first to develop this method, in 1967, including an implementation on an ILLIAC supercomputer [24]. In this study, we apply both estimation methods.
The quantized metric model as applied for Bayesian estimation of cumulative models with random effects (Fig. 2) is very similar to the standard one using MLE (Fig. 1). The probability of observing a given ACR response is the probability of a value being drawn from the latent zero-mean distribution within that response’s region. Several factors such as the stimulus and the subject for the rating may shift the mean (and additionally change the variance) of the continuous distribution. In contrast to the previous models, these effects are taken to be ‘random’, averaging to zero. Therefore, latent values are spread around zero. For example, the figure presents our model’s estimates for the US, accounting for variability across videos and raters. It shows how a typical person from the US would rate a typical video in the NIVD dataset. For a concrete video stimulus, the distribution would be shifted left or right by the value of an appropriate intercept. The density plot shows latent values, and the bar graph shows response percentages, with a central tendency towards rating 3. This visualization highlights the model’s ability to disentangle rating tendencies and make reliable cross-cultural inferences.
Two recent articles have built on this approach to demonstrate how Bayesian cumulative link mixed models (CLMMs) can be applied to provide more principled norms from ordinal rating data [3, 28]. CLMMs extend the basic cumulative link model by allowing random effects that capture dependencies in the data due to clustered observations (e.g. by participants or items). Taylor et al. [28] posited that CLMMs should be used to calculate rating norms from ordinal data, rather than taking means of the ratings directly. Their simulations showed that CLMMs can determine latent means and standard deviations for items in a way that is disentangled from overall response patterns and biases in the ratings.
The CLMM framework offers additional flexibility to estimate discrimination (i.e. variance) parameters that allow item differences in latent variance as well as means [3]. CLMMs make fewer assumptions about the shape of the underlying latent distribution compared to traditional modeling approaches. Overall, CLMMs provide a powerful and flexible tool to analyze ordinal data, accounting for overall response patterns and dependencies to yield more appropriate item-level estimates [28]. Given the widespread collection and analysis of ordinal ratings across psychological research, these advantages of CLMMs represent an important methodological consideration.
Similar cumulative models have only been used in few studies to estimate the quality of experience (QoE). In [15, 27], the effect of several factors such as channel bandwidth, link capacity, task content, user bias, and gender on QoE was studied. Another study [8] analyzed the non-linear usage of ACR scales using CLMMs, but did not investigate changes in rating thresholds.
In this study, we applied quantized metric models to investigate potential nation-based differences in perceptual image and video quality assessment. Specifically, we fitted such models using maximum likelihood estimation or Bayesian hierarchical regression to incorporate country-specific components. People from different cultural or national backgrounds may associate the rating categories with different intervals on the scale of perceptual quality. Thus, our main mechanism to account for country-specific differences in rating behavior was to adapt the thresholds and intercepts for each country. In this approach, we assume that the quality of a each image or video stimulus on the latent scale is a fixed value. Then the differences between countries in the adjusted thresholds imply different probabilities for the ACR/DCR categories. In addition, we also adapted other parameters in a similar way. For example, the variance parameter (dispersion) of ratings was adapted per country.
Extreme response style refers to individuals with a preference for choosing options at the extreme ends of the rating scales, which are influenced by cultural backgrounds and personal styles. To examine country-specific extreme response styles, we extracted the probabilities of extreme ratings from the results of our models fitted to the data. We also compared the empirical proportions of extreme ratings between countries.
An additional, technical contribution is the adoption of a lapse rate. When reconstructed by MLE, a stimulus of high quality can result in a probability for the low category ‘bad’ that is almost equal to zero. According to the model, a ‘bad’ rating is therefore extremely unlikely. In practice, however, such ratings can occur if subjects are momentarily inattentive and make a wrong decision, or if they accidentally press the wrong answer key even though they had made a correct decision (a ‘finger error’). These lapses have an inappropriate influence on the MLE of the model parameters and distort the model parameters, which impairs the model quality. A lapse rate introduces a small prior probability for all categories, which is then combined with the evidence, i.e. the ratings in the experiment. This helps to mitigate the negative effects of lapses. Lapse rates are often used in cognitive science to fit models of psychometric functions  [32], but have not yet been considered for reconstructions by MLE from ACR/DCR response data.
4.
Materials and Methods
This section details the datasets and the statistical models used to extract country-specific traits in image and video quality assessment.
4.1
Datasets
To ensure statistical evidence of our results, we focused on three datasets with large numbers of ratings from a diverse range of countries. KonIQ-10k [12] and KADID-10k [20] were collected via crowdsourcing, attracting participants from over 70 countries, with the largest contributions coming from Russia (KonIQ-10k), Venezuela, Egypt, and India (KADID-10k). The NIVD dataset [1], by focusing on four key countries (Japan, Brazil, the US, and India) and having the largest population of observers, offered the greatest potential for a cross-cultural analysis. Table II lists the dataset summaries. The first two are image quality datasets; KonIQ-10k uses no-reference IQA with ACR, and KADID-10k uses full-reference IQA with DCR. NIVD is a video quality dataset assessed on a visual analog scale (VAS). The nationality was unknown for a few subjects, so we removed their ratings from the datasets.
Table II.
Overview of datasets. The average number of ratings per image, subject, and country are given.
DatasetKonIQ-10kKADID-10kNIVD
Reference/year[12]/2020[20]/2019[1]/2023
Rating typeACRDCRVAS
Full setSubsetFull setSubsetFull setSubset
Images or videos10076168110858918601488
Subjects12613512212921281212812
Countries75272244
Ratings/stimulus107.045.435.323.2265.3302.5
Ratings/subject854.821.7176.922.438.535.1
Ratings/country14372.83810.55435.81031.5123368112543
Ratings total107796076213913762063493472450172
Table III provides a more detailed breakdown of the major contributing countries for each dataset. The ‘Other’ category in this table represents the combined contributions from the remaining countries, which include various European nations, South American countries, and other regions of East Asia.
Table III.
The countries with most ratings per dataset.
DatasetCountrySubjectsStimuliRatings
India35910074423400
KonIQ-10kVenezuela21210074129236
Full setRussia66987162077
Serbia62988449428
Other56310076413819
KonIQ-10kIndia2131683940
SubsetVenezuela1381683681
Venezuela133211085269923
KADID-10kEgypt97598017326
Full setIndia83585411784
Russia4851229797
Other6521107082636
KADID-10kVenezuela68891271
SubsetEgypt2489792
Japan32981860129244
NIVDBrazil32641860127720
Full setUS32871860124308
India29631860112200
Japan32981488108164
NIVDBrazil32641488121620
SubsetUS32871488111328
India29631488109060
KonIQ-10k and KADID-10k were collected by crowdsourcing without restrictions. This means that subjects from any country were accepted as long as they met the qualification requirements. For both datasets, subjects from over 70 countries contributed. For many of these countries, only very few subjects are included in the dataset. In addition, there was no fixed number of stimuli that a respondent could rate. Therefore, the resulting ratings are not evenly distributed across the test subjects and countries.
A key challenge in analyzing large-scale crowdsourced datasets like KonIQ-10k and KADID-10k is the sparse and uneven distribution of ratings. A single image may have received numerous ratings from one country but none from another, hindering reliable estimation of country-specific effects. To address this, we created balanced subsets focusing on a smaller set of images with more comparable numbers of ratings across selected countries. This balancing improves the statistical power for estimating country-specific parameters, enabling more robust cross-cultural comparisons.
For this reason, we considered two approaches in our analysis of KonIQ-10k and KADID-10k, which differ in the scope and balance of the ratings between countries and images. In the first approach, we considered all available ratings. However, we focused on the four countries that provided the most ratings and grouped the remaining ratings into a fifth category labeled ‘Other’. A summary of the resulting breakdown into five categories is shown in Table III, which shows that even between the four countries with the most subjects and ratings, there are significant differences in the numbers or ratings.
Therefore, in our second approach, we limited the dataset to only two countries for KonIQ-10k and KADID-10k, and to obtain a more balanced, albeit much smaller, subset. To this end, we applied the following criteria to the first dataset, KonIQ-10k.
(1)
Selection of countries. We identified the two countries with the most ratings: India and Venezuela. To ensure a balanced representation, we first selected 4500 images with the most ratings from the country with the second highest ratings (Venezuela). We then extracted the ratings for the same images from the country with the most ratings (India). In this way, we obtained similar number of ratings for both countries.
(2)
Balance. To create a balanced dataset, we attempted to source an equal proportion of ratings from India and Venezuela for each image. We calculated the total number of ratings and the number of ratings from India for each image. We then calculated the proportion of ratings from India for each image.
(3)
Optimization. We defined an objective function that calculated the absolute difference between the mean proportion of Indian ratings and 0.5 (the target value for a perfectly balanced dataset). Using a genetic algorithm (package GenSA [33]), we optimized the selection of images to minimize this objective function. The optimization process was aimed for 200 images but the result was a subset of 168 images with a mean proportion of Indian ratings close to 0.5.
(4)
Final dataset. The optimized subset of 168 images, along with their respective ratings from India and Venezuela, formed the final balanced dataset for analysis.
For the KADID-10k dataset, we proceeded similarly but achieved less balance between the countries. The resulting balanced subsets are also listed in Table III.
In contrast to the first two datasets, the Netflix International Video Dataset (NIVD) was developed to capture country-specific differences by collecting an almost equal number of ratings from only four selected countries. The ratings in NIVD were acquired using the SAMVIQ scheme, i.e., a visual analog scale was used together with tick marks and the descriptive ACR labels positioned at 0, 25, 50, 75, and 100% of the interval scale.
However, despite the continuous nature of the data collection on an interval scale, the resulting score distributions could not be considered normally distributed. This is evident from the overall histogram of all ratings together, which is shown in Figure 3. This histogram shows pronounced peaks at positions 0, 25, 50, 75 and 100 percent of the VAS scale, indicating that the subjects generally preferred the ACR labels that were printed at these positions and gave a discrete ACR scale rating instead of a continuous interval scale rating.
Figure 3.
Histogram of ratings in NIVD, showing the quantization of the percentages of the VAS to the five ACR categories.
Therefore, we quantized the continuous VAS scores into integer ACR scores, as shown in Fig. 3, using thresholds midway between the tick marks, i.e., at 12.5, 37.5, 62.5 and 87.5 percent of the scale. We then applied the same methods of discrete data analysis as for the other two datasets.
The NIVD dataset showed an excellent balance between the countries and the video stimuli. However, there were several videos with fewer ratings. Removing these stimuli and only keeping those with over 200 ratings created the balanced NIVD subset summarized in Table III.
To summarize, we compiled three large datasets, each in two versions. The first version consisted of the full datasets with grouped countries that submitted fewer ratings than the four most common ones. The second set consisted of subsets that were more balanced but much smaller. (The anonymized datasets are available, with annotations by subjects and their nationalities, at database.mmsp-kn.de/vqacountry-database.html.)
For data analysis of ACR/DCR data, we applied MLE of the parameters for our models to the larger versions of the datasets. For the smaller, more balanced datasets, we applied CLMMs with Bayesian parameter estimation. Bayesian estimation for the models of the complete datasets with more than 10,000 parameters would have been computationally intensive to apply.
4.2
Adaptive Quantized Metric Model with Lapse Rate
The common statistical models for the perceived quality of sensory stimuli assume a one-dimensional latent quality scale of real numbers that is shared by all subjects, but not directly observable. The actual responses in a subjective experiment are also influenced by the decisional process that is modulated by personal and cultural influence. In addition, a third layer given by errors in the physical action of communicating the decision by, e.g., a mouse click, may distort the decided rating (so-called finger errors or lapses).
A stimulus j corresponds to a particular value ψjR on the real latent quality scale. The quality as perceived by a subject is modeled by a random variable Uj. In the most basic model, Uj is chosen with a normal distribution centered at the latent quality value ψj and with a global variance σ2 that applies to all stimuli. With this setting, we have
(1)
Uj=ψj+σW
where Uj is the random variable producing the observed opinion score for stimulus j, and W is a Gaussian random variable WN(0,1). σ > 0 is the standard deviation of Uj and determines the spread of the random variable uj.
To account for the finite discrete nature of ACR-type data with K = 5 categories, we sort the real values of Uj into K successive intervals. For this purpose, we introduce a monotonic sequence of thresholds τ = (τ0, …, τK),
(2)
=τ0<τ1<<τK1<τK=,
and define the quantization function Qτ:R{1,,K} by
(3)
Qτ(u)=kτk1u<τk.
Given a metric model for the j-th stimulus in the form of a continuous random variable Uj, we define the corresponding quantized metric model by the discrete random variable Qτ(Uj). In addition to the quantization, we take into account a small lapse rate 0 ≤ λ ≪ 1. This yields a discrete random variable V j that determines the probability of a rating for category k as
(4)
Pr[Vj=k]=(1λ)(Gψj,σ(τk)Gψj,σ(τk1))+λK
where Gψj, σ denotes the Gaussian cumulative density function with mean ψj and variance σ2. Thus, with zero lapse rate, Pr[V = k] is just the area under the Gaussian between the thresholds τk and τk−1, as shown in Fig. 1.
The above model cannot yet distinguish between ratings from different nationalities. To achieve this, we adopted the following parameters separately for each country: the rating spread σ, the lapse rate λ, and the category thresholds τ1, . . . , τ4. Thus, the total number of parameters was equal to the number of stimuli plus six times the number of countries.
For optimization, we applied an interior point algorithm, implemented in the MATLAB function fmincon.
4.3
Cumulative Link Mixed Effects Models
For the larger datasets KonIQ-10k and KADID-10k, we had over 10,000 parameters to estimate from about one half to a whole million ratings. For problems of this size, Bayesian estimation takes a very long time (several days on a personal computer or laptop). Therefore, for Bayesian estimation, we computed the parameters only for the smaller balanced subsets.
Cumulative ordinal models are designed for ordered categorical data like ratings, where the intervals between categories may not be equal. They model the cumulative probability of a response being at or below a certain category, e.g., the probability of a rating being ‘poor’ (2) or ‘bad’ (1). This approach respects the ordered nature of the data without assuming equal spacing between categories, unlike metric models. In our Bayesian framework, we used these models to estimate the probabilities of each rating category and the thresholds separating them on the underlying latent scale.
It also evaluates group-level effects, which include random intercepts for items, permitting each item to have its unique distribution along the latent dimension. Additionally, it can incorporate random intercepts for raters, addressing individual biases in how raters map their assessments onto the ordinal scale.
By modeling these group-level effects, the hierarchical CLMM accounts for variability from the stimuli and raters, enhancing the accuracy of threshold estimates. This facilitates reliable inferences about differences in how the ordinal rating scale is interpreted across groups.
We utilized the Bayesian BRMS [2] package for R to fit CLMMs to the ordinal rating data of the smaller data subsets. CLMMs are hierarchical and can account for dependencies and variability in the data due to clustered observations, such as multiple ratings from the same subject, the same country, or for the same image/video.
For the balanced KonIQ-10k and KADID-10k subsets, the models were defined as:
rate |thres (4,gr =country)1+(1|image)
These models estimated four category thresholds per country and incorporated random intercepts for each image, accounting for variations in the perceived quality of different images. We only estimated the effect of images due to the low level of ratings from each individual rater.
For the balanced NIVD subset, the CLMM was defined as:
rate |thres (4,gr=country)1+(1|video)+(1|subject).
This model estimated four category thresholds (separating the five rating levels) for each country. It also included random intercepts for both videos and raters, allowing for variation in rating tendencies across different videos and individual raters. Note that the total number of parameters, even for this slightly smaller balanced subset, is larger than 14,000. Therefore, the computations took exceptionally long, nearly two days.
5.
Results
5.1
Data Analysis of the Original Datasets using Maximum Likelihood Estimation
The results of the data analysis using the quantized metric models with successive intervals is shown in Table IV and Figure 4. The scale values for stimuli were also estimated, but are not shown here to keep the focus on the country-specific differences.
Table IV.
Results for the full datasets with 95% confidence intervals, compare with Figure 4. The most important results are the category thresholds that define the intervals on the latent quality scale corresponding to the five categories.
DatasetCountryStd deviationLapse rateCategory thresholds
σλτ1τ2τ3τ4
India0.5050 ± 0.00160.0039 ± 0.00041.3867 ± 0.00712.3608 ± 0.00283.4061 ± 0.00224.6590 ± 0.0087
Venezuela0.4179 ± 0.00220.0078 ± 0.00111.6998 ± 0.00862.5069 ± 0.00423.2330 ± 0.00334.1030 ± 0.0064
KonIQ-10kRussia0.3813 ± 0.00300.0038 ± 0.00111.7161 ± 0.01162.5190 ± 0.00583.2646 ± 0.00454.2292 ± 0.0119
Images, ACRSerbia0.3811 ± 0.00350.0087 ± 0.00181.7089 ± 0.01382.5043 ± 0.00663.2889 ± 0.00514.1533 ± 0.0116
Other0.4132 ± 0.00120.0053 ± 0.00051.6536 ± 0.00502.5007 ± 0.00233.2752 ± 0.00194.2205 ± 0.0044
Venezuela0.6372 ± 0.00240.0065 ± 0.00091.7941 ± 0.00472.7047 ± 0.00363.2799 ± 0.00364.1751 ± 0.0045
Egypt0.6910 ± 0.01040.0105 ± 0.00421.5611 ± 0.02182.7732 ± 0.01473.2528 ± 0.01474.4835 ± 0.0211
KADID-10kIndia0.6442 ± 0.01200.0144 ± 0.00561.7302 ± 0.02402.8174 ± 0.01783.3726 ± 0.01794.4110 ± 0.0240
Images, DCRRussia0.5403 ± 0.01110.0058 ± 0.00381.8995 ± 0.02212.7440 ± 0.01853.3349 ± 0.01834.1006 ± 0.0208
Other0.6013 ± 0.00430.0125 ± 0.00191.8659 ± 0.00822.7664 ± 0.00653.3550 ± 0.00654.1922 ± 0.0080
Japan0.7028 ± 0.00380.0356 ± 0.00261.8249 ± 0.00792.8243 ± 0.00543.7092 ± 0.00564.5132 ± 0.0084
NIVDBrazil0.6343 ± 0.00350.0353 ± 0.00271.8820 ± 0.00712.6355 ± 0.00493.3261 ± 0.00494.1522 ± 0.0068
Videos, ACR/VASUS0.7603 ± 0.00440.0543 ± 0.00361.6418 ± 0.00912.4355 ± 0.00593.1706 ± 0.00554.1098 ± 0.0075
India0.7467 ± 0.00440.0416 ± 0.00331.5897 ± 0.00992.4910 ± 0.00613.2721 ± 0.00584.2185 ± 0.0082
Figure 4.
Country-specific thresholds estimated with maximum likelihood estimation (MLE). For the numerical values and confidence intervals, see Table IV. Direct comparisons of countries between experiments are not recommended due to variations in experimental design, including differences in stimuli (videos versus images) and task formats (ACR versus DCR).
Clearly, most thresholds τk, and also the standard deviations and lapse rates, significantly differ between countries. For example, in the first two rows of the table for the KonIQ-10k ratings of India and Venezuela, all parameters differ between the countries without overlap of 95% confidence intervals.
These results are elucidated by considering an example in detail (Figure 5). In NIVD, the video 964 was scaled by the statistical model at quality μ = 4.360. The distribution of the latent perceived video quality corresponded to the model parameters for Japan and the US (lines 11 and 13 in Table IV). Based on the assumption of a globally unique perceived quality, we have that for all countries, the mean of the distribution is at μ = 4.360. The dispersion of the qualities, the lapse rates, and the ACR category thresholds are different between countries, though. This implies that probabilities for the ACR categories also differ between the countries. These are shown in table included in 5.
Figure 5.
Results of the model with successive intervals for the video stimulus numbered 964 in the Netflix International Video Dataset, shown for Japan and US. The category thresholds τ2, τ3, and τ4 for the subjective ratings of the perceived quality in Japan are larger than those in the US. In effect, according to the statistical model, the sampled US population generally preferred higher ACR ratings for the video stimuli in NIVD. The table shows the numerical values of the resulting probabilities of the ACR categories for this example. Each of the model probabilities is the corresponding area under the curves plus 1/5 of the lapse rate (0.0356 for Japan and 0.0543 for the US), see Equation (4). For comparison, the fractions of the collected VAS ratings that were quantized to ACR for this study are shown.
The table also confirmed that for this example that the model presents an accurate fit to the collected ratings. The corresponding probabilities for the five categories are close to each other; the measured MOS from the collected ratings differs from the predicted MOS of the model by only about 0.5%.
The estimated lapse rates generally are very small, around 1% for the assessment of the two image datasets, and 3 to 5 % for the video dataset. The larger values for NIVD could be attributed to the more complicated SAMVIQ user interface that was applied for this dataset [1]. Participants evaluated the videos in groups of five by interactively selecting which video to play and rated the visual quality using four sliders. Moreover, they were also allowed to modify their votes as many times as they wished.
The country specific differences are even smaller and probably not influential even though statistically significant in some cases. Wichmann and Hill  [32] have cautioned that the lapse parameter is, in general, not a very good estimator of the subjects’ true lapse rate. Thus, we hesitate to interpret these differences and would recommend for future studies to use only a single global lapse rate for each dataset.
5.2
Data Analysis of the Balanced Datasets using Bayesian Estimation
The results from the CLMMs are shown in Table V and Figure 6. They confirm that for the smaller balanced data subsets, the estimated thresholds, which demarcate the boundaries between successive ordinal rating categories, vary by country. For example, consider the quality of a video stimulus from the NIVD dataset for which the probability is at least 50% to obtain a rating of ‘excellent’. For observers from the US a video quality of only 1.67 on the CLMM scale was sufficient for that, while for Japanese viewers, the video quality had to be at least 2.45. This is a significant difference, corresponding to roughly one half on the 5-level ACR scale.
Figure 6.
Country-specific thresholds estimated with CLMMs. This figure displays the threshold estimates of image ratings for six countries, derived from balancing three quality databases. Each point represents an estimate, with horizontal lines indicating the 95% confidence intervals. The model accounts for variability in rating tendencies across images for all datasets and additionally, raters for only the NIVD dataset, estimating cultural differences in rating scale usage. We again discourage direct comparisons across experiments due to different designs.
Table V.
Results for the reduced, balanced data subsets from the CLMM with 95% confidence intervals.
DatasetCountryIntercepts for thresholds
τ1τ2τ3τ4
KonIQ-10kIndia − 3.36 ± 0.22 − 1.45 ± 0.170.69 ± 0.163.09 ± 0.21
Venezuela − 2.97 ± 0.21 − 1.29 ± 0.170.35 ± 0.162.34 ± 0.18
KADID-10kVenezuela − 1.89 ± 0.31 − 0.51 ± 0.300.38 ± 0.291.71 ± 0.30
Egypt − 2.04 ± 0.31 − 0.30 ± 0.290.29 ± 0.302.20 ± 0.31
NIVDJapan − 2.15 ± 0.08 − 0.45 ± 0.091.09 ± 0.082.45 ± 0.08
Brazil − 2.20 ± 0.08 − 0.83 ± 0.080.47 ± 0.081.95 ± 0.08
US − 2.35 ± 0.08 − 1.09 ± 0.080.15 ± 0.081.67 ± 0.08
India − 2.56 ± 0.08 − 1.04 ± 0.080.34 ± 0.081.93 ± 0.08
The characteristics of the data, such as the number of observations and the balance of ratings across categories influenced the precision of these estimates. Notably, the NIVD dataset, which is well-balanced and has a significantly larger number of ratings in the balanced subset compared to the other datasets, yielded the highest precision in estimates.
For the NIVD and KonIQ-10k data subsets, the 95% CI of the estimates did not overlap in few cases, indicating discernible differences between the countries. However, for the KADID-10k data subset, which had the smallest number of images and ratings, the 95% CI was wider and overlapped, indicating less precision in the estimates.
To study country-specific differences of extreme ratings we computed their occurrences by (a) averaging the probability Pr[V j ∈{1,5}] from the Thurstonian model (4) over all stimuli j per country, (b) the corresponding averages derived from the CLMM model applied to the balanced subsets of the full datasets, and (c) the sum of the empirical proportions of ratings at ACR levels 1 and 5. Table VI shows the summarized results. Clearly, there are significant differences between countries. The largest differences were found for the ACR modality in KonIQ-10k, in which extreme ratings from Venezuela were nearly three times more likely than those of India.
Table VI.
Probabilities of extreme ratings. Results of the Thurstonian quantized metric model for the full datasets, the CLMM model for the balanced data subsets, and the empirical proportions of ratings in extreme categories 1 and 5 together. Rows are sorted according to their magnitudes in the full dataset.
Full datasetBalanced subset
DatasetCountryProbACR PropProbACR Prop
Venezuela0.06620.06740.07230.0736
Serbia0.05080.0505
KonIQOther0.04620.0479
Russia0.04280.0462
India0.02200.02010.02540.0244
Russia0.3460.375
Other0.3270.347
KADIDVenezuela0.3220.3370.3040.307
India0.2600.279
Egypt0.2250.2400.2150.213
US0.2600.2550.2550.251
NIVDBrazil0.2490.2380.2280.235
India0.2230.2130.2090.211
Japan0.1910.1890.1840.183
Focusing on the Japanese and US subsamples, which were balanced in our NIVD dataset, we observed clear national differences in rating patterns in Table VI. The combined proportion of extreme ratings was about 25% for the US group versus only about 19% for the Japanese raters.
Our analysis revealed systematic differences in how US and Japanese participants utilize the rating scales. The observed shift in category thresholds suggests that a video typically judged as ‘good’ by Japanese viewers might typically be judged as ‘excellent’ by US viewers.
We note that the methods of assessment of occurrences of extreme ratings unanimously agree on the ranking of the countries according to the frequencies of extreme ratings. The Thurstonian and CLMM probabilities were very close to the empirically measured frequencies.
5.3
Comparison
When comparing the results of this analysis of the balanced datasets using CLMMs (Table V and Fig. 6) with the previous ones for the original, large datasets (Table IV and Fig. 4), the varying conditions used to derive these estimates have to be accounted for. Besides the differences in the dataset sizes, the balancing, and the computational methods, the mathematical models are distinct. With MLE, we included adaptive standard deviations and lapse rates, while for the CLMM model we used a subject model for the case of NIVD. However, the scatter plot of the thresholds in Figure 7 confirms that the results are similar. In particular, they indicate that the country-specific differences in the thresholds as derived from the original large datasets cannot be attributed to the differing numbers of subjects from the countries.
Figure 7.
Scatter plot of the four thresholds of the ACR categories, estimated in the large datasets by MLE and the balanced datasets by CLMM.
6.
Limitations
This study leveraged large-scale, cross-cultural datasets, but limitations related to sampling and demographic information require careful consideration. Addressing these limitations is crucial for appropriately interpreting our findings and for guiding future research in the field.
Regarding sample size and representativeness, the NIVD dataset, with 14,450 participants before outlier removal, represented a significant advancement in multimedia quality assessment research, exceeding typical sample sizes by order of magnitude and, to our knowledge, comprised the largest publicly available cross-cultural video quality study. Though this large sample size contributes to the statistical power of our analyses, it’s important to acknowledge that NIVD, while designed to be representative of targeted age ranges (18–30, 31–44, and 45–65) and gender within the US, Japan, India, and Brazil, does not encompass the full diversity of global populations. Furthermore, the specific sampling methodology employed by Survey Sampling International (SSI) is not publicly disclosed, which limits a more precise evaluation of the sample’s representativeness. Future research aimed at generalizing findings to broader populations should prioritize even wider cultural representation and transparently report sampling methodologies.
Another limitation was the use of country of residence as the sole proxy for cultural background. While providing a useful starting point, this approach may not fully capture the nuances of cultural influences on response styles, as it overlooks within-country variations, such as regional, ethnic, or linguistic differences. Furthermore, individual factors like age, gender, education, personality, and other individual characteristics may interact with cultural factors to influence how people perceive and rate image quality. Critically, none of the datasets used in this study (NIVD, KonIQ-10k, and KADID-10k) made detailed demographic data readily available, precluding a more thorough investigation of these potentially confounding factors. Future studies should incorporate more detailed and multidimensional measures of both cultural background and individual differences—and ensure the public availability of such data—to better understand these complex interactions and their impact on response styles.
Despite these limitations, the scale and scope of the datasets employed, particularly NIVD’s unique size and cross-cultural design, provide valuable insights into the complex relationship between culture and subjective quality perception, laying a strong foundation for future work.
We introduced the lapse rate in the statistical model for ACR/DCR quality assessment. A general analysis of the advantages and limitations of lapse rates in quantized metric models is worthwhile, but is beyond the scope of this study.
Though this study focused on cross-cultural variations in rating scale usage, future research could explore the relationship between our model’s predictions and traditional MOS values. Such a comparison could provide further insights into the practical implications of our findings for established practices in image quality assessment.
One limitation is the long runtime for calculating the parameters of quantized metric models if the dataset is very large. For example, calculating the 10092 parameters for KonIQ-10k even with MLE took 13 hours using Matlab on a MacBook Pro (2.6  GHz 6-core Intel Core i7 processor). However, the MLE for NIVD with 1884 parameters, took less than 30 minutes. We did not perform any code optimization and did not try alternative solvers such as ADAM [17].
7.
Conclusion: Navigating Cultural Nuances in Image Quality Assessment
Our study explored the impact of cultural factors on image quality assessment by adapting statistical models to include country-specific components. Across three large-scale datasets (KonIQ-10k, KADID-10k, NIVD) containing subjective image and video quality ratings from several countries, we found significant nation-based differences in extreme response styles. Notably, our findings indicate that US observers exhibited a higher propensity to provide extreme ratings compared to Japanese observers when evaluating the same video stimuli. We estimated that US observers employ extreme ratings 35–39% more frequently than their Japanese counterparts (Table VI). Remarkably, this observed discrepancy aligns closely with the 41% higher likelihood reported over five decades ago [34], reinforcing long-standing cross-cultural research on systematic differences in extreme response tendencies between individualistic and collectivistic cultures like the US and Japan.
These results underscore the importance of considering cultural factors when designing and interpreting subjective quality assessments. Failing to account for these differences could lead to biased or inaccurate conclusions about user experience across different cultural groups.
A key strength of this study was the utilization of quantized metric models as a unified statistical framework. Parameters were computed by maximum likelihood estimation for very large datasets and by Bayesian estimation using cumulative link mixed effects models (CLMMs) for the smaller ones. Our models explicitly model the ordinal rating process without assuming equal category spacing. Furthermore, by incorporating random effects, CLMMs disentangle stimuli quality estimates from overall rater biases and response patterns. Their hierarchical structure facilitated quantifying culture-specific effects like divergent rating thresholds and extreme tendencies, while simultaneously yielding posterior distributions for the latent quality of each image/video.
This approach represents a significant methodological contribution, merging cross-cultural psychological inquiry with applied multimedia quality assessment aims, and provides a rigorous psychometric technique for disentangling cultural influences from true quality perceptions. As the field increasingly relies on crowdsourced remote data collection, such principled methods are crucial for reliable cross-population comparisons and quality predictions.
Our results highlight the importance of considering cultural nuances in image quality assessment to avoid distorted interpretations. Accounting for differences in response styles is vital for meaningful cross-national comparisons of subjective rating data. These findings contribute to a more comprehensive global understanding of image quality perceptions and have implications for the collection and analysis of current and future datasets.
To further refine this understanding, we recommend exploring the specific cultural factors driving the observed response style variations. Potential influences include individualism/collectivism, values of moderation/expressiveness, and preferences for direct/indirect communication. Understanding these roots can guide designing more culturally appropriate assessment surveys that minimize the biasing effects of extreme response tendencies. While we have shown that datasets can be balanced after data collection, we also advocate for the proactive balancing of nationalities in these datasets, as exemplified by the NIVD dataset, when possible. Ultimately, such adjustments will ensure more accurate cross-cultural comparisons of perceived quality in our increasingly globalized multimedia landscape. Additionally, it may aid in creating more culturally relevant and effective surveys and interventions.
Acknowledgment
Funded by the Deutsche Forschungsgemeinschaft (DFG, German Research Foundation)– DFG Project ID 251654672 –TRR 161 and the Research Council of Norway, grant number 324663. We thank Vlad Hosu and Mirko Dulfer for assistance during curation of the raw KonIQ-10k dataset, and Zhi Li, Christos Bampis, and Shaolin Su for assistance with the NIVD dataset.
References
1BampisC. G.KrasulaL.LiZ.AkhtarO.2023Measuring and predicting perceptions of video quality across screen sizes with crowdsourcing15th Int’l. Conf. Quality of Multimedia Experience (QoMEX)131813–8IEEEPiscataway, NJ10.1109/QoMEX58391.2023.10178501
2BürknerP.-C.2017BRMS: an R package for Bayesian multilevel models using StanJ. Stat. Software801281–28
3BürknerP.-C.VuorreM.2019Ordinal regression models in psychology: a tutorialAdv. Methods Pract. Psychol. Sci.27710177–101
4ChenC.LeeS.-Y.StevensonH. W.1995Response style and cross-cultural comparisons of rating scales among East Asian and North American studentsPsychol. Sci.6170175170–510.1111/j.1467-9280.1995.tb00327.x
5ChunK.-T.CampbellJ. B.YooJ. H.1974Extreme response style in cross-cultural research: a reminderJ. Cross-Cultural Psychol.5465480465–8010.1177/002202217400500407
6ClarkeI.III2000Extreme response style in cross-cultural research: an empirical investigationJ. Soc. Behav. Personality15137152137–52
7De JongM. G.SteenkampJ.-B. E.FoxJ.-P.BaumgartnerH.2008Using item response theory to measure extreme response style in marketing research: a global investigationJ. Mark. Res.45104115104–1510.1509/jmkr.45.1.104
8Del PinS. H.AmirshahiS. A.“Subjective quality evaluation: what can be learnt from cognitive science?,” 11th Colour and Visual Comput. Symp. (CVCS) (CEUR-WS.org, Aachen, Germany, 2022)
9GreenleafE. A.1992Measuring extreme response stylePubl. Opinion Quart.56328351328–5110.1086/269326
10HoL. L.LohP. C.QuahA. L.A Cross-Cultural, Between-Gender Study of Extreme Response Style,” (Nanyang Technological University, Singapore, 1995)
11HolbrookA. L.GreenM. C.KrosnickJ. A.2003Telephone versus face-to-face interviewing of national probability samples with long questionnaires: comparisons of respondent satisficing and social desirability response biasPubl. Opinion Quart.677912579–12510.1086/346010
12HosuV.LinH.SziranyiT.SaupeD.2020KonIQ-10k: an ecologically valid database for deep learning of blind image quality assessmentIEEE Trans. Image Process.29404140564041–5610.1109/TIP.2020.2967829
13HuiC. H.TriandisH. C.1989Effects of culture and response format on extreme response styleJ. Cross-cultural Psychol.20296309296–30910.1177/0022022189203004
14International Telecommunication UnionRecommendation ITU-R BT.500-15 (05/2023), Methodology for the subjective assessment of the quality of television pictures2023ITU Publications
15JanowskiL.PapirZ.2009Modeling subjective tests of quality of experience with a generalized linear modelFirst Int’l. Workshop on Quality of Multimedia Experience (QoMEX)354035–40IEEEPiscataway, NJ10.1109/QOMEX.2009.5246979
16JonesB. L.McManusP. R.1986Graphic scaling of qualitative termsSMPTE J.95116611711166–7110.5594/J04083
17KingmaD. P.BaJ.“Adam: a method for stochastic optimization,” Preprint, arXiv:1412.6980 (2014)
18LiZ.BampisC. G.KrasulaL.JanowskiL.KatsavounidisI.2020A simple model for subject behavior in subjective experimentsIS&T Int’l. Symp. Electronic ImagingIS&TSpringfield, VA10.2352/ISSN.2470-1173.2020.11.HVEI-131
19LiddellT. M.KruschkeJ. K.2018Analyzing ordinal data with metric models: what could possibly go wrong?J. Exp. Soc. Psychol.79328348328–4810.1016/j.jesp.2018.08.009
20LinH.HosuV.SaupeD.2019KADID-10k: a large-scale artificially distorted IQA databaseEleventh Int’l. Conf. Quality of Multimedia Experience (QoMEX)131–3IEEEPiscataway, NJ10.1109/QoMEX.2019.8743252
21PinsonM. H.JanowskiL.PépionR.Huynh-ThuQ.SchmidmerC.CorriveauP.YounkinA.Le CalletP.BarkowskyM.IngramW.2012The influence of subjects and environment on audiovisual subjective tests: an international studyIEEE J. Sel. Top. Signal Process.6640651640–5110.1109/JSTSP.2012.2215306
22SaffirM. A.1937A comparative study of scales constructed by three psychophysical methodsPsychometrika2179198179–9810.1007/BF02288395
23SaupeD.Del PinS. H.2024National differences in image quality assessment: an investigation on three large-scale IQA datasets16th Int’l. Conf. Quality of Multimedia Experience (QoMEX)214220214–20IEEEPiscataway, NJ10.1109/QoMEX61742.2024.10598250
24SchönemannP. H.TuckerL. R.1967A maximum likelihood solution for the method of successive intervals allowing for unequal stimulus dispersionsPsychometrika32403417403–1710.1007/BF02289654
25ScottM. J.GuntukuS. C.HuanY.LinW.GhineaG.2015Modelling human factors in perceptual multimedia quality: on the role of personality and cultureProc. 23rd ACM Int’l. Conf. Multimedia481490481–90ACM PressNew York, NY10.1145/2733373.2806254
26SeufertM.2021Statistical methods and models based on quality of experience distributionsQual. User Exp.6310.1007/s41233-020-00044-z
27TasakaS.2017Bayesian hierarchical regression models for QoE estimation and prediction in audiovisual communicationsIEEE Trans. Multimedia19119512081195–20810.1109/TMM.2017.2652064
28TaylorJ. E.RousseletG. A.ScheepersC.SerenoS. C.2023Rating norms should be calculated from cumulative link mixed effects modelsBehav. Res. Methods55217521962175–9610.3758/s13428-022-01814-7
29TeunissenK.1996The validity of CCIR quality indicators along a graphical scaleSMPTE J.105144149144–910.5594/J04650
30ThurstoneL. L.1927A law of comparative judgmentPsychol. Rev.101273286273–8610.1037/h0070288
31TorgersonW. S.Theory and Methods of Scaling1958WileyNew York, NY
32WichmannF. A.HillN. J.2001The psychometric function: I. Fitting, sampling, and goodness of fitPercept. Psychophys.63129313131293–31310.3758/BF03194544
33XiangY.GubianS.SuomelaB.HoengJ.2013Generalized simulated annealing for efficient global optimization: the GenSA package for RR J.510.32614/RJ-2013-002[Online]. Available: https://journal.r-project.org
34ZaxM.TakahashiS.1967Cultural influences on response style: comparisons of Japanese and American college studentsJ. Soc. Psychol.713103–1010.1080/00224545.1967.9919760