Back to articles
Regular Articles
Volume: 5 | Article ID: jpi0140
Image
Enhanced Peripheral Face Processing in Deaf Individuals
  DOI :  10.2352/J.Percept.Imaging.2022.5.000401  Published OnlineFebruary 2022
Abstract
Abstract

Studies of compensatory changes in visual functions in response to auditory loss have shown that enhancements tend to be restricted to the processing of specific visual features, such as motion in the periphery. Previous studies have also shown that deaf individuals can show greater face processing abilities in the central visual field. Enhancements in the processing of peripheral stimuli are thought to arise from a lack of auditory input and subsequent increase in the allocation of attentional resources to peripheral locations, while enhancements in face processing abilities are thought to be driven by experience with American sign language and not necessarily hearing loss. This combined with the fact that face processing abilities typically decline with eccentricity suggests that face processing enhancements may not extend to the periphery for deaf individuals. Using a face matching task, the authors examined whether deaf individuals’ enhanced ability to discriminate between faces extends to the peripheral visual field. Deaf participants were more accurate than hearing participants in discriminating faces presented both centrally and in the periphery. Their results support earlier findings that deaf individuals possess enhanced face discrimination abilities in the central visual field and further extend them by showing that these enhancements also occur in the periphery for more complex stimuli.

Subject Areas :
Views 318
Downloads 45
 articleview.views 318
 articleview.downloads 45
  Cite this article 

Kassandra R. Lee, Elizabeth Groesbeck, O. Scott Gwinn, Michael A. Webster, Fang Jiang, "Enhanced Peripheral Face Processing in Deaf Individualsin Journal of Perceptual Imaging,  2022,  pp 000401-1 - 000401-7,  https://doi.org/10.2352/J.Percept.Imaging.2022.5.000401

 Copy citation
  Copyright statement 
Copyright © Society for Imaging Science and Technology 2022
  Article timeline 
  • received June 2020
  • accepted February 2021
  • PublishedFebruary 2022

Preprint submitted to:
jpi
Journal of Perceptual Imaging
J. Percept. Imaging
J. Percept. Imaging
2575-8144
Society for Imaging Science and Technology
A growing body of evidence indicates that when one sense is deprived, both humans and animals may experience a cross-modal reorganization of their brain, resulting in the remaining intact senses showing heightened sensitivity as a compensation for the deficit (Ref. [23, 24], for a review, see [5]). This sensory compensation may reflect neural plasticity. When an area of the brain loses its sensory input, other senses may take over the deprived area, resulting in the functional gain in the perceptual capacities of the remaining senses (for reviews, see [32, 33]).
Of particular interest to the current study is the potential for changes in visual functions in response to auditory loss. In general, enhanced visual abilities are found to be limited to the processing of certain visual features, such as motion, rather than an overall improvement [2]. Behavioral studies further suggest that peripheral vision might be selectively enhanced in deaf individuals, and that these enhancements may be due to an increased allocation of attention to these locations as the visual system takes on monitoring duties that would normally be fulfilled by auditory input [15, 39, 45]. This possibility is also supported by neuroimaging studies showing differences in levels of activation in deaf and hearing participants when viewing stimuli in the periphery [4, 6, 35, 43]. Using electroencephalography (EEG), Neville and Lawson [35] demonstrated that larger increases in response amplitudes are exhibited by deaf participants compared to hearing participants when attending to peripherally presented motion stimuli. These differences between groups were not seen for centrally presented stimuli [35]. Functional magnetic resonance imaging (fMRI) has also revealed differences in blood-oxygen-level dependent (BOLD) signals between deaf and hearing groups in response to peripheral and central stimuli, with greater signal changes for more peripheral stimuli in deaf compared to hearing participants [43]. These enhanced motion/periphery functions seem to be at least partially linked to the recruitment of auditory cortex for visual processing [18, 19, 43].
Aside from the large body of evidence indicating that deaf people can possess enhanced abilities for processing motion in the periphery, there is also evidence that deaf individuals possess heightened face processing capabilities with centrally presented face stimuli [3, 8, 27, 46]. Bettger et al. [8] reported that deaf signers perform significantly better on a facial recognition task compared to hearing controls. This enhancement was also found in hearing signers [8] but not in deaf non-signers [36], suggesting that experience with American sign language (ASL), rather than a loss of hearing, might facilitate the enhancement. Further research has indicated that deaf and hearing individuals do not differ in their ability to recognize faces from memory [27], or in their configural processing of faces [27]. Instead the previously reported effects seem to reflect an enhanced ability to match target and test faces based on local feature similarities [13, 27]. This enhanced matching ability may be due to increased attention given to certain features that serve to convey grammatical markers during sign language, as well as lip reading, in the case of the mouth region [16]. In line with this conclusion, compared to hearing non-signers, deaf signers attend more to the bottom half of faces across a variety of face processing tasks as well as across cultures [22, 47]. Examination of the latency of event-related potential (ERP) components associated with face perception further suggest that deaf signers may expend more effort when directed to attend to the top half of faces [34].
Given that these face processing enhancements have been shown for deaf individuals viewing faces presented centrally, we were interested if the peripheral enhancements found for simpler stimuli also extended to enhanced processing of faces presented peripherally. It is well known that our ability to identify differences in facial features declines markedly with eccentricity [21, 25], and that peripherally presented faces are more prone to distortion effects [11]. Thus, compared to other visual judgements, face perception may be a more “foveal” task. One reason for this decline is reduced spatial acuity in the periphery, which may differentially affect the fine spatial judgements required for discriminating faces [1]. Melmoth et al. [30, 31] demonstrated that face identification judgements are affected by reduced spatial acuity in the periphery and that spatial scaling is needed to account for this drop off in perceptual ability. However, another potential contributor to the decline is increased feature crowding in peripheral vision, including features within a face [26, 38]. While additional research has shown promise in our ability to complete more global tasks such as identity and gender processing in the periphery [40, 41], it remains likely that judgement tasks relying on processing of fine details will be negatively affected in the periphery. Whether declines in peripheral face processing ability also occur for deaf individuals is unclear given demonstration of their increased attentional allocation to the periphery compared to hearing individuals [39]. In addition, there are trends for deaf individuals to perform better on processing of certain stimuli (e.g., motion) presented peripherally as opposed to centrally, opposite to patterns seen for hearing individuals [10].
1.
Methods
The aim of the present study was to determine whether the enhanced face discrimination abilities previously reported for deaf individuals extend to the visual periphery despite the fact that face processing abilities typically drop off in the periphery. We compared deaf signers’ and hearing non-signers’ ability to discriminate between faces in a delayed matching task, where participants were asked to determine which of the two test faces best matches a previously displayed target face. Specifically, we examined whether discrimination performance varied as a function of visual field eccentricity as well as hearing.
Testing performance in the central visual field (here defined as 3.7 degrees from fixation) was designed to assess potential advantages for deaf individuals over hearing individuals, similar to the experiment by McCullough and Emmorey [27], although here we used “whole face” changes rather than local feature changes as they did. Pilot testing indicated that using facial images in which only single features differed between images was too difficult to discriminate when presented in the periphery, resulting in many participants performing at floor level. The peripheral condition (10.6 degrees from fixation) is a novel extension.
2.
Participants
Fifteen hearing participants and fifteen early deaf individuals participated in the study. One hearing and one deaf participant produced thresholds that were beyond the possible image range, meaning they were unable to perform the face discrimination task even when maximal differences were presented between the target and test faces (i.e., the 100% morph level), and their data were excluded from further analyses, although the excluded deaf subject’s data is listed for reference in Table I as participant fifteen. Data were analyzed for a total of fourteen hearing (nine male) with a mean age of 37.14 (SD = 8.87), and fourteen deaf (four male) with a mean age of 43.79 (SD = 8.48) participants. An independent samples t-test showed that the difference in ages between groups approached significance (t26 = −2.02, p = 0.053), but was in the direction that should have favored better face recognition in the younger, hearing group [20]. All participants had normal or corrected-to-normal vision and were all right-handed. Deaf participants had no history of neurological disorders and had a binaural severe to profound hearing loss (see Table I). All of the deaf participants were fluent in American sign language. None of the hearing participants were signers. All participants received monetary compensation for taking part in the study.
Table I.
Characteristics of deaf participants.
ParticipantGenderAgeDegree ofAge ofAge of firstCause of
(M = Male,(years)hearingdeafnessASL usedeafness
F = Female) loss (dB)onset (mo.)(mo.)
1M31L: total loss1515fever
R: 85
2F39Both: 90birth12genetic
3F35L: 89birth8unknown
R: 90
4F49L: 100birth132maternal measles
R: 90
5F59Both: 100birth60unknown
6F52L: 8512144unknown
R: 90–100
7F41Both: 95birth96unknown
8F34L: 100birth12unknown
R: 90
9F56L: 80birth12unknown
R: 70
10F47Both: 90birth12unknown
11F44L: 95924spinal meningitis
R: 107
12M36Left: 901212cytomegalovirus
Right: 85
13M48Left: total loss2636spinal meningitis
Right: 120
14M42Left: total lossbirth12unknown
Right: 90
15 (excluded)M30Left: 90 Right: 100birth12genetic
3.
Stimuli
The face stimuli used in the study were computer-generated faces originally taken from Retter and Rossion [42]. For our purposes, we selected one male and one female image, each with an additional anti-face (four images in total). Anti-faces are the physical opposite of an original face in terms of features and their configuration, but do not cross genders [9]. Therefore, the anti-face of an original face that is male will also be male.
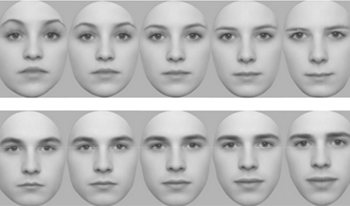
The difference between each face and anti-face was exaggerated by caricaturing the images using the program Abrosoft Fantamorph 5 (USA) and following standard morphing procedures. The images were caricatured to help to ensure performance which was above floor in the periphery condition. This involved placing a series of landmark points on each face at locations intended to encapsulate the shape and position of the features, such as the eyes and mouth. The position of pixels at these points were then shifted away from the average of the face pair. The degree to which these points were shifted was determined individually for each face pair as the most extreme change possible while still maintaining a normal appearance, as judged by the researchers. Each caricatured face and anti-face pair were then morphed together in 1% steps, resulting in 100 images for each pair that gradually change in likeness from being 100% the caricatured face to 0% original face (i.e., the anti-face caricature) (see Figure 1). Images were presented on a NEC AccuSync 120 monitor at a working resolution of 1280 × 960 pixels and refresh rate of 60 Hz. All images at a viewing distance of approximately 57 cm subtended 7.3 degrees of visual angle.
Figure 1.
Example set of male and female caricatured face sets, morphed from original face to anti-face.
4.
Procedure
At the beginning of each trial, a target face was presented in the middle of the screen for 1.5 s. Participants were instructed to study the target face in preparation for a following matching task and during this time were allowed to freely move their gaze about the image. After the target face had disappeared from the screen and following an inter-stimulus interval (ISI) of 2s, two test images would simultaneously appear on either side of a central fixation cross for 1s. One was identical to the target face while the other was more similar to the anti-face. Participants were required to indicate which of the two test faces (left or right) matched the target face by pressing either the left or right mouse button. The presentation of test images was controlled using a three-down, one-up staircase. This meant that every time three correct responses were given in a row, the task would become harder by reducing the morph level of the non-matching face, thus making the two test images more similar. Beginning at the maximum 100% difference between the two test images, this would reduce by 25% of the current morph level difference to 75%, then 56%, 42%, and so on. If one incorrect response was given, the task would become easier by increasing the morph level by the same proportion. The staircase continued until 60 trials had been completed. Thresholds were assessed via two methods. The proportion of correct responses at each viewed morph level was calculated and fit with a Weibull function, and thresholds determined by the morph level corresponding to an 80% correct response level. Additionally, thresholds were calculated by averaging the morph levels viewed in the last 10 trials of each participant’s staircase.
The experiment was repeated across two different conditions run in separate blocks. In one condition, the center of test images was presented at an eccentricity of 3.7 degrees from the center of the screen, while images in the peripheral condition were presented at 10.6 degrees. For faces presented centrally, there was no gap between images and for peripherally presented faces there was 13.9 degrees between the closest edges. Peripheral eccentricity was determined relative to the center of face images. The order of conditions was counterbalanced across participants, and the position of the matching target face (left or right) was randomized across trials. During the test phase, participants were instructed to keep their gaze on a central fixation cross. Note that a chin rest was not used during the experiment, therefore, gaze was not controlled in a strict way. Face sets varied between participants, but matched across the hearing and deaf groups. Each block took approximately 6 minutes and the entire behavioral experiment lasted for approximately 12 minutes.
5.
Results
After fitting each participant’s data with a Weibull function, resulting thresholds were analyzed. Thresholds here refer to the morph level percentage, so discrimination at a lower threshold is indicative of higher sensitivity to smaller changes to a face. We also estimated the thresholds based on the average of the last 10 trials of the staircase. This alternative analysis was conducted to ensure that the Weibull fits were not affected by the small number of measurements made at each stimulus level. To maintain consistency across analyses, data from the two participants excluded based on fitting were also excluded from the averaging analysis. Group thresholds calculated using Weibull functions can be seen in Figure 2, and group thresholds calculated based on the average of the last 10 trials can be seen in Figure 3.
Figure 2.
Average Weibull function thresholds for deaf and hearing participants for both central and peripheral conditions. Thresholds for deaf participants were significantly lower than for hearing participants in both the central and peripheral conditions, although larger differences were seen in the peripheral condition.
Figure 3.
Trial average thresholds for deaf and hearing participants for both central and peripheral conditions based on the average of the last 10 trials. Thresholds for deaf participants were significantly lower than for hearing participants in both the central and peripheral conditions.
Thresholds calculated using Weibull functions and thresholds based on the average of the last 10 trials were formally analyzed using two separate 2 × 2 repeated measures ANOVAs with the between-participants factor of “group” (hearing versus deaf) and within-participants factor of “condition” (center versus periphery). For thresholds derived from Weibull functions, a significant main effect of condition was found (F1,26 = 14.39, p = 0.001, ηp2 = 0.15) with thresholds lower in the central condition (M = 24.32, SD = 10.35) compared to the peripheral condition (M = 34.41, SD = 18.80), indicating that across groups performance was worse in the peripheral condition. A significant main effect of group was also found (F1,26 = 9.81, p = 0.004, ηp2 = 0.27) with deaf participants producing lower thresholds (M = 22.58, SD = 12.83) than hearing participants (M = 36.15, SD = 15.91), indicating that across conditions deaf participants performed better than hearing participants. Analyses also revealed a significant condition*group interaction (F1,26 = 4.42, p = 0.045, ηp2 = 0.15). Inspection of Fig. 2 suggests that this interaction is likely due to hearing subjects showing a relatively large increase in the peripheral condition thresholds compared to the central condition, while thresholds for deaf subjects appear to remain largely stable. This observation was confirmed by two independent sample t-tests comparing central versus peripheral performance for hearing and deaf groups separately, with critical alpha level Bonferroni corrected to 0.025. Results suggest a significant difference between the central (M = 28.31, SD = 9.83) and peripheral (M = 43.99, SD = 17.22) conditions for hearing subjects, with performance being significantly lower in the peripheral condition (t13 = 3.74, p = 0.002). Conversely, there was no significant difference between the central (M = 20.33, SD = 9.57) and peripheral (M = 24.83, SD = 15.47) conditions for the deaf group (t13 = 1.37, p = 0.19). These results suggest that, while the hearing group showed a significant decline in performance with stimuli presented in the periphery, the difference between performance centrally versus peripherally may have been smaller or absent for the deaf group.
For thresholds calculated based on the average of the last 10 trials, a significant main effect of condition was again found (F1,26 = 17.43, p < 0.001, ηp2 = 0.4) with thresholds lower in the central condition (M = 25.02, SD = 11.57) compared to the peripheral condition (M = 36.53, SD = 19.16), indicating that across groups performance was worse in the peripheral condition. A significant main effect of group was also again found (F1,26 = 10.13, p = 0.004, ηp2 = 0.28) with deaf participants producing lower thresholds (M = 23.46, SD = 13.95) than hearing participants (M = 38.09, SD = 16.26), indicating that across conditions deaf participants performed better than hearing participants. In contrast to the preceding analyses based on thresholds derived from Weibull functions, the condition*group interaction did not reach significance (F1,26 = 0.8, p = 0.381, ηp2 = 0.03), so no follow-up t-tests were run. In this case, there was no evidence for a relative improvement in peripheral vision for the deaf subjects. Importantly, however, both analyses were consistent in indicating that the superior performance of the deaf subjects compared to hearing controls in face discrimination was maintained in the periphery.
As an additional analysis, we ran a correlation assessing the relationship between the onset of ASL use (in months) and discrimination thresholds averaged across central and peripheral conditions for each subject. There was no significant correlation between the onset of ASL use and discrimination threshold as calculated by Weibull functions, r(13) = 0.19, p = 0.51. Similarly, there was no significant correlation found between ASL and threshold calculated based on the average of the last 10 trials, r(13) = 0.15, p = 0.59. This is consistent with the finding that there is no ASL “critical period” for enhanced face discrimination abilities for deaf individuals [8].
6.
Discussion
The present study investigated whether deaf individuals exhibit enhanced face processing abilities in the central and peripheral visual fields compared to hearing individuals. Overall, we found that deaf individuals performed better than hearing individuals in a delayed face matching task and this difference was evident when faces were presented both centrally and in the periphery.
Our results are consistent with previous studies that show deaf individuals possess enhanced processing abilities for centrally presented faces [8, 27, 46]. In addition, results from our study further extend these findings and demonstrate that enhancements in face discrimination are also present in the visual periphery. Previous studies reporting enhanced visual processing abilities for stimuli presented in the periphery in deaf individuals have been mostly limited to the processing of motion stimuli [5]. However, our results suggest that similar enhancements can extend to the processing of faces as well. While it is not fully understood why deaf individuals may possess a peripheral field enhancement, work assessing these advantages in terms of retinal changes may provide a possible explanation. By quantifying retinal micro-structure, Codina et al. [12] were able to assess neural changes at the level of the retina and optic nerve in deaf compared to hearing controls. Their findings suggest that deaf adults had larger neural rim areas, indicative of a greater number of retinal ganglion cells. They linked deaf adults’ larger neural rim areas to their greater peripheral sensitivity in terms of larger visual field areas compared to hearing controls. This relationship was specific to deaf individuals who experience early onset retinal adaptation, which very likely applies to our participant population given that they all have early onset deafness.
While a more thorough understanding of general peripheral deaf enhancements is needed, we also need to acknowledge the significance of finding these enhancements specifically for face stimuli. There exists a substantial body of evidence showing that face processing abilities in hearing individuals commonly decline with visual eccentricity due to lower spatial acuity [30, 31] and increased feature crowding [26, 38]. Thresholds for hearing participants increased in the periphery as expected. Yet our analyses suggest that this falloff could be weaker for deaf participants. In particular, the effects based on the Weibull threshold estimates did not reveal a difference in sensitivity for the central and peripheral faces for the deaf observers. However, this interaction was not confirmed in the second analysis. Importantly, however, both analyses were consistent in pointing to superior performance in the deaf observers compared to hearing controls for both the central and peripheral locations.
Recent work by Shalev et al. [44] investigated perceptual resolution of peripheral face processing in deaf individuals and found no peripheral enhancements for face identification, gender categorization, or eye gaze direction tasks. However, they found that perception of specific expression (e.g., fear) was somewhat preserved with increasing eccentricity. Like their study, we were interested in potential enhancements of face processing for deaf individuals in the periphery. While Shalev and colleagues found enhanced performance for salient emotional expressions, our results indicate that other face tasks such as discrimination can also yield enhancements for deaf as compared to hearing individuals.
The mechanism by which deaf individuals gain peripheral enhancements for faces is still unknown. Based on the current study, we are unable to determine whether improved discrimination was based on detection of individual facial features or more configural processing. Reddy et al. [40, 41] determined that hearing individuals had minimal peripheral processing deficits for faces even under conditions of limited spatial attention, given that they were completing tasks that relied on more global processing, namely identity and gender judgements. This calls into question whether deaf individuals have peripheral enhancements for identifying individual facial features compared to more global, holistic processing. Future studies could address this question by presenting stimuli that isolate configural face processing [17, 28, 29]. In addition, it may be interesting to assess the known functional lateralization of face processing in deaf participants. Our experimental setup was limited in this regard as we presented test faces in both the left and right peripheral fields simultaneously. Future work should assess how deaf individuals process faces and even non-face stimuli presented separately in the left and right visual fields, given evidence in hearing participants that there are lateralized regions in the brain specialized for processing of specific objects [7] and the hemispheric specialization for certain object categories such as face and word emerge over development through cooperation and competition between representations [14].
Enhancements previously seen in processing peripheral motion are typically thought to result from a loss of hearing and an increased need to monitor peripheral events that may normally be detected through audition [37]. However, enhancements in face processing in central vision have typically been attributed to experience with ASL rather than a loss of hearing [8, 36]. It is feasible that the experience with ASL in early deaf individuals results in their enhanced face processing not only in the central but also in the peripheral visual field. It may be of interest for future research to test non-face stimuli given that faces are a special object category. Specifically, alphanumeric stimuli can be used to better address whether enhancements are driven by experience with ASL or language more generally. It is also likely that enhanced discrimination for peripherally presented faces in deaf individuals is partially driven by their increased attentional resources in the periphery that cannot be accounted for by ASL experience alone [39]. If this is the case, then there might be higher resistance to peripheral crowding for individuals with ASL experience. Looking ahead, research should investigate this peripheral enhancement effect with a hearing signer control group to further parse out effects being driven by either auditory deprivation or ASL use.
7.
Funding
This work was supported by grants from the National Institutes of Health (EY-023268 to FJ, EY-10834 to MW), with further support for core facilities provided by NIH COBRE center grant P20 GM103650. The content is solely the responsibility of the authors and does not necessarily represent the official views of the National Institutes of Health.
8.
Conflicts of Interest
The authors declare that there is no conflict of interest regarding the publication of this article.
References
1AnstisS. M.1974A chart demonstrating variations in acuity with retinal positionVis. Res.14589592589–9210.1016/0042-6989(74)90049-2
2ArmstrongB. A.NevilleH. J.HillyardS. A.MitchellT. V.2002Auditory deprivation affects processing of motion, but not colorCogn. Brain Res.14422434422–3410.1016/S0926-6410(02)00211-2
3ArnoldP.MurrayC.1998Memory for faces and objects by deaf and hearing signers and hearing nonsignersJ. Psycholinguistic Res.27481497481–9710.1023/A:1023277220438
4BavelierD.TomannA.HuttonC.MitchellT.CorinaD.LiuG.NevilleH.2000Visual attention to the periphery is enhanced in congenitally deaf individualsJ. Neurosci.20161–610.1523/JNEUROSCI.20-17-j0001.2000
5BavelierD.DyeM. W. G.HauserP. C.2006Do deaf individuals see better?Trends Cognitive Sci.10512518512–810.1016/j.tics.2006.09.006
6BavelierD.BrozinskyC.TomannA.MitchellT.NevilleH.LiuG.2001Impact of early deafness and early exposure to sign language on the cerebral organization for motion processingJ. Neurosci.21893189428931–4210.1523/JNEUROSCI.21-22-08931.2001
7BehrmannM.PlautD. C.2020Hemispheric organization for visual object recognition: a theoretical account and empirical evidencePerception49373404373–40410.1177/0301006619899049
8BettgerJ. G.EmmoreyK.McCulloughS. H.BellugiU.1997Enhanced facial discrimination: Effects of experience with American Sign LanguageJ. Deaf Studies Deaf Educ.2223233223–3310.1093/oxfordjournals.deafed.a014328
9BlanzV.O’TooleA. J.VetterT.WildH. A.2000On the other side of the mean: The perception of dissimilarity in human facesPerception29885891885–9110.1068/p2851
10BosworthR. G.DobkinsK. R.2002Visual field asymmetries for motion processing in deaf and hearing signersBrain Cognition49170181170–8110.1006/brcg.2001.1498
11BowdenJ.WhitakerD.DunnM. J.2019The role of peripheral vision in the flashed face distortion effectPerception489310193–10110.1177/0301006618817419
12CodinaC. J.PascalisO.ModyC.ToomeyP.RoseJ.GummerL.BuckleyD.2011Visual advantage in deaf adults linked to retinal changesPlosOne6e2041710.1371/journal.pone.0020417
13de HeeringA.AljuhanayA.RossionB.PascalisO.2012Early deafness increases the face inversion effect but does not modulate the composite face effectFrontiers Psychol.310.3389/fpsyg.2012.00124
14DundasE. M.PlautD. C.BehrmannM.2013The joint development of hemispheric lateralization for words and facesJ. Exp. Psychol.: General14234810.1037/a0029503
15DyeM. W.BavelierD.2010Attentional enhancements and deficits in deaf populations: an integrative reviewRestorative Neurol. Neurosci.28181192181–9210.3233/RNN-2010-0501
16EmmoreyK.2001The impact of sign language use on visuospatial cognitionLanguage, Cognition and the Brain: Insights from Sign Language Research243270243–70Lawrence Erlbaum Associates, Inc.Mahwah, NJ
17FarzinF.RiveraS. M.WhitneyD.2009Holistic crowding of Mooney facesJ. Vis.9181818–10.1167/9.6.18
18FinneyE. M.ClementzB. A.HickokG.DobkinsK. R.2003Visual stimuli activate auditory cortex in deaf subjects: evidence from MEGNeuroreport14142514271425–710.1097/00001756-200308060-00004
19FinneyE. M.FineI.DobkinsK. R.2001Visual stimuli activate auditory cortex in the deafNat. Neurosci.4117111731171–310.1038/nn763
20GermineL. T.DuchaineB.NakayamaK.2011Where cognitive development and aging meet: Face learning ability peaks after age 30Cognition118201210201–1010.1016/j.cognition.2010.11.002
21HarryB.DavisC.KimJ.2012Exposure in central vision facilitates view-invariant face recognition in the peripheryJ. Vis.12131313–10.1167/12.2.13
22LetourneauS. M.MitchellT. V.2011Gaze patterns during identity and emotion judgments in hearing adults and deaf users of American Sign LanguagePerception40563575563–7510.1068/p6858
23LokeW. H.SongS. R.1991Central and peripheral visual processing in hearing and nonhearing individualsBull. Psychonomic Soc.29437440437–4010.3758/BF03333964
24LomberS. G.MeredithM. A.KralA.2010Cross-modal plasticity in specific auditory cortices underlies visual compensations in the deafNat. Neurosci.13142114271421–710.1038/nn.2653
25LoomisJ. M.KellyJ. W.PuschM.BailensonJ. N.BeallA. C.2008Psychophysics of perceiving eye-gaze and head direction with peripheral vision: Implications for the dynamics of eye-gaze behaviorPerception37144314571443–5710.1068/p5896
26MartelliM.MajajN. J.PelliD. G.2005Are faces processed like words? A diagnostic test for recognition by partsJ. Vis.5666–10.1167/5.1.6
27McCulloughS.EmmoreyK.1997Face processing by deaf ASL signers: Evidence for expertise in distinguishing local featuresJ. Deaf Stud. Deaf Educ.2212222212–2210.1093/oxfordjournals.deafed.a014327
28McKoneE.MartiniP.NakayamaK.2001Categorical perception of face identity in noise isolates configural processingJ. Exp. Psychol.: Human Perception Performance2757310.1037/0096-1523.27.3.573
29McKoneE.2004Isolating the special component of face recognition: peripheral identification and a Mooney faceJ. Exp. Psychol.: Learning, Memory, Cognition3018110.1037/0278-7393.30.1.181
30MelmothD. R.KukkonenH. T.MäkeläP. K.RovamoJ. M.2000The effect of contrast and size scaling on face perception in foveal and extrafoveal visionInvestigative Ophthalmol. Visual Sci.41281128192811–9
31MelmothD. R.KukkonenH. T.MäkeläP. K.RovamoJ. M.2000Scaling extrafoveal detection of distortion in a face and gratingPerception29111711261117–2610.1068/p2945
32MerabetL.AmediA.Pascual-LeoneA.LomberS.EggermontJ. J.2005Activation of the visual cortex by Braille reading in blind subjectsReprogramming Cerebral Cortex: Plasticity Following Central and Peripheral Lesions377393377–93Oxford University PressOxford, UK
33MerabetL. B.Pascual-LeoneA.2010Neural reorganization following sensory loss: the opportunity of changeNat. Rev. Neurosci.11445244–5210.1038/nrn2758
34MitchellT. V.LetourneauS. M.MaslinM. C.2013Behavioral and neural evidence of increased attention to the bottom half of the face in deaf signersRestorative Neurol. Neurosci.31125139125–3910.3233/RNN-120233
35NevilleH. J.LawsonD.1987Attention to central and peripheral visual space in a movement detection task. II. Congenitally deaf subjectsBrain Res.405268283268–8310.1016/0006-8993(87)90296-4
36ParasnisI.SamarV. J.BettgerJ. G.SatheK.1996Does deafness lead to enhancement of visual spatial cognition in children? Negative evidence from deaf nonsignersJ. Deaf Studies Deaf Educ.1145152145–5210.1093/oxfordjournals.deafed.a014288
37PavaniF.BottariD.MurrayM. M.WallaceM. T.2012Visual abilities in individuals with profound deafness: A critical reviewThe Neural Bases of Multisensory Processes423448423–48CRC Press/Taylor & FrancisBoca Raton, FL
38PelliD. G.TillmanK. A.2008The uncrowded window of object recognitionNat. Neurosci.11112911351129–3510.1038/nn.2187
39ProkschJ.BavelierD.2002Changes in the spatial distribution of visual attention after early deafnessJ. Cognitive Neurosci.14687701687–70110.1162/08989290260138591
40ReddyL.ReddyL.KochC.2006Face identification in the near-absence of focal attentionVis. Res.46233623432336–4310.1016/j.visres.2006.01.020
41ReddyL.WilkenP.KochC.2004Face-gender discrimination is possible in the near-absence of attentionJ. Vis.4444–10.1167/4.2.4
42RetterT. L.RossionB.2016Visual adaptation provides objective electrophysiological evidence of facial identity discriminationCortex80355035–5010.1016/j.cortex.2015.11.025
43ScottG. D.KarnsC. M.DowM. W.StevensC.NevilleH. J.2014Enhanced peripheral visual processing in congenitally deaf humans is supported by multiple brain regions, including primary auditory cortexFrontiers Human Neurosci.8191–910.3389/fnhum.2014.00177
44ShalevT.SchwartzS.MillerP.HadadB. S.“Do deaf individuals have better visual skills in the periphery? Evidence from processing facial attributes”, Vis. Cognition 28, 205–217 (2020)
45SladenD. P.TharpeA. M.AshmeadD. H.GranthamD. W.ChunM. M.2005Visual attention in deaf and normal hearing adults: Effects of Stimulus CompatibilityJ. Speech, Language, Hearing Res.48152915371529–3710.1044/1092-4388(2005/106)
46StollC.Palluel-GermainR.CaldaraR.LaoJ.DyeM. W.AptelF.PascalisO.2017“Face recognition is shaped by the use of sign language”, J. Deaf Stud. Deaf Educ.ation 23, 1–9 (2017)
47WatanabeK.MatsudaT.NishiokaT.NamatameM.2011Eye gaze during observation of static faces in deaf peoplePLoS One6e1691910.1371/journal.pone.0016919