Back to articles
Regular Articles
Volume: 3 | Article ID: jpi0121
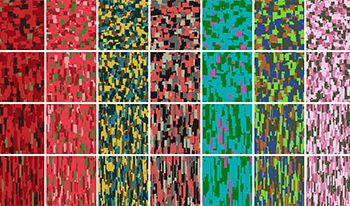
Image
Influence of Texture Structure on the Perception of Color Composition
  DOI :  10.2352/J.Percept.Imaging.2020.3.1.010401  Published OnlineJanuary 2020
Abstract
Abstract

The authors explore the influence of the structure of a texture image on the perception of its color composition through a series of psychophysical studies. They estimate the color composition of a texture by extracting its dominant colors and the associated percentages. They then synthesize new textures with the same color composition but different geometric structural patterns. They conduct empirical studies in the form of two-alternative forced choice tests to determine the influence of two structural factors, pattern scale and shape, on the perceived amount of target color. The results of their studies indicate that (a) participants are able to consistently assess differences in color composition for textures of similar shape and scale, and (b) the perception of color composition is nonveridical. Pattern scale and shape have a strong influence on perceived color composition: the larger the scale, the higher the perceived amount of the target color, and the more elongated the shape, the lower the perceived amount of the target color. The authors also present a simple model that is consistent with the results of their empirical studies by accounting for the reduced visibility of the pixels near the color boundaries. In addition to a better understanding of human perception of color composition, their findings will contribute to the development of color texture similarity metrics.

Subject Areas :
Views 140
Downloads 59
 articleview.views 140
 articleview.downloads 59
  Cite this article 

Jing Wang, Jana Zujovic, June Choi, Basabdutta Chakraborty, Rene van Egmond, Huib de Ridder, Thrasyvoulos N. Pappas, "Influence of Texture Structure on the Perception of Color Compositionin Journal of Perceptual Imaging,  2020,  pp 010401-1 - 010401-20,  https://doi.org/10.2352/J.Percept.Imaging.2020.3.1.010401

 Copy citation
  Copyright statement 
Copyright © Society for Imaging Science and Technology 2020
  Article timeline 
  • received April 2019
  • accepted November 2019
  • PublishedJanuary 2020

Preprint submitted to:
jpi
Journal of Perceptual Imaging
J. Percept. Imaging
J. Percept. Imaging
2575-8144
Society for Imaging Science and Technology
1.
Introduction
Texture is an important visual attribute that provides important cues for object boundary detection and localization, foreground/background separation, and material identification [3, 26]. In this article, we explore some aspects of texture perception that are important for the development of texture similarity metrics [45, 59, 60], which play a key role in engineering applications, such as image compression, restoration, content-based retrieval, and understanding [10, 30, 40, 45, 61]. In particular, we conduct a series of psychophysical studies to examine the influence of the structure of a texture image on the perception of its color composition. By color composition we mean the amount (area in pixels) of each color in the image irrespective of position, and by structure we mean their spatial arrangement.
There is a large body of work on texture perception in the psychophysical literature. To a large extent, it has relied on computer-generated or carefully constructed images, from the pioneering work of Julesz [19, 21] and Beck [2] on pre-attentive pattern discrimination, to more recent studies of surface roughness perception [16, 18, 42] and surface gloss [1, 17, 34, 39, 58]. The use of synthetic images makes it possible to study specific aspects of texture and to isolate the parameters and neural mechanisms that affect its appearance. However, texture images that are encountered in real-world applications are more complex, involve several parameters, and as we will see, the study of their perceptual properties raises some new questions that have not been studied in the psychophysical literature.
1.1
Background
In the development of perceptual metrics for texture similarity, Zujovic et al. [59, 60] combined separate estimates of texture similarity in terms of structure and color composition. Taking into consideration the fact that textures can have similar structure and different color composition, as shown in Figure 1(a), or similar color composition and different structure, as shown in Fig. 1(b), they argued that how these separate estimates should be combined should depend on the observer and the application [59, 60].
Figure 1.
Examples of color textures with (a) similar structure and different color composition and (b) similar color composition and different structure.
Zujovic et al. [59, 60] argued that the structure of a texture can be reasonably approximated with the structure of the grayscale component of the image. While the chrominance also contributes to the structure, the case where structure is solely determined by the chrominance is possible [56] but unlikely in natural or synthetic textures. To evaluate the similarity of the structure of grayscale textures, they then used perceptually based structural texture similarity metrics (STSIMs) [61].
To estimate the color composition of a texture, as perceived by a human, rather than as a histogram of the colors of the pixels, Zujovic et al. [59, 60] adopted the representation in terms of dominant colors and their percentages, and used the optimal color composition distance (OCCD) [37], which is closely related to the earth mover’s distance (EMD) [49], to compare the color compositions of two textures. Figure 2(a) shows an original texture image, Fig. 2(b) shows its grayscale component, and Fig. 2(c) shows its dominant colors. The representation of the color composition of a texture in terms of its dominant colors has been well established in the engineering literature [7, 29, 38, 59, 60]. We could not find any related work in the psychophysical literature, except for the work of Kuriki [25] on average-color perception of multicolored patterns. Kimura [22] also considered color averaging of multicolor mosaics into a few color categories, with emphasis on the mean color judgments.
Figure 2.
Texture structure and color composition. (a) Original image. (b) Grayscale texture of (a). (c) Posterized (texture segmentation with dominant colors). (d) Color composition, most illuminant, and most distinct color. (e) Synthetic texture based on MRF model with the same color composition as (c).
1.2
Proposed Approach
The key assumption in Zujovic’s approach to texture similarity is that texture structure and color composition are independent of each other. The goal of this article is to test whether this assumption is consistent with human perception and, in particular, whether the perception of color composition is veridical and whether it is affected by the texture structure.
We explore the influence of texture structure on the perception of the color composition through a series of empirical studies. While the motivation comes from texture similarity and content-based retrieval, the problem is interesting in its own right, and to the best of our knowledge has not been addressed in the psychophysical literature. Thus, while we will discuss the implications of the conclusions of our studies for texture similarity metrics, the main focus is on understanding the perception of the color composition of visual textures.
To study the effects of texture structure on color composition, we synthesized color textures with the same color composition as that extracted from the original texture but with different structural patterns, and conducted empirical studies to compare the perceived color composition of the synthesized textures.
As in [59, 60], we estimated the color composition of a given original texture image using the adaptive clustering algorithm (ACA) [43] to segment the image in KACA = 4 classes based on color, and “painting” the segments with the average of each class. ACA is an iterative algorithm that can be regarded as a generalization of the K-means clustering algorithm [28, 55] in two respects: it adapts to local variations in image intensity and includes spatial constraints in the form of Markov random fields (MRFs). We will refer to the resulting image, which preserves the structure of the original image, and consolidates the point clouds of each dominant color into points in color space, as the posterized texture. The posterized texture for the original texture image of Fig. 2(a) is shown in Fig. 2(c). The color composition of the texture consists of the (dominant) colors of this posterized texture and their percentages, shown in Fig. 2(d). We then synthesized textures with the same or modified color composition. We used three types of structural patterns for the synthetic textures: isotropic blobs, squares, and rectangles. As in the Julesz experiments [19], the synthesized textures were designed to eliminate familiarity cues, and the pattern shapes were chosen to create different structures (shape, scale) so that we can test their effect on the perceived color composition. An example of a synthetic texture with isotropic blobs is shown in Fig. 2(e).
We conducted three empirical studies with the synthetic textures to determine the effects of structure on the perception of color composition. In the first study, we compared the structure of the posterized texture with isotropic blob synthetic textures that have varying target color percentages. In the other two studies, we used square and rectangular synthetic textures to investigate the effect of scale and shape on the perceived amount of the target color. We conducted the empirical studies in the form of two-alternative forced choice (2AFC) tests to determine which of a pair of patterns is perceived as containing a larger amount of a given target dominant color. The main conclusions of our empirical studies are that (a) participants are able to consistently assess differences in color composition for textures of similar scale and shape, and (b) pattern agglomeration in both scale (larger) and shape (less elongated) has a strong positive influence on the perceived amount of a target color. Thus, the perception of color composition is nonveridical.
The question is then: What are the perceptual mechanisms that can account for the results of our empirical studies? First, the results are consistent with Julesz’s texton theory [20], whereby the size and shape of the textons affect the texture perception. In Section 5, we present a simple model that estimates the contribution of each pixel to the perceived amount of the target color. Pixels near the blob boundaries contribute less than pixels at the center of the blobs. While there is a large literature on texture and color perception, we could not find any perceptual mechanisms that can explain such an edge effect. Here we should clarify that the size of the color blobs in our studies was selected so that the blobs are perceived as distinct patches of color with sharp edges. There is no averaging across the blob boundaries, even though a simple linear filter model based on estimates of the spatial frequency sensitivity of the eye (e.g., in [32]) predicts averaging over a few pixels at the given display resolution and viewing distance. The perception of sharp boundaries can be attributed to adaptation [12] or color spreading [47], but neither provides a solid explanation. In addition, with only a couple of exceptions, the differences in the colors of the blobs are well above threshold in both luminance and chrominance, so that differences in contrast sensitivity of luminance and chrominance edges [24] and changes in contrast sensitivity based on spatial pattern [48] or interactions between chrominance and luminance [53] cannot account for the observed results, and the effects of scale in particular. Another interesting observation is that, as in the case of texture metamers [8], all pixels in the color blobs are clearly visible, yet their contributions to the overall perception of color composition are different.
Webster et al. [57] and Maule and Franklin [36] conducted experiments with ensembles of distinct color blobs, like ours, but in regular formations of color circles. However, the emphasis was on the perception of the average color rather than the color composition.
1.3
Related Work
Objective descriptors of the color composition of an image have been extensively studied in the image retrieval literature over the past decades. The most straightforward way for describing the color content of an image is via a color histogram; two images are then compared using a histogram distance metric [50, 52]. Manjunath et al. [31] review three descriptors based on histogram representation for the MPEG-7 standard: the scalable color descriptor, the dominant color descriptor, and the color layout descriptor. The scalable color descriptor is a color histogram of an image encoded based on the Haar transform. The dominant color descriptor describes the colors of an image using a small number of dominant color values and the related statistical properties. The color layout descriptor captures the spatial distribution of dominant colors based on the discrete cosine transform (DCT).
The use of dominant colors and associated percentages as a compact color representation for image analysis was introduced by Ma et al. [29] and Deng et al. [9] and adopted by Mojsilovic et al. [38]. They argued that, when evaluating the color composition of an image, the visual system discounts local subtle variations and focuses on a few dominant colors.
In addition to an appropriate color representation, the color composition of images must be compared in a way that agrees with human perception. Mojsilovic et al. [37] proposed the OCCD, which is implemented in CIELab space and which is closely related to the EMD [49]. In the paper that introduced EMD, Rubner et al. [49] also emphasized the need for compact color representations, which is consistent with the use of dominant colors.
In line with these findings, and in order to account for the nonuniformity of the statistical characteristics of natural textures, Chen et al. [7] introduced the idea of spatially adaptive dominant colors in the context of color texture segmentation and proposed the use of ACA [43] to estimate them and OCCD [37] to compare them. Zujovic et al. [59, 60] then incorporated the spatially adaptive dominant colors and the OCCD into a structural texture similarity metric that, as we discussed above, assumes that color composition and texture structure can be estimated independently.
2.
Texture Analysis and Synthesis
To analyze the effects of structure on the perceived color composition of a texture image, we first estimate its color composition in terms of dominant colors [7] and then synthesize textures with the same color composition and different structures.
2.1
Color Composition Feature Extraction
As we discussed in the introduction, we estimate the color composition of a texture image by extracting the dominant colors and the associated percentages, using ACA [43] to segment the image into regions of slowly varying colors with rapid changes at the boundaries. As we saw, this results in the posterized images of Fig. 2(c).
For spatially homogeneous textures, a small number of segment classes, typically KACA = 2 to 4, is sufficient to capture the dominant structure and colors of the image. Pappas et al. [44] found that, for natural images, the majority of segments containing perceptually uniform textures can be characterized by just the first two dominant colors for effective texture classification. Similarly, He and Pappas [14, 15] proposed a segmentation algorithm that is based on the fact that natural textures consist of intensity variations of a single hue [41]. However, as we discuss in Section 3, for our experiments we selected stimuli that have a variety of patterns and colors, with KACA = 4.
The feature vector that specifies the color composition, shown in Fig. 2(d), consists of the KACA averages, expressed in CIELab color coordinates Lk, ak, bk and the associated color percentages pk with k = 1, …, KACA.
Among the extracted dominant colors, we define the most illuminant color as the color with the highest value in the luminance (L) channel and with percentage at least 20%. We also define the most distinct color as the color with the largest average ΔE distance from the other dominant colors. The ΔE distance between two colors (L1, a1, b1) and (L2, a2, b2) is determined as follows:
(1)
ΔELab=(ΔL)2+(Δa)2+(Δb)2,
where ΔL = L1L2, Δa = a1a2, and Δb = b1b2. The selection of the most illuminant and most distinct colors for the empirical studies we describe below was arbitrary. Initially, we thought that it would make it easier to run our studies. However, we have no evidence of that, and expect that similar outcomes would be observed with any other color choice.
2.2
Texture Generation
Our goal is to synthesize textures with a given color composition but with structure different from that of the posterized texture. We used two approaches for generating textures, one with isotropic blobs and the other with blocks of different geometries (squares, rectangles, lines) and scales.
2.2.1
Isotropic Blobs
To obtain textures that consist of blobs with colors and percentages that correspond to the given color composition, we rely on MRFs [4, 5, 23]. For more details, see appendix A.
For the first empirical study, we generated a number of blobby textures by varying the percentage of the target color, and adjusting the percentages of the other colors accordingly. For each set of colors and each set of percentages, we synthesized a new texture from scratch. Examples are shown in Figure 3(a).
Figure 3.
Synthesized images with (a) isotropic blobs with varying target color percentage, (b) squares of varying scale, and (c) rectangles with varying height/width ratio.
2.2.2
Geometric Blocks
As an alternative to isotropic blobs, we consider the problem of synthesizing textures that consist of blocks with different geometric shapes and different scales. In principle, this could be done by adjusting the parameters of the MRF model; however, this is computationally intensive, and it is difficult to control the shape of the blocks. So, we adopt a more direct approach that places blocks of different colors and a given (rectangular) shape at different locations in the image; this is a manifestation of the “dead leaves” technique [6, 27, 35], and is designed to generate textures with a given scale and shape and a given color composition.
Given a set of colors and associated percentages, it is in general impossible to generate perfectly tiled images consisting of rectangular blocks of a fixed shape and size. Instead of perfectly tiled images, the idea is to place fixed shape/size blocks of different (dominant) colors at random positions in the image. This means, of course, that the blocks will overlap. To achieve the desired color percentages, we select the color of each block we place with probability equal to the percentage of that color. However, due to the random block overlap, the resulting percentages of each color will not be the same as the target percentages. We thus need an iterative procedure that will closely approximate the desired color percentages. The details can be found in appendix A. By selecting square blocks of a different fixed size for each image, we can get textures of different scales, as shown in Fig. 3(b). By controlling the height/width (H/W) ratio of the blocks, we can generate more or less elongated textures, as shown in Fig. 3(c).
When the percentage changes, the number of blocks of each color changes but, in principle, the shape and scale remain the same. However, due to the block overlap and random placement, this approach provides only approximate control of the scale and shape of the texture patterns. Quantitative analysis and illustrations of such effects can be found in Figure 11 of Study 2 and Figure 14 of Study 3.
An alternative approach to achieve a given color composition would be to keep the probability of placement fixed and to vary the size of the blocks based on the percentages. However, this approach does not provide good control of the scale of the resulting textures.
3.
Empirical Studies
In this section, we describe three empirical studies to determine the effects of texture structure on the perception of color composition. In the first study, we compare the posterized texture with isotropic blob synthetic textures that have varying target color percentages, in order to determine whether there is a difference in the perceived target color percentages of the two texture structures. In the other two studies, we investigate the effect of scale and shape on the perception of the percentage of the target color. All three studies were designed as 2AFC tests.
3.1
Test Setup
3.1.1
Participants
Fifteen volunteers, six female and nine male, with ages ranging from 20 to 50, participated in each of the three studies. All participants had normal or corrected-to-normal vision and were tested for color blindness and red–green color vision deficiency. Before the test, all participants were asked to read and sign a consent form.
3.1.2
Apparatus
The tests were conducted using a calibrated LCD screen with 1920 × 1080 resolution and linear gamma. The viewing distance was approximately 60 cm so that a 256 pixel wide image subtended an angle of 9.39 degrees.
3.1.3
Texture Stimuli
For our empirical studies, we selected seven original full color textures, shown in Figure 4(a). The textures were obtained from the Corbis database,1
1
http://www.corbis.com
correspond to real-world images, and were selected to have a variety of interesting patterns and colors. Since most natural textures have only a couple of dominant colors [15, 44] that typically consist of intensity variations (caused by changes in illumination) of a single hue (which corresponds to a single material) [41], we selected textures of flowers, fruits, corals, and fabrics that have four distinct dominant colors, as well as a variety of patterns. The posterized textures, obtained by ACA segmentation of the original textures, are shown in Fig. 4(b). Fig. 4(c) shows the color composition of the posterized textures of Fig. 4(b) with the target color underlined. (Note that Texture 5 contains a small amount of a fourth color, gray, that is visible at the upper left and right corners.) The length of each color bar represents the percentage. Figure 5(d) shows the grayscale component (loosely, luminance) of the posterized textures. Observe that the dominant colors of each texture differ in luminance, with two exceptions: Two of the colors in Texture Sets 5 (cyan and magenta) and 6 (olive and blue) have the same luminance, and only one of these colors (cyan in Texture Set 5) is a target color. Thus, as we discussed in the introduction, the colors of the blobs in the synthesized textures differ in both luminance and chrominance, and hence differences in the contrast sensitivity of luminance and chrominance edges [24] cannot account for the results of our experiments.
Figure 4.
Texture stimuli for Study 1.
Figure 5.
Texture stimuli for Study 2.
The texture stimuli for our empirical studies contain nine sets of texture images that include posterized and synthetic images, cropped to 128 × 128 pixels and upsampled to 256 × 256 by pixel repetition. Note that Texture Sets 8 and 9 are the same as Texture Sets 2 and 7, respectively, but have different target colors.
3.1.4
Texture Stimuli for Study 1: Posterized versus Varying Percentage Isotropic Blobs
Each set includes one posterized texture and seven synthetic textures that share the same dominant colors with different percentages. Fig. 4(c) shows the color composition of the posterized textures of Fig. 4(b) with the target color underlined. The length of each color bar represents the percentage. Fig. 4(e) shows seven isotropic textures for each set, each of which was synthesized with target color percentage that differs by −9%, −6%, −3%, 0%, +3%, +6%, and +9% actual percentage points from the corresponding posterized texture. The percentages of the remaining colors were adjusted proportionately. Note that the posterized images of Texture Sets 8 and 9 are the same as those of Texture Sets 2 and 7, respectively, but the target colors are different, and so are the realizations of the synthetic textures. The target colors in Texture Sets 1–7 are the most illuminant colors, while the target colors in Texture Sets 8 and 9 are the most distinct colors.
With 8 textures (1 posterized and 7 synthetic), there are 28 possible image pairs in each set. Based on a preliminary test, when the actual difference in the amount of target color exceeds 9%, the difference is obvious and the participants are able to consistently select the image with the higher color amount. We thus only selected pairs with 9% or less color difference. This results in 15 synthetic–synthetic (S–S) pairs and 7 synthetic–posterized (S–P) pairs for each texture set. To balance the occurrence of S–S and S–P pairs, we repeated each S–P pair twice.
3.1.5
Texture Stimuli for Study 2: Posterized versus Varying Scale Square Blocks
The texture stimuli contain nine sets of color texture images. Each set includes one posterized texture, the same as that used in Study 1, and four synthetic textures of varying scale that share the same color composition with the posterized texture. Fig. 5(a) shows the posterized textures, and Fig. 5(b) shows their color composition with the target color underlined. The synthetic textures were generated with squares of sizes 8 × 8, 16 × 16, 24 × 24, and 32 × 32, to obtain different scales, as shown in Fig. 5(c). The actual color composition of each synthetic image is the same as that of the corresponding posterized texture image.
However, to add more variability to the test patterns, we generated additional textures for each of the four scales of each color set with an additional 3% of the target color, while the other colors were adjusted proportionately. These textures are shown in Fig. 5(d).
Thus, in each set we have one posterized texture and a total of eight synthetic textures, two for each scale. In addition to gathering more data, we found that the added variability was necessary in order to stimulate the participants’ interest, offering some relatively easy choices along with the more challenging ones, for which the participant might select one image at random. This keeps the participant alert and discourages reverting to random selection for all image pairs.
Note that in Fig. 5(c), even though the target colors are different, the synthetic images for Texture Sets 8 and 9 are the same as those of Texture Sets 2 and 7, respectively, because the color compositions are the same. However, in Fig. 5(d), the color compositions are different and so are the realizations.
With 9 textures in each set (one posterized and 8 synthetic), there are 28 possible S–S and 8 S–P pairs for presentation to each participant. To balance the occurrence of S–S and S–P pairs, we repeated each S–P pair three times.
Figure 6.
Examples of texture stimuli for Study 3.
3.1.6
Texture Stimuli for Study 3: Varying Shape of Rectangular Blocks
The texture stimuli contain nine sets of color texture images. Each set includes four synthetic textures of varying shape that share the same dominant colors and percentages with the posterized texture of the corresponding set in Studies 1 and 2. The posterized textures were not included in this study. The synthetic textures were generated with rectangles with H/W ratios 1 : 1, 2 : 1, 4 : 1, and 8 : 1, that is, with square and rectangular blocks with different elongation factors. As we discussed, all of the rectangular blocks have the same area in order to maintain a constant scale. Note that, in contrast to the other two studies, the size of the rectangular block for each set was based on the estimated scale of the target color in the posterized texture; the scale estimation algorithm is presented in Appexdix B. Figure 6(a) shows the posterized textures, and Fig. 6(b) shows their color composition with the target color underlined. Fig. 6(c) shows the synthetic textures with the color composition shown in Fig. 6(b). As in the varying scale study, for each H/W ratio, we also generated textures with an additional 3% of the target color, shown in Fig. 6(d), for more variability. Note that, since the scale of each synthetic image is based on the estimated scale of the target color in the posterized texture, the scales of Texture Sets 2 and 8 are different; the same is true for Texture Sets 7 and 9.
With 8 textures in each set (all synthetic), there are 28 possible pairs for presentation to each participant.
3.1.7
Procedure
The empirical studies were designed as 2AFC tests. The graphical user interface is shown in Figure 7. A sequence of image pairs was presented to the participants side by side. Each image pair contained textures that had the same dominant colors (corresponding to the same posterized texture) but differed in texture structure and/or target color percentage. The positions of the images in a pair were randomized in each trial to eliminate response bias. The participants were asked to select the image that contained a higher percentage of the target color using keyboard shortcuts.
Figure 7.
Graphical user interface.
The three studies (isotropic blobs, square textures of different scales, and textures with different rectangle shapes) were conducted separately. To prevent any participant biases based on parameter values (e.g., blob size or shape), image pairs that correspond to the nine different posterized images were mixed up and presented in random order. There were no time limits in any of the tests. However, the participants were encouraged to proceed at a comfortably fast pace.
4.
Analysis of the Results
4.1
Analysis of Study 1
Figure 8.
Analysis of the results of Study 1. Ranking the preference scores to generate the perception of a larger amount of color for synthetic textures with varying actual target color amount. The x-axis represents the target color amount difference (synthetic–posterized). The y-axis represents the Z-score for each image using Thurstonian scaling. The dotted lines correspond to the posterized texture images in each texture set. The solid blue lines are linear regressions fitted to the synthetic images of each texture set. The R2 values of the fitted regressions are shown in the upper left corner.
Table I.
Perceived color amount difference between the posterized and the synthetic (0%) textures and the corresponding difference in scale, color, and lightness.
Posterized–Synthetic (0%)Set 1Set 2Set 3Set 4Set 5Set 6Set 7Set 8Set 9
Z-score(ΔZ)0.879−0.509−0.2080.337−1.226−0.4410.1830.089−0.057
Scale(ΔS)4.98−2.83−2.36−1.41−13.3−4.65−2.012.782.01
Adjacent color(ΔE)17.027.455.664.260.575.930.878.558.2
Lightness(ΔL)0.0610.1590.9050.7370.039−0.2500.1860.1510.313
Fitted regressionΔZ = c1ΔS + c2ΔL + c3ΔE + interp
Coefficientsc1 = 0.093c2 = 0.16c3 = −0.004interp = 0.26
p-value: 0.009p-value: 0.64p-value: 0.45p-value: 0.43
Standardized0.830.100.16
Fitted regression has R2 = 0.81, p-value = 0.029
The first study was carried out with the posterized textures and the synthetic isotropic blob textures. As we discussed, the goal of this study was to determine whether the difference in structure between the posterized texture and the synthetic isotropic blob textures affects the perception of the target color amount. As we will see, this study also demonstrates that the perceived differences in the amount of target color are consistent with the actual color percentages.
We employed Thurstonian scaling [54] to convert the 2AFC results to preference scores for each texture set. The model assumes that the relative magnitudes of the preferences for the stimuli can be determined by the winning frequencies that one stimulus is selected over another in a paired comparison task. We accumulated the comparative choices across participants for each pair and computed a preference matrix for each texture set with the winning frequencies between 0 and 1. The values in each preference matrix were omitted and treated as missing values when the winning frequency was too small (< 0.02) or too large (> 0.98) to give stable estimates [11]. The diagonal values were set to 0.5. We then applied the Thurstone Case V model to convert pairwise preferences to continuous perception scores. The scores were further normalized to Z-scores to facilitate evaluation across the texture sets. The Z-scores are obtained by subtracting the mean and dividing by the standard deviation. Larger Z-score indicates stronger perception of the target color amount.
Figure 8 displays the Z-scores of each texture set as a function of the physical target color percentage difference. The dotted line in each plot represents the perception of the posterized image among the synthetic images. The overall increasing tendencies in Fig. 8 show that the participants are capable of perceiving the changes in the amount of target color. The fitted linear regression between the Z-scores and the physical target color percentage difference in each texture set suggests that the perceived color amount is linearly related to the physical percentage difference in target color. We counted the correct responses of the 2AFC results between S–S pairs. The probabilities of correct response for 3%, 6%, and 9% target color differences are 0.82, 0.9, and 0.98, with 36, 45, and 36 samples, respectively, which indicates that the just noticeable difference of color amount is below the 3% difference in color.
By comparing the Z-scores of the posterized and the synthetic images, we notice that the perceived target color amount of most texture sets is between the perceived target color amount of the synthetic images with ± 3% actual target color amount difference. The only exceptions are Texture Sets 1 and 5. For Texture Set 1, the posterized texture is perceived as having a much higher percentage of the target color than the synthetic image with 0% target color difference, while the opposite is true for Texture Set 5. Table I lists the perceived target color difference (ΔZ) of each texture set.
Figure 9.
Average lightness of different synthetic images.
We now examine the factors that may have caused the perceived color amount difference between the posterized and the synthetic image (0%). Three possible factors are explored: (a) the scale difference of the target color blobs in the posterized and synthetic images (ΔS); (b) the lightness difference between the posterized and the synthetic images (ΔL); (c) the color distance between the target color and the most similar adjacent color (ΔE).
One obvious difference is the color scale. For Texture Set 1 of Fig. 4, the target color blobs of the posterized texture appear to be larger than those of the synthetic textures, while the opposite is true for Texture Set 5. To quantitatively check the above observations, we calculated the average linear scale of the target color blobs in each image as the geometric mean of the average horizontal and vertical lengths of the blobs, as described in appendix B. Table I lists the scale difference (ΔS) between the texture synthesized with 0% difference in the target color and the posterized texture. To check how the scale difference relates to the perceived target color amount difference, we fitted a linear regression between ΔZ and ΔS (ΔZ = cΔS + interp). The estimated coefficients (c = 0.1, p = 0.002, interp = 0.08) with R2 = 0.778 show that the scale difference has high positive correlation with the perceptual difference.
Another factor that may have influenced the outcome of our experiments is the average lightness of the image. Note that if the target color is lighter or darker than the other colors, then by modifying the amount of target color we are also modifying the average lightness of the image. Thus, one could hypothesize that the participants may have ordered the textures according to overall lightness rather than according to the amount of perceived target color, as instructed. Figure 9 plots the average lightness of each synthetic image for each texture set. Note that the most dramatic changes occur in Texture Sets 3, 4, 6, 7 (increasing slope), and 9 (decreasing slope). However, the placement of the posterized texture does not seem to be related to the change in average lightness. The lightness difference ΔL between the posterized and the synthetic (0%) images for each texture set is listed in Table I. Similar to the analysis of scale difference, we fitted a linear regression between ΔZ and ΔL (ΔZ = cΔL + interp) to check the relation between the perception and lightness. The estimated coefficients (c = 0.36, p = 0.57, interp = −0.198) with R2 = 0.047 show that the lightness does not play a significant role in influencing the perceived difference in color amount.
Apart from the color scale and lightness, the similarity of spatially adjacent colors could also affect the perceived target color amount, especially for Texture Set 1. In Texture Set 1, the most similar colors (two shades of strawberries) are adjacent in the posterized texture but randomly placed in the synthetic texture. ΔE in Table I lists the distance between the target color and the most similar adjacent color for each texture set. Note that the most similar adjacent color (dark red) occurs for Texture Set 1; for all the other sets, the difference between adjacent colors is quite large, and hence does not seem to have any effect on the perceived target color amount.
To investigate the relative contributions of each factor, we fitted a multiple regression with the three factors on the perceived color amount difference ΔZ (ΔZ = c1ΔS + c2ΔL + c3ΔE + interp). The estimated coefficients with the corresponding p-values and standardized coefficients are listed in Table I. Note that ΔS and ΔL contribute positively to ΔZ, and ΔE negatively, but the p-values and the standardized coefficients show that only the ΔS contributions to ΔZ are statistically significant, and that the contributions of the other independent variables are negligible.
In the analysis of Study 2 below, where we vary the scale of the blobs for a fixed color composition (and hence fixed lightness), we further investigate the relationship between the target color scale and the perception of target color amount.
4.2
Analysis of Study 2
The goal of this study was to consider the direct effects of scale on the perceived amount of the target color. This study was carried out with the posterized textures and textures synthesized with squares of different sizes. We compared the synthetic textures to each other, as well as to the posterized texture. As shown in Fig. 5, each color set has four different scales (generating block sizes of 8 × 8, 16 × 16, 24 × 24, and 32 × 32) with the same color composition, and the same four scales with +3% of the target color.
As in Study 1, we employed Thurstonian scaling [54] to convert the 2AFC results to preference scores for each texture set. Using the nine sets as replication, a repeated-measures analysis of variance (ANOVA) with two within-subject factors (block scale level and percentage) verified that the perceived target color amount is affected by the scale (block size), F(3,24) = 123.4, p < 0.0001, and by the actual color amount change, F(1,24) = 109.3, p < 0.0001. There is no interaction between the block size and actual color amount, F(3,24) = 0.578, p = 0.635.
Figure 10 shows the Z-scores of each texture set. A higher score indicates a higher amount of perceived target color. It is no surprise that the values for the +3% images are higher than those for the 0% images at each scale since the perceived color amount is consistent with the actual color amount, as shown in Study 1. In addition, the increasing scores for each of the texture sets in Fig. 10 demonstrate that pattern agglomeration (increasing scale) results in the perception of increasing target color amount. The score of the posterized texture is shown in dotted black line for each texture set. It is clear that the placement of the posterized images varies considerably across the texture sets.
Figure 10.
Analysis of the results of Study 2. Ranking the preference scores to generate the perception of a larger amount of color for synthetic textures with varying pattern scales—with the same color composition as the posterized texture (0%) and + 3% target color—and posterized texture (dotted line).
Figure 11 presents the average linear scale of the target color blobs of the posterized and synthetic textures. A two-way ANOVA was employed to test whether, in addition to the generating block size, the + 3% color difference affected the scale values. The analysis shows that apart from the statistically significant effect of block size (F(3,24) = 73.9, p < 0.0001), the average linear scale is also affected by the actual color percentage difference (F(1,24) = 5.84, p = 0.02). There is no interaction between the block size and actual color amount, F(3,24) = 0.29, p = 0.83.
Figure 11.
Analysis of the results of Study 2. Estimated average scale of target color in each image—with the same color composition as the posterized texture (0%) and + 3% target color–and posterized (dotted line).
Note that for Texture Sets 1, 4, 8, and 9, the linear scale of the posterized texture is relatively higher compared to that of the synthetic textures, and the scale of Texture Set 5 relatively lower, which is consistent with the results in Fig. 10. Note, however, that the relative location of the posterized (dotted black line) compared to the synthetic textures in Fig. 10 is generally higher than the corresponding location of the posterized relative to the synthetic textures in Fig. 11. Here we should also point out that even though the images synthesized with a given generating square size are expected to have the same scale, and hence the 0% and + 3% bar heights are expected to coincide, the actual estimated scales differ due to the varying percentages (as we noted above, higher percentages result in higher probability of agglomeration) and the randomness in the block placements.
To summarize the relationship between color scale and color amount perception, Figure 12 shows a combined view of Figs. 10 and 11 across all texture sets (posterized textures excluded). The position of each dot is obtained by averaging the linear scales (x-axis) and the Z-scores (y-axis) of all synthetic textures with the same color block scale (8 × 8, 16 × 16, 24 × 24, 32 × 32) and the same actual color amount difference (0%, +3%). We used linear regression (Z = b ⋅ Scale + δ ⋅ColorAmountDifference + interp) to investigate the influence of the average linear scale on the perceived color amount (Z-score) with the actual color amount difference as a dummy variable. The estimated coefficients (slope: b = 0.102, p < 0.001; δ = 0.709, p < 0.001; interp = −2.48, p < 0.001) demonstrate that there exists a linear positive relationship between the target linear scale and the perceived color amount.
Figure 12.
Effects of average linear scale on the Z-scores of the perceived color amount. Error bars are the standard error of the mean score and average linear scale across all texture sets. The dashed lines are linear regression lines fitted to all the data points with the actual color amount as a dummy variable.
4.3
Analysis of Study 3
The goal of this study was to investigate the effect of shape on the perception of the amount of the target color. In this study, we only compared synthesized textures (with rectangles of different H/W ratios) to each other. The analysis is similar to that of the second study. Using the nine textures as replication, a repeated-measures ANOVA with two within-subject factors (elongation level and percentage) verified that the perceived target color amount is affected by the H/W ratio, F(3,24) = 16.46, p < 0.0001, and by the actual color amount change, F(1,24) = 190.8, p < 0.0001. The actual color amount and elongation degree in structure are independent with no interaction, F(3,24) = 0.654, p = 0.589.
Figure 13 shows the estimates of the perceived scores within each color set. The labels of the x-axis are the H/W ratios of color blocks used to synthesize each texture. The + 3% synthesized textures are almost always higher than the 0% synthesized textures at each H/W ratio due to the increase in the actual target color amount. Apart from Texture Set 6, the general trend is that the perceived amount of target color decreases as the geometric shape becomes more elongated (H/W ratio increases) for both the 0% and the + 3% textures. One possible explanation of the weak relation between shape and color perception in Texture Set 6 is the influence of pattern scale, which is considerably smaller than in the other sets. While the H/W ratio was changed, the scales of all synthesized textures in this study were designed with scales similar to the posterized texture. When the pattern scale is small, the shape variations are not as noticeable as they are in the larger pattern scales.
Figure 13.
Analysis of the results of Study 3. Ranking the preference scores to generate the perception of a larger amount of color for synthetic textures with varying pattern shapes—with the same color composition as the posterized texture (0%) and + 3% target color.
Figure 14.
Analysis of the results of Study 3. Estimated average elongation of target color in each image—with the same color composition as the posterized texture (0%) and + 3% target color.
Figure 14 shows the bar plots of the average elongation degree of each texture composed of color blocks with the specified H/W ratio. The average elongation degree is defined as max(Lv,Lh)min(Lv,Lh), where Lv and Lh are the average vertical and horizontal lengths of the target color blobs based on the algorithm in Appendix A. As expected, the elongation degree increases as the color block H/W ratio increases. Note, however, that the resulting elongation degree is not equal to the H/W ratio, due to block overlap and random block placement. As in the analysis of the scale study, a two-way ANOVA was employed to test whether, in addition to the generating block H/W ratio, the + 3% color difference affected the elongation degree values. The analysis shows that apart from the statistically significant effect of color block H/W ratio (F(3,24) = 231, p < 0.0001), the influence of actual color percentage difference on the average elongation degree is not statistically significant (F = 0.97, p = 0.33). There is no interaction between the color block H/W ratio and the actual color amount, F(3,24) = 0.5, p = 0.68.
To summarize the relationship between color elongation and color amount perception, Figure 15 shows a combined view of Figs. 13 and 14 across all texture sets. The position of each dot represents the average elongation degree (x-axis) and the Z-score (y-axis) of all synthetic textures with the same color block ratio (1 : 1, 2 : 1, 4 : 1, 8 : 1) and the same actual color amount difference (0%, +3%). We used linear regression (Z = b ⋅Elongation + δ ⋅ColorAmountDifference + interp) to investigate the influence of shape (average elongation degree) on the perceived color amount (Z-score) with the actual color amount difference as a dummy variable. The estimated coefficients (slope: b = −0.38, p < 0.001; δ = 1.366, p < 0.001; interp = 0.217, p = 0.08) demonstrate that there exists a linear negative relationship between the elongation degree and the perceived color amount.
Figure 15.
Effects of average elongation degree on the Z-scores of perceived color amount. Error bars are the standard error of the mean score and average elongation degree across all texture sets. The dashed lines are linear regression lines fitted to all the data points with the actual color amount as a dummy variable.
5.
Modeling the Results
An important question to be addressed is whether there is a model that can explain and predict the results of our empirical studies. While it would be desirable to come up with a model of the underlying visual mechanisms that explain the observed effects, in this section we propose a model that estimates the contribution of each pixel to the perceived amount of the target color, as determined by our empirical studies. We hope that this will stimulate interest in exploring the underlying visual mechanisms.
Our hypothesis is that there is an edge effect, whereby the pixels near the blob boundaries contribute less to the perceived target color amount than pixels at the center of the blobs. That is, the visibility of a pixel decreases as the pixel approaches the closest boundary. We will assume that this effect is limited to a distance of a few pixels from the boundary.
To estimate the distance of each pixel from the closest boundary, we rely on mathematical morphology [33]. To obtain the pixels that are adjacent to a color boundary, we apply a one-pixel erosion operator to the map of the target color. The eroded pixels comprise the first layer of pixels that are at a distance of one pixel from a boundary. We then apply a one-pixel erosion to the remaining pixels to obtain the second layer of pixels that are at a distance of two pixels from a boundary. We can continue this process to obtain multiple layers at different distances from the boundaries. Figure 17 shows an example of the iterative erosion method; Fig. 17(a) shows a color segment from one of the synthesized images, Fig. 17(b) shows the decomposition into layers, and Fig. 17(c) shows the number of pixels in each layer.
Let P(t) represent the perceived proportion of a texture image that is taken by a given target color t. Assume there are K boundary layers in total, the first being the outermost layer of each color segment and the Kth being the innermost layer of the largest segment. Then P(t) is given by the layer-weighted area of the target color
(2)
P(t)=1Ntk=1KwkNt,k,
where Nt, k is the number of pixels in a layer that is at a distance of k pixels from the closest boundary, Nt is the total number of pixels of the target color t, and wk is a weight associated with the visibility of the kth layer.
For the layer weights, we tried a hyperbolic tangent function
(3)
wk=tanh(ak+b)=e(ak+b)e(ak+b)e(ak+b)+e(ak+b),a+b0,a>0,
where k is the layer index, wk takes values in the interval [0,1], and a and b are constants controlling the saturation speed and shift of wk, respectively. With large a, the weights saturate quickly to 1. Using a = 0.5, b = −0.25, we obtained weights 0.24, 0.63, and 0.85 for the outermost layers, with the weights for the remaining inner layers taking values close to 1. In a limiting case, w1 = 0 and wk = 1 for k > 1 (a = 5, b = −5). The reason for these choices is that visibility is reduced near the boundaries and increases rapidly as we move away from the boundaries. Of course, all this depends on the viewing distance and display resolution. As we discussed in the introduction, the viewing distance and display resolution in our experiments are such that there is very little filtering across the boundaries. Finally, we also tried linearly increasing weights as well as the default constant weights wk = 1 for all k (no edge effect). Three different weighting strategies are illustrated in Figure 16.
Tables II and III show the Pearson correlation coefficient between the model estimates and the perceived target color amount (Z-scores), for each texture set, for the scale and shape studies, respectively. We also calculated the average correlation coefficient across all texture sets as the inverse transform of the average of Fisher’s Z-transform of each texture set [51]. The tables compare three parameter settings of the hyperbolic weighting strategy with linearly increasing weights and the default constant weight strategy (wk = 1 for all k).
Table II shows that, for the scale study, all the weighting strategies provide acceptable performance, with the linear weights outperforming the other strategies, and demonstrates the inadequacy of the constant weights. On the other hand, for the shape study, Table III shows that even though the linear weights have higher overall correlation than the hyperbolic weighting schemes, they have relatively low correlation on Texture Set 6 (0.666). Overall, the quick saturation weighting strategy using a hyperbolic weighting scheme with a = 0.5 and b = −0.25 provides a relatively stable strong positive correlation with the perceived color amount, for the best overall performance. However, the performance of the limiting case with w1 = 0 and wk = 1 for k > 1 is almost as good.
Using the hyperbolic weighting scheme with a = 0.5, b = −0.25, we can estimate the perceived color amount for each image in the two studies. The results are plotted in Figure 18 as a function of the measured Z-scores. The plots provide another indication that the model is consistent with the results of our empirical studies.
As we discussed above, we could not find any visual mechanisms that explain the observed edge effect. The closest is a study by Eskew and Boynton [13], who consider compact, spatially localized stimuli with varying width and junction length; however, the conclusions are about variations in contrast sensitivity, which is not likely to have an effect on stimuli with contrast well above threshold.
Figure 16.
Weights for kth layer using different strategies.
Figure 17.
Iterative 1-pixel erosion of a target color segment. (a) Synthetic image. (b) Decomposition of target color segment into layers. (c) Distribution of layer pixel counts.
Table II.
Scale study: Pearson correlation between layer-weighted area of target color and perceived target color amount.
Weight StrategyPearsonSet 1Set 2Set 3Set 4Set 5Set 6Set 7Set 8Set 9Average
a = 0.5, b = −0.25Correlation0.8960.9110.9820.9380.9190.9580.9500.9320.8880.938
p-value0.00260.00170.00010.00060.00120.00020.00030.00080.0032
a = 0.5, b = 0Correlation0.8380.8810.9340.9380.9310.9540.9380.8500.7790.907
p-value0.00930.00390.00070.00060.00080.00020.00060.00750.0229
w1 = 0, wk = 1 for k > 1Correlation0.8820.8930.9780.9330.9180.9570.9420.9350.8760.932
p-value0.00370.00290.00000.00070.00130.00020.00050.00070.0044
Linear weightsCorrelation0.9440.9450.9770.9020.9230.9150.9630.9680.9830.954
p-value0.00040.00040.00000.00220.00110.00150.00010.00010.0000
wk = 1 for all kCorrelation0.4010.5410.5800.6330.4480.5010.4040.5160.3280.489
p-value0.32430.16630.13250.09180.26610.20600.32150.19050.4284
Table III.
Shape study: Pearson correlation between layer-weighted area of target color and perceived target color amount.
Weight StrategyPearsonSet 1Set 2Set 3Set 4Set 5Set 6Set 7Set 8Set 9Average
a = 0.5, b = −0.25Correlation0.8520.7500.8560.8870.8810.7490.9420.7500.7200.837
p-value0.00720.03210.00660.00330.00380.03610.00050.03210.0440
a = 0.5, b = 0Correlation0.8120.6790.8240.8600.8650.8450.9340.7420.7130.823
p-value0.01430.06410.01200.00620.00550.00830.00070.03490.0473
w1 = 0, wk = 1 for k > 1Correlation0.8410.7300.8610.8820.8660.7200.9420.7420.7250.830
p-value0.00890.03980.00600.00380.00550.04380.00050.03500.0417
Linear weightsCorrelation0.9400.8640.8920.9170.906  0.6660.8940.8150.7490.868
p-value0.00050.00560.00290.00140.00190.07170.00270.01360.0325
wk = 1 for all kCorrelation0.7000.4860.7420.7840.8210.9580.8750.7130.6700.786
p-value0.05300.22190.03500.02130.01250.00020.00440.04720.0693
Figure 18.
Model estimates versus measured Z-scores of perceived color amount for textures in (a) scale study and (b) shape study. The root mean squared error of the estimates for the scale study is 0.38 and for the shape study is 0.45. The dashed lines are fitted regression lines with slope 1 and intercept 0.
6.
Discussion and Conclusions
We investigated the influence of texture structure on the perception of color composition through a series of empirical studies. We relied on color segmentation (adaptive clustering) to estimate the color composition of a given texture image, and synthesized new textures with the same color composition but different structures, consisting of isotropic blobs and geometric blocks of different scales and shapes.
The first observation is that when scale and shape are not changing significantly, there is a linear relation between the actual color amount and the values derived from the 2AFC experiments. This suggests that the participants are able to consistently assess differences in color composition for textures of similar shape and scale. Second, the results of our empirical studies indicate that pattern scale and shape have a strong impact on the perception of the target color amount. In particular, when images have the same physical amount of a target color, there exists a positive linear relationship between the Z-scores of the perceived color amount and the average linear scale of the target color blobs, and a negative linear relationship between the Z-scores of the perceived color amount and the average elongation degree of the target color blobs. However, we found one indication that the elongation effect might be weakened as the texture scale decreases (Texture Set 6 in Study 3). In addition, we found that there is no interaction between the actual color amount and the scale or the shape.
As we discussed in the introduction and the design of the empirical studies, we did not try to separate the effects of luminance and chrominance. With only a couple of exceptions, the colors of the blobs differ in both luminance and chrominance so that differences in contrast sensitivity of luminance and chrominance edges cannot account for the observed results. Selecting isochrominant stimuli would have led to very similar results, but would have made the stimuli less realistic and less appealing to the participants. In addition to visual appeal, selecting isoluminant stimuli could have induced averaging across the blob boundaries, which we wanted to avoid. Our analysis showed that lightness did not play a significant role in influencing the perceived difference in color amount, which post hoc justifies our selections.
Based on our conclusions, the perceived amount of target color depends on the physical color amount, the scale, and the elongation degree. In Figs. 12 and 15, we showed how the perceived target color amount depends on estimates of scale and elongation, respectively. However, we also found that a relatively simple model that accounts for decreased visibility of the pixels near color boundaries is consistent with the results of our empirical studies.
A somewhat surprising finding is that the increase in the perceived color amount with increasing scale and decreasing elongation is true for two different target colors, the most illuminant and the most distinct color. If the same were true for the other two colors (four in total), the apparent paradox is that the percentages would add up to more than 100%. Alternatively, if the perceived color amount of each color decreases with decreasing scale and increasing elongation, and this were true for all colors, then the percentages would add up to less than 100%, that is, the participants underestimate the amount of each color. We believe that the latter is the case and that the participants treat the rest of the colors as clutter, and apparently, the pixels with decreased visibility near the borders are included in the clutter.
The above finding is a consequence of the fact that we asked the participants to focus on one color. Our empirical studies are essentially equivalent to asking the participants to estimate the percentage of one color, effectively treating all other colors as clutter. If instead we had asked the participants to simultaneously estimate the percentage of each color, we expect that they would have produced numbers that add up to 100%. The testing of this hypothesis is beyond the scope of this article.
As we discussed in the introduction, the results of our empirical studies are consistent with Julesz’s texton theory [20], whereby the size and shape of the textons affect the texture perception. We also found some interesting analogies with well-studied (but not directly related) phenomena, such as texture metamers [8]. Apart from the pixel visibility model we proposed in this article, we could not find any other mechanisms that can explain the results of our studies, which have been motivated from engineering applications and have relied on real-world images that are more complex than typical stimuli used in psychophysical studies. However, we hope that our work raises new challenges for vision research, including the need for a more basic understanding of dominant colors of textures and general images.
Our results have definite implications for texture similarity metrics. If we assume that scale and elongation affect all the dominant colors, any metric adjustments should depend on estimates of the relative scale and elongation degree of each color of the images being compared. Better yet, the metric adjustments should depend on the model we proposed. As we discussed, according to the results of our empirical studies and the model estimates, the perceived color amounts may add up to less than the total texture area. As the scale of the images we compare decreases and the elongation increases, the perceived amount of the target color, and presumably the other colors, decreases. One could then argue that color composition differences should be given less weight than structure differences in the overall evaluation of texture similarity. The specifics of such adjustments will be the topic of future research.
Appendix A.
Texture Synthesis Algorithms
A.1
Isotropic Blobs
The generation of isotropic blobby patterns relies on Markov/Gibbs random fields (MRF/GRF) [4, 5, 23]. We generate sample images with KACA = 4 classes based on the MRF model described in [43] and [59], which assumes that the only nonzero Gibbs potentials are those that correspond to the one- and two-point cliques. According to this model, neighboring pixels are more likely to belong to the same class than to different classes. The strengths of the two-point clique potentials control the size and shape of the blobs, while the strengths of the one-point clique potentials control the percentage of labels in each class. An iterative procedure is necessary to obtain an MRF image with a given percentage of labels in each class. Finally, we “paint” the resulting sample MRF image with the dominant colors as shown in Fig. 2(e).
For the first empirical study, we generated textures by using the same value for all the two-point clique potentials in order to generate isotropic blobs, which represent the most generic structure that maintains the given color composition.
A.2
Geometric Blocks
To generate textures consisting of blocks of different geometries and scales, we propose an iterative algorithm that utilizes randomly placed overlapping fixed sized blocks with the dominant colors. This is a manifestation of the “dead leaves” technique [6, 27, 35].
The iterative block placement procedure is described in Algorithm 1. The upper left corner of each color block is placed at a random position in the image with probabilities given by the desired color percentages. In order to allow random placement of blocks anywhere in the image, including near the texture borders, we generate a canvas of larger size than the posterized texture image and then crop it back to the right size, as shown in Figure A1. The width of the left and upper strip of the larger canvas equals the size of the color blocks. By including blocks with upper left corners in the strip regions, we enable partial block overlap in the upper and left borders of the cropped image. Note that block overlap at the lower and right borders can happen when the upper left corner of a block is placed near the border.
Figure A1.
Example of generating geometric blocks. The background canvas is shown in black.
The algorithm consists of three stages. In Stage 1, the probabilities of placing blocks of different colors at random locations of the extended canvas are equal to the desired color percentages. The iterative block placement continues until the deviation D, computed as the sum of the absolute differences between the target and the current color percentages, is below an initial (higher) threshold Th.
However, as we mentioned above, due to the random block overlap and partial placements (near the borders), the iterative placement procedure is not guaranteed to converge to the desired percentages. So, once the initial threshold is achieved, we need to adjust the placement probabilities in order to facilitate convergence. The iterations will continue in Stage 3, but first we have to make sure that there are no “unpainted” pixels in the canvas.
Fig. A1(c) shows the resulting texture after the first stage. Note that there are some “unpainted” background pixels in the canvas, shown in black in the figure. In Stage 2, we check if there are any “unpainted” pixels in the canvas. If this is the case, we use connected component labeling to find all the connected regions in the background. We “paint” each connected region with one dominant color as shown in Fig. A1(d). The fraction of regions painted with each of the dominant colors is based on the revised (see below) color percentages, not taking into consideration the number of pixels in each region; the exact number of pixels assigned to each color at this stage is not important for algorithm convergence.
In Stage 3, the placement probabilities are updated at the end of each iteration in order to enable and accelerate convergence. The idea is to base the probabilities on the differences between the actual and the target color percentages Δpk=p̂kpk. The revised color probabilities are then obtained as the normalized differences p̃k=ΔpkmΔpm. The third stage ends when the deviation is below a final (lower) threshold Tl.
Appendix B.
Blob Scale Estimation
We propose an efficient method for calculating the average linear scale (in pixels) of the blobs with the same color as shown in Figure B1 and described in Algorithm 2.
Given an input K-level image I, each level of which is painted with a different (dominant) color, and a target level (color), we first generate a binary image Ibw with only the blobs of the target color C. To separate the touching blobs into individual objects, we apply marker-controlled watershed segmentation [46] to the binary image. We first apply the watershed transform to the binary image as a segmentation function. To reduce over-segmented regions generated by the watershed transformation, the segmentation function can be improved by using the marker-controlled watershed segmentation. The marker-controlled watershed segmentation generally utilizes markers for foreground and background to solve the over-segmentation problem. Since the binary image Ibw automatically separates foreground objects (blobs) and background as markers, we can directly fit the segmentation function to its minima at foreground and background locations. Id is the ridge line map of the fitted segmentation. Iwat is the segmented result after applying Id to Ibw. The different colors represent the different connected components.
Figure B1.
Estimation of the average scale of blobs in given target color (Algorithm 2).
Once we get the image Iwat with separated blobs, each painted with a different color, as shown in Fig. B1, we apply a line-based calculation to get the average scale. For each row in the image, we collect all segments of horizontal lines belonging to the blobs. The average horizontal length Lh is the mean of all segments of horizontal lines across the whole image. Similarly, we collect all segments of vertical lines of the blobs and compute the average vertical length Lv. The average area of the target color blobs is the product of Lh and Lv. We use the square root of the area as the linear scale of the target color blobs.
References
1AndersonB. L.KimJ.2009Image statistics for surface reflectance perceptionJ. Vis.91171–17
2BeckJ.1972Similarity grouping and peripheral discriminability under uncertaintyAm. J. Psychol.851191–1910.2307/1420955
3BergenJ. R.ReganD.Theories of visual texture perceptionSpatial Vision, ser. Vision and Visual Dysfunction1991Vol. 10CRC PressCambridge, MA114134114–34
4BesagJ.1974Spatial interaction and the statistical analysis of lattice systemsJ. Royal Statist. Soc. B26192236192–236
5BesagJ.1986On the statistical analysis of dirty picturesJ. Royal Statist. Soc. B48259302259–302
6BordenaveC.GousseauY.RoueffF.2006The dead leaves model: a general tessellation modeling occlusionAdv. Appl. Probab.38314631–4610.1239/aap/1143936138
7ChenJ.PappasT. N.MojsilovicA.RogowitzB. E.2005Adaptive perceptual color-texture image segmentationIEEE Trans. Image Process.14152415361524–3610.1109/TIP.2005.852204
8ChubbC.DarcyJ.LandyM.EconopoulyJ.NamJ.BindmanD.SperlingG.ShapiroA. G.TodorovicD.The scramble illusion: Texture metamersOxford Compendium of Visual Illusions2015Oxford University PressNew York
9DengY.ManjunathB. S.KenneyC.MooreM. S.ShinH.2001An efficient color representation for image retrievalIEEE Trans. Image Process.10140147140–710.1109/83.892450
10DoM. N.VetterliM.2000Texture similarity measurement using Kullback-Leibler distance on wavelet subbandsProc. Int. Conf. Image Proc.3730733730–3
11EdwardsA. L.Techniques of Attitude Scale Construction1983Ardent MediaNew York, NY
12ElliottS. L.HardyJ. L.WebsterM. A.WernerJ. S.2007Aging and blur adaptationJ. Vis.7191–910.1167/7.6.8
13EskewR. T.BoyntonR. M.1987Effects of field area and configuration on chromatic and border discriminationVis. Res.27183518441835–4410.1016/0042-6989(87)90112-X
14HeL.“A clustering approach for color texture segmentation,” Ph.D. dissertation (Northwestern University, Evanston, IL, 2012)
15HeL.PappasT. N.An adaptive clustering and chrominance-based merging approach for image segmentation and abstractionProc. Int’l. Conf. Image Proc.2010IEEEPiscataway, NJ241244241–4
16HoY.-X.LandyM. S.MaloneyL. T.2006How direction of illumination affects visually perceived surface roughnessJ. Vis.6634648634–4810.1167/6.5.8
17HoY.-X.LandyM. S.MaloneyL. T.2008Conjoint measurement of gloss and surface texturePsychological Sci.19196204196–20410.1111/j.1467-9280.2008.02067.x
18HoY.-X.MaloneyL. T.LandyM. S.2007The effect of viewpoint on perceived visual roughnessJ. Vis.11161–1610.1167/7.1.1
19JuleszB.1962Visual pattern discriminationIRE Trans. Inf. Theory8849284–9210.1109/TIT.1962.1057698
20JuleszB.1981Textons, the elements of texture perception and their interactionsNature290919791–710.1038/290091a0
21JuleszB.RogowitzB. E.RogowitzB. E.AI and early vision – Part IIHuman Vision, Visual Proc., and Digital Display, Ser. Proc. SPIE1989Vol. 1077SPIE, Los Angeles, CA246268246–68
22KimuraE.2018Averaging colors of multicolor mosaicsJ. Opt. Soc. Am. A35B43B54B43–5410.1364/JOSAA.35.000B43
23KindermannR.SnellJ. L.Markov Random Fields and their Applications1980American Mathematical SocietyProvidence, RI
24KingdomF. A. A.Interactions of Color Vision with Other Visual Modalities2016SpringerCham219241219–41
25KurikiI.2004Testing the possibility of average-color perception from multi-colored patternsOpt. Rev.11249257249–5710.1007/s10043-004-0249-2
26LandyM. S.WernerJ. S.ChalupaL. M.2014Texture analysis and perceptionThe New Visual Neurosciences639652639–52MIT PressCambridge, MA
27LeeA. B.MumfordD.HuangJ.2001Occlusion models for natural images: A statistical study of a scale-invariant dead leaves modelInt. J. Comput. Vis.41353935–910.1023/A:1011109015675
28LindeY.BuzoA.GrayR. M.1980An algorithm for vector quantizer designIEEE Trans. Commun.COM-28849584–9510.1109/TCOM.1980.1094577
29MaW. Y.DengY.ManjunathB. S.RogowitzB. E.PappasT. N.Tools for texture/color based search of imagesHuman Vision and Electronic Imaging II. Proc. SPIE1997Vol. 3016SPIE, San Jose, CA496507496–507
30ManjunathB. S.MaW. Y.1996Texture features for browsing and retrieval of image dataIEEE Trans. Pattern Anal. Mach. Intell.18837842837–4210.1109/34.531803
31ManjunathB. S.OhmJ.-R.VasudevanV. V.YamadaA.2001Color and texture descriptorsIEEE Trans. Circuits Syst. Video Technol.11703715703–1510.1109/76.927424
32MannosJ. L.SakrisonD. J.1974The effects of a visual fidelity criterion on the encoding of imagesIEEE Trans. Inform. TheoryIT-20525536525–3610.1109/TIT.1974.1055250
33P. Maragos, R. W. Schafer and M. A. Butt (Eds.) Mathematical Morphology and Its Applications to Image and Signal Processing (Springer Science & Business Media, 2012), Vol. 5
34MarlowP. J.KimJ.AndersonB. L.2012The perception and misperception of specular surface reflectanceCurrent Biology22190919131909–1310.1016/j.cub.2012.08.009
35MatheronG.Random Sets and Integral Geometry1975John Wiley and SonsNew York
36MauleJ.FranklinA.2016Accurate rapid averaging of multihue ensembles is due to a limited capacity subsampling mechanismJ. Opt. Soc. Am. A33A22A29A22–910.1364/JOSAA.33.000A22
37MojsilovićA.HuJ.SoljaninE.2002Extraction of perceptually important colors and similarity measurement for image matching, retrieval, and analysisIEEE Trans. Image Process.11123812481238–4810.1109/TIP.2002.804260
38MojsilovićA.KovačevićJ.HuJ.SafranekR. J.GanapathyS. K.2000Matching and retrieval based on the vocabulary and grammar of color patternsIEEE Trans. Image Process.1385438–5410.1109/83.817597
39MotoyoshiI.NishidaS.SharanL.AdelsonE. H.2007Image statistics and the perception of surface qualitiesNature447206209206–910.1038/nature05724
40OjalaT.PietikäinenM.MäenpääT.2002Multiresolution gray-scale and rotation invariant texture classification with local binary patternsIEEE Trans. Pattern Anal. Mach. Intell.24971987971–8710.1109/TPAMI.2002.1017623
41OmerI.WermanM.Color lines: Image specific color representationIEEE Conf. Computer Vision and Pattern Recognition (CVPR)2004IEEEPiscataway, NJ946953946–53
42PadillaS.DrbohlavO.GreenP. R.SpenceA.ChantlerM. J.2008Perceived roughness of 1/f[beta] noise surfacesVis. Res.48179117971791–710.1016/j.visres.2008.05.015
43PappasT. N.1992An adaptive clustering algorithm for image segmentationIEEE Trans. Signal Process.SP-40901914901–1410.1109/78.127962
44PappasT. N.ChenJ.DepalovD.2007Perceptually based techniques for image segmentation and semantic classificationIEEE Commun. Mag.45445144–5110.1109/MCOM.2007.284537
45PappasT. N.NeuhoffD. L.de RidderH.ZujovicJ.2013Image analysis: Focus on texture similarityProc. IEEE101204420572044–5710.1109/JPROC.2013.2262912
46ParvatiK.RaoP.DasM. M.“Image segmentation using gray-scale morphology and marker-controlled watershed transformation,” Discrete Dyn. Nat. Soc. 2008 (2009)
47PinnaB.GrossbergS.2005The watercolor illusion and neon color spreading: a unified analysis of new cases and neural mechanismsJ. Opt. Soc. Am. A22220722212207–2110.1364/JOSAA.22.002207
48PoirsonA. B.WandellB. A.1993Appearance of colored patterns: pattern-color separabilityJ. Opt. Soc. Am. A10245824702458–7010.1364/JOSAA.10.002458
49RubnerY.TomasiC.GuibasL. J.2000The earth mover’s distance as a metric for image retrievalInt. J. Comput. Vis.409912199–12110.1023/A:1026543900054
50SawhneyH. S.HafnerJ. L.Efficient color histogram indexingProc. Int’l. Conf. Image Proc.1994IEEE Computer Society, Washington, DC667066–70
51SilverN. C.DunlapW. P.1987Averaging correlation coefficients: Should Fisher’s z transformation be used?J. Appl. Psychology7214610.1037/0021-9010.72.1.146
52SwainM.BallardD.1991Color indexingInt. J. Computer Vision7113211–3210.1007/BF00130487
53SwitkesE.BradleyA.ValoisK. K. D.1988Contrast dependence and mechanisms of masking interactions among chromatic and luminance gratingsJ. Opt. Soc. Am. A5114911621149–6210.1364/JOSAA.5.001149
54ThurstoneL. L.1927A law of comparative judgmentPsychological Review3427310.1037/h0070288
55TouJ. T.GonzalezR. C.Pattern Recognition Principles1974Addison, Reading, MA
56van DoornA. J.de RidderH.KoenderinkJ. J.RogowitzB. E.PappasT. N.DalyS. J.Pictorial relief for equiluminant imagesHuman Vision and Electronic Imaging X, Ser. Proc. SPIE2005Vol. 5666SPIE, San Jose, CA
57WebsterJ.KayP.WebsterM. A.2014Perceiving the average hue of color arraysJ. Opt. Soc. Am. A31A283A292A283–9210.1364/JOSAA.31.00A283
58WijntjesM. W. A.PontS. C.2010Illusory gloss on Lambertian surfacesJ. Vis.101121–1210.1167/10.9.13
59ZujovicJ.“Perceptual texture similarity metrics,” Ph.D. dissertation (Northwestern University, Evanston, IL, 2011)
60ZujovicJ.PappasT. N.NeuhoffD. L.Structural similarity metrics for texture analysis and retrievalProc. Int’l. Conf. Image Proc.2009IEEEPiscataway, NJ222522282225–8
61ZujovicJ.PappasT. N.NeuhoffD. L.2013Structural texture similarity metrics for image analysis and retrievalIEEE Trans. Image Process.22254525582545–5810.1109/TIP.2013.2251645