Back to articles
Regular Articles
Volume: 1 | Article ID: jpi0117
Image
The Field of View, the Field of Resolution, and the Field of Contrast Sensitivity
  DOI :  10.2352/J.Percept.Imaging.2018.1.1.010505  Published OnlineJanuary 2018
Abstract
Abstract

The Field of View (FoV), the Field of Resolution, and the Field of Contrast Sensitivity describe three progressively more detailed descriptions of human spatial sensitivity at angles relative to fixation. The FoV is the range of visual angles that can be sensed by an eye. The Field of Resolution describes the highest spatial frequency that can be sensed at each angle. The Field of Contrast Sensitivity describes contrast sensitivity at each spatial frequency, at each visual angle. These three concepts can be unified with the aid of the Pyramid of Visibility, a simplified model of contrast sensitivity as a function of spatial frequency, temporal frequency, and luminance or retinal illuminance. This unified model provides simple yet powerful observations about the Field of Contrast Sensitivity. I have fit this model to a number of published measurements of peripheral contrast sensitivity. This allows us to test the validity of the model, and to estimate its parameters. Although the model is a simplification, I believe it provides an invaluable guide in a range of applications in visual technology.

Subject Areas :
Views 188
Downloads 48
 articleview.views 188
 articleview.downloads 48
  Cite this article 

Andrew B. Watson, "The Field of View, the Field of Resolution, and the Field of Contrast Sensitivityin Journal of Perceptual Imaging,  2018,  pp 010505-1 - 010505-11,  https://doi.org/10.2352/J.Percept.Imaging.2018.1.1.010505

 Copy citation
  Copyright statement 
Copyright © Society for Imaging Science and Technology 2018
  Article timeline 
  • received November 2017
  • accepted August 2018
  • PublishedJanuary 2018

Preprint submitted to:
jpi
Journal of Perceptual Imaging
J. Percept. Imaging
J. Percept. Imaging
2575-8144
Society for Imaging Science and Technology
1.
Introduction
The Field of View (FoV) describes the range of visual angles that can be sensed by an eye. But within that range, some angles are sensed better than others. A more complete description would describe how the contrast sensitivity function varies with angle. I call that the Field of Contrast Sensitivity. The spatial frequency at which contrast sensitivity declines to zero is the resolution of the visual system. By way of the Field of Contrast Sensitivity, one can derive the resolution at each angle, which I call the Field of Resolution.
These general ideas can be given mathematical form with the aid of the Pyramid of Visibility (PoV). This is a recent simplified model of contrast sensitivity as a function of spatial frequency, temporal frequency, and luminance or retinal illuminance. From this model, one can derive some simple yet powerful observations about the Field of Contrast Sensitivity.
Finally, I have fit this model to a number of published measurements of peripheral contrast sensitivity. This allows us to test the validity of the model, and to estimate its parameters. Although the model is a simplification, I believe it provides an invaluable guide in a range of applications in visual technology.
1.1
Field of View
The FoV describes the range of angles that can be seen by the human eye. The range that can be seen by one eye while fixating straight ahead (the Fixated Field of View, or FFoV) is bounded by the occluding structures of the head (eye orbit, nose, brow) and by the cessation of photoreceptors at the margins of the retina. The literature suggests this extends for one eye from 62 in to 105 out, and from − 74 down to 62 up1
1
I adopt the shorter and more intuitive terms “in,” “out,” “up,” and “down” in place of the traditional terms “nasal,” “temporal,” superior,” and “inferior.” Further, these terms are referenced to locations in the visual field, and are reversed relative to locations on the retina.
 [14]. Significant individual differences exist in all of these values. The range of angles that can be seen by one eye when eye movements are allowed differs for the FFoV primarily in the downward and temporal directions, since in the upward and nasal directions the brow and nose obstruct. We will not worry over this distinction, since we are concerned only with variations in sensitivity as a function of angle relative to fixation.
2.
Contrast Sensitivity
2.1
Contrast Sensitivity Function
The contrast sensitivity function (CSF) is defined as the inverse of the smallest contrast of a sinusoidal grating that can be detected at each spatial frequency [59]. An example of a grating and the CSF are shown in Figure 1. Note that visual resolution is defined here as the highest spatial frequency that can be seen, when contrast is at its maximum value of 1, and thus sensitivity is also 1, and the log of sensitivity is zero. Resolution defined in this way is also called grating acuity.
In Fig. 1 I plot the CSF in two ways. First, the traditional way on log–log axes, and second as log contrast sensitivity versus linear frequency. I introduce the latter format because it is how I will plot much of the data below. Also, in this format, the model I will adopt yields a linear CSF for mid to high frequencies. Note the labels in the second plot. These refer to linear spatial frequency (F) and log contrast sensitivity (S). I will use these terms and labels elsewhere in this report.
Figure 1.
Left: a sinusoidal luminance grating. Center: a contrast sensitivity function plotted on log–log coordinates. Right: the same function on log–linear coordinates.
2.2
Pyramid of Visibility
Recently we observed that log contrast sensitivity, at moderate photopic luminances, and at high spatial or temporal frequencies, could be approximated by a linear function of spatial frequency, temporal frequency, and adapting luminance [10]. This observation is embodied in the Pyramid of Visibility (PoV) model:
(1)
S=c0+cWW+cFF+cLL,
where S is the log contrast sensitivity, W is the temporal frequency in Hz, F is the spatial frequency in cycle/deg, L is the log of luminance in nits, and c0, cW, cF and cL are constants. The constant c0 is related to overall sensitivity, while cW, cF, and cL determine the rates of change in log sensitivity with temporal frequency, spatial frequency, and luminance. We call this the Pyramid of Visibility because when rendered as a surface in the FWS space, it is a rectangular pyramid. The base of the pyramid, defined by the locus of FW points at which S = 0, encloses the Window of Visibility, the region of all visible spatio-temporal frequencies [11, 12]. The PoV is shown in Figure 2.
Figure 2.
Pyramid of Visibility. The green diamond at the base defines the Window of Visibility. This example is for a mean luminance of 100 nits and parameters derived from data of Robson [7].
In this report we are concerned primarily with static spatial patterns, and the data sets we consider were all collected at fixed adapting luminances. Thus in the remainder of this paper I will fix temporal frequency at zero, and define the sum of constant and luminance term as
(2)
S0=c0+cLL.
In that case the PoV reduces to the simpler expression
(3)
S=S0+cFF.
2.3
Local Contrast Sensitivity
To measure the CSF in a local region of the visual field it is necessary to use small patches of grating. These are often produced as the product of a 2D Gaussian window and a 1D sinusoid (a Gabor function) [13]. The Gabor may either be a constant size in degrees or a constant number of sinusoidal cycles. I call these constant-degree Gabors (CDG) and constant-cycle Gabors (CCG). Examples of CDG and CCG stimuli are shown in Figure 3.
Figure 3.
Gabor functions. The top row shows four CDG with frequencies of 2, 4, 8, and 16 cycles/deg (at a viewing distance of about 28 picture heights). Each Gabor function has a Gaussian standard deviation of 0.5. The bottom row shows the same frequencies as CCG functions, each with a bandwidth of 1 octave.
In general, we would like to use as small a patch as possible, so that the measurement is as local as possible. But as a patch becomes smaller, its bandwidth increases. As we shall see, the rate of change in sensitivity with eccentricity is proportional to frequency. This means that we need to use a small patch for high frequencies, and a large patch for low. Consequently the use of CCG is preferred. CCG also have a fixed logarithmic frequency bandwidth.
Contrast sensitivity functions measured with CDG and CCG are shown in Figure 4. These are data taken from the ModelFest experiment [1416]. The images in Fig. 3 are a subset of the stimuli used to collect these data. Because the CCG targets are in this case always smaller than the corresponding CDG targets, their sensitivities are lower. And this disproportion, in both size (Fig. 3) and sensitivity, increases with spatial frequency.
Figure 4.
CSF measured with constant-degree (Fig. 3A) and constant-cycle (Fig. 3B) Gabor functions [1416]. Mean luminance was 30 nits. Each point is the mean of 16 observers; error bars are standard deviations. The lines are linear fits to the data above 4 cycles/degree.
2.4
Local Pyramid of Visibility
The linear fits in Fig. 4 are estimates of the PoV model to local contrast sensitivity measurements. A linear decline with frequency, consistent with the PoV model, is evident for both constant size and constant-cycle targets. In Table I, I provide the estimated PoV parameters for both of these cases. I omit the value for cW, because for these data W = 0. Note that, for the reasons stated in the previous paragraph, and as shown in Fig. 4, the slope cF is steeper for CCG than for CDG. For the reasons stated above, in the remainder of this report I will focus on CCG CSF data.
Table I.
PoV parameters for luminance and retinal illuminance and for constant degrees and constant cycles conditions. Parameters are derived from ModelFest data. Luminance refers to the luminance of the display, illuminance refers to the retinal illuminance, that is the product of luminance and area of the pupil.
Illuminancec0cFcI
CDG0.915−0.0600.500
CCG0.556−0.0910.500
LuminancecL
CDG1.739−0.0600.391
CCG1.380−0.0910.391
2.5
Local Scale
The parameters estimated above are for one particular local region: the visual center, or point of fixation. How might the PoV model incorporate changes in position in the visual field? One simplified theory of the effect of eccentricity on visual sensitivity is that it changes the spatial scale [17, 18]. In that view, sensitivity to a stimulus should remain constant at all locations if the stimulus is enlarged by the local scale at each location [18]. When contrast sensitivity is measured with CCG targets, that corresponds to a scaling of spatial frequency by the local scale [18]. That idea is incorporated into the PoV model as follows
(4)
S=S0+cFε(R)F,
where η(R) is the local scale at eccentricity R and η(0) = 1. Both human acuity and midget retinal ganglion cell (mRGC) spacing are approximately linear functions of eccentricity [1921]. This encourages us to propose a linear scale function
(5)
ε(R)=1+cRR.
The parameter cR describes the rate of change of scale with degrees of eccentricity. It may be appropriate to consider different values of cR for different meridians, but I simplify here with a single value.
Substituting Eq. (5) into Eq. (4) we have
(6)
S=S0+cF(1+cRR)F
which illustrates that the slope with respect to frequency CF(1 + CRR) will increase linearly with eccentricity, as shown in Figure 5 for several eccentricities. Note that this is for the CCG CSF. I use the parameters shown in the bottom line of Table I.
Figure 5.
PoV CCG CSF at several eccentricities.
Equation (6) also shows that in the PoV sensitivity will decline with eccentricity R with a slope cFcRF. In Figure 6, using the same parameters as in Fig. 5, I show how PoV contrast sensitivity varies with eccentricity for several frequencies.
Figure 6.
PoV CCG CS versus R for several spatial frequencies. Parameters as in Fig. 5.
Finally, we can convert eccentricity R in degrees into cycles of the underlying frequency, λ = RF. Then sensitivity versus eccentricity becomes a bilinear function of frequency and eccentricity in cycles
(7)
S=S0+cFF+cFcRλ
which says that sensitivity should decline with λ at a constant rate cFcR independent of spatial frequency, as shown in Figure 7.
Figure 7.
Sensitivity versus eccentricity in grating cycles λ. Parameters as in Fig. 5.
The PoV model also provides a formula for resolution (grating acuity) F0: the highest frequency that can be seen, at a contrast of 1. I set S = 0 and solve for F
(8)
F0=S0cF(1+cRR).
I define the local spatial scale as the inverse of resolution 1∕F0. It is useful to note that local spatial scale is a linear function of eccentricity R,
(9)
F01=cFS0cFcRS0R.
I plot PoV local resolution and local spatial scale in Figure 8.
Figure 8.
Local resolution and local spatial scale as a function of eccentricity for the PoV model. Parameters are as in Figure 5.
3.
Fitting the FoCS Model to data
Here I consider existing data on contrast sensitivity measured with CCG stimuli, to evaluate the PoV model, and if valid to estimate parameters. Measurements of contrast sensitivity as a function of eccentricity have typically taken one of three formats. The first (data mode 1) is the measurement of the full CSF, for a range of frequencies, at several eccentricities, as in Fig. 5. The second (data mode 2) is the measurement of sensitivity to single frequencies as the stimulus is placed at various eccentricities, as in Fig. 6. The first two methods are essentially different ways of sampling the stimulus space or arranging the data. The third method (data mode 3) is the measurement of local resolution—the highest spatial frequency that can be seen—as a function of eccentricity, as in Fig. 8. One challenge is to put all three types of data sets into a common framework, to allow them to be compared and modeled. The PoV provides that framework. For consistency, in the cases below, I plot the data in the format of Fig. 7. For each of the data sets discussed below, details of methods are provided in the Appendix.
3.1
Robson & Graham (1981)
Robson & Graham [22] measured thresholds for small patches of grating of several spatial frequencies at a number of eccentricities up to 21 in the inferior and superior meridians. I have fit their data with the PoV model and the results are shown in Figure 9. The data generally agree with the PoV though the fit is not perfect, especially at the highest spatial frequency. The estimated parameters are shown in Table II. I include the parameter product cFcR, because as noted above that is the slope of sensitivity versus cycles of eccentricity. The value of cF is little affected by meridian, but the magnitude of cR is greater in superior than in inferior meridian, as expected.
Figure 9.
Fit of PoV to data from Robson and Graham [22]. Left: inferior field, right: superior field.
Table II.
PoV parameter estimates from Robson and Graham (1981).
S0cFcRcFcR
Inf1.82−0.05360.343−0.0184
Sup1.87−0.05140.446−0.0229
Mean1.85−0.05250.393−0.0206
3.2
Watson (1987)
Watson measured contrast sensitivities for 0.25 to 16 cycles/deg at eccentricities of 0 and 3. Considering only frequencies of 1 cycle/deg and above, the fit of the PoV model is shown in Figure 10, and parameters are in Table III.
Figure 10.
Fit of PoV to data from Watson (1987).
Table III.
PoV parameter estimates from Watson (1987).
S0cFcRcFcR
1.94−0.06940.221−0.0154
3.3
Pointer and Hess (1989)
Pointer and Hess [23] measured sensitivity to CCG stimuli versus eccentricity (nasal and temporal, up to 40) at several spatial frequencies. Some of their data are shown in Figure 11, along with the fit of the PoV model. The fit is reasonable. The best fitting parameters are shown in Table IV.
Figure 11.
Fit of PoV to data from Pointer and Hess [23]. Left: nasal field, right: temporal field.
Table IV.
PoV parameter estimates from Pointer and Hess (1989).
S0cFcRcFcR
Nasal2.17−0.08280.174−0.0144
Temporal2.21−0.09030.171−0.0154
Mean2.19−0.08650.172−0.0149
3.4
Arnow & Geisler (1996)
Arnow & Geisler [24] measured CSF at several eccentricities (0–10) for CCG cycle targets. Bandwidth was 0.5 octaves. Mean luminance was 130 nits, viewed with the right eye and natural pupil. Target duration was 200 msec. The tested meridian was not indicated. Results and fitted PoV model are shown in Figure 12. The fits are reasonable. The estimated parameters are shown in Table V for two observers.
Figure 12.
Fit of PoV to data from Arnow & Geisler (1996). Left: observer JS, right: observer AK.
Table V.
PoV parameter estimates from Arnow & Geisler (1996).
S0cFcRcFcR
JS1.77−0.04190.352−0.0148
AK1.79−0.07740.215−0.0166
Mean1.78−0.05970.263−0.0157
3.5
Foley, Varadharajan, Koh & Farias (2007)
The authors measured contrast sensitivities for a Gabor target over horizontal eccentricities of ±5, viewed binocularly with natural pupils. Since only one spatial frequency was used, I can only estimate the product cFcR. Data are plotted in Figure 13, and parameters are given in Table VI.
Figure 13.
Fit of the PoV to data of Foley et al. (2007).
Table VI.
PoV parameter estimates from Foley et al. (2007).
S0cFcR
JMF-left1.84−0.0229
JMF-right1.84−0.0163
KRH-left1.82−0.0192
KTH-right1.80−0.0183
Mean1.82−0.0192
3.6
Baldwin, Meese & Baker (2012)
Baldwin, Meese & Baker [25] measured contrast sensitivity for constant-cycle log Gabor patches (similar to Gabors) from 0.7 to 4 cycles/deg at various eccentricities. Viewing was binocular with natural pupils. Some data from their experiment 3 for three observers at 1, 2, and 4 cycle/deg are shown in Figure 14, along with the fit of the PoV model. Note that they report only normalized sensitivities (relative to R = 0) so the values of S0 should be near to zero. The parameters are shown in Table VII. The values of cF are rather large, but the values of cR are consistent with previous estimates. The product cFcR is much larger than in the other studies. This suggests a more rapid decline with eccentricity at small eccentricities.
Figure 14.
Fit of PoV to data from experiment 3 of Baldwin, Meese & Baker (2012).
Table VII.
PoV parameter estimates from experiment 3 of Baldwin et al. (2012).
S0cFcRcFcR
ASB 0.02−0.1050−0.3330.0350
DHB 0.15−0.1340−0.3090.0414
SAW−0.05−0.1360−0.3570.0484
Mean 0.04−0.1250−0.3330.0416
In their experiments 1 and 2, sensitivity was measured for 4 cycle/deg for four meridians. Since only one frequency was used, I cannot estimate cF, but only the product cFcR. Results are plotted in Figure 15 and the estimates of cFcR are shown in Table VIII.
Figure 15.
Fit of the PoV to experiments 1 and 2 of Baldwin et al. (2012).
Table VIII.
PoV parameter estimates from experiments 1 and 2 of Baldwin et al. (2012).
S0cFcR
Right1.45−0.0382
Up1.39−0.0386
Left1.41−0.0327
Down1.39−0.0375
Mean1.41−0.0367
4.
Summary
In general, the Field of Contrast Sensitivity model fits the ensemble of data quite well. Table IX summarizes all estimated parameters, along with mean values. Note that the parameter S0 is not averaged as its value will depend on conditions such as the luminance of the display, the size of the adapting field, the number of cycles in the stimulus, the duration of the stimulus, as well as other details of method, that varied among these several studies.
The reasons for variation among these studies (bandwidth, range of eccentricities studied, and range of spatial frequencies studied) warrant further study.
The mean values over all studies, observers, and conditions are about cF = −0.079, cR = 0.28. There are many caveats to be made about these estimates, but they may be adopted as draft values.
Table IX.
PoV parameter estimates from several studies.
StudySetS0cFcRcFcR
RobsonInf1.82−0.05360.343−0.0184
Sup1.87−0.05140.446−0.0229
Mean1.85−0.05250.393−0.0206
WatsonMean1.94−0.06940.221−0.0154
PointerNasal2.17−0.08280.174−0.0144
Temporal2.21−0.09030.171−0.0154
Mean2.19−0.08650.172−0.0149
ArnowJS1.77−0.04190.352−0.0148
AK1.79−0.07740.215−0.0166
Mean1.78−0.05970.263−0.0157
FoleyJMF-left1.84−0.0229
JMF-right1.84−0.0163
KRH-left1.82−0.0192
KTH-right1.8−0.0183
Mean1.82−0.0192
Baldwin 1&2Right1.45−0.0382
Up1.39−0.0386
Left1.41−0.0327
Down1.39−0.0375
Mean1.41−0.0367
Baldwin 3ASB−0.1050.333−0.035
DHB−0.1340.309−0.0414
SAW−0.1360.357−0.0484
Mean−0.1250.333−0.0416
Grand mean− 0.0790.28− 0.023
5.
Discussion
The data analyzed above show that the Field of Contrast Sensitivity provides a simple comprehensive description of human spatial sensitivity throughout the visual field. It is of course an approximation, but one that is reasonably accurate over a wide range of conditions. It provides a principled
basis for engineering decisions in imaging systems that are concerned with the complete visual field.
5.1
Size and duration
In this report, we have been little concerned with the parameter S0, primarily because it will vary with the size and duration of the stimulus. These both varied considerably among the studies considered here. However to generate predictions for actual sensitivities of actual targets, it is necessary to fix a value of S0 and to describe how sensitivity will vary with size and duration. Elsewhere we have argued that these dimensions may be accommodated by assuming contrast energy summation, in which case S would increase with cAA + cTT, where A and T are log area and log duration, respectively, and cA = cT = 0.5. We know that for long durations and large spatial extents, summation becomes much less efficient [22, 26], approximating probability summation, in which case cA = cT = 0.25. The transition between these values is a subject for future research.
5.2
Low frequencies
The PoV, and the associated Field of Contrast Sensitivity, describe contrast sensitivity only at mid to high spatial frequencies. We have not yet determined precisely at what low frequency the model ceases to be valid, and this value is likely to vary with adapting luminance and temporal frequency. But in the design of displays and imaging systems it is usually the sensitivities at high spatial frequencies that are critical.
5.3
Relation to mRGC spacing and aliasing
One proposal for the source of the local scale is that it is based on the spacing of the mRGCs, which can be approximated as a linear function of eccentricity [21]. Because the coverage factor of mRGC is approximately 1 [19], this is equivalent to a scale based on mRGC sizes. However, estimates of cR based on mRGC range between 0.44 (temporal visual field) and 0.92 (superior) [21], considerably higher that the values estimated here (0.28). Elsewhere, Wilkinson et al. [27] using monochromatic interference fringes to stimulate the retina with high-contrast sinusoidal gratings, have shown that what they call “veridical perception” (ability to discriminate grating orientation) matches mRGC spacing everywhere in the retina.
In the fovea, the visual optics prevents aliasing that might occur for frequencies above the sampling limit of the mRGC. However in peripheral vision, where the sampling is much coarser, aliasing can occur [28]. Aliasing will make orientation judgements difficult or impossible, but may not inhibit detection. Thus it seems likely that our estimates, based on detection thresholds, reflect some amount of aliasing. This in turn may explain why the mean estimate of cR I obtain (0.28) is lower than the mRGC vales.
5.4
Temporal Sensitivity
Our original description of the PoV included both spatial and temporal sensitivity; in this report I discuss only spatial sensitivity. The manner in which temporal sensitivity varies from fixation to periphery is also of great interest, and a topic that has attracted considerable research [2931]. In a future report I hope to address whether and how those variations can be incorporated into the Field of Contrast Sensitivity.
5.5
Field of Contrast Sensitivity as a Space-Variant Filter
The PoV asserts that the log of contrast sensitivity declines linearly with spatial frequency with some slope (Eq. (4)). The Field of Contrast Sensitivity extends the pyramid to the periphery by asserting that the slope itself grows linearly with eccentricity (Eq. (6)). A linear decline of log sensitivity corresponds to an exponential decline of linear sensitivity. If we assume that the local two-dimensional CSF is radially symmetric (declines at an equal rate at all orientations, that is, no oblique effect), then the normalized two-dimensional CSF can be represented by a one-dimensional exponential function of radial frequency f,
(10)
s(f)=ekf,
where
(11)
k=cF(1+cRR).
The corresponding radially symmetric impulse response is given by the Hankel Transform of the exponential, which is the Lorentzian function
(12)
h(r)=k(k2+4π2r2)32.
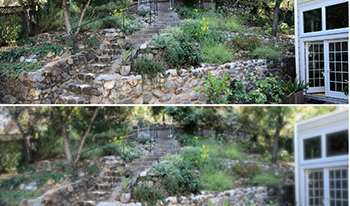
We can implement this as a two-dimensional filter, and apply it in a space-variant manner [32, 33]. In effect the impulse response enlarges linearly with eccentricity according to Eq. (5). An example is shown in Figure 16. Here we have used the default values of cF = −0.079, cR = 0.28. We assume an image resolution of 32 pixels/degree, in which case the image subtends 90 by 28. Vision in the periphery is limited by more than blur, as noted above, but this image illustrates the loss of resolution and contrast imposed by the Field of Contrast Sensitivity.
Figure 16.
An image filtered by the Field of Contrast Sensitivity. I also show the original image for comparison.
6.
Conclusion
Vision is made possible by variations over space and time in the luminance of the retinal image. Consequently human sensitivity to those variations is a fundamental topic in vision science. Equally important is the manner in which that sensitivity varies with adapting luminance, and with position in the visual field. In previous work we showed how visibility as a function of contrast, spatial frequency, temporal frequency, and luminance could be described by the PoV model. In this report we have extended the PoV model into the periphery, by assuming a linear change in local scale with eccentricity. Now with one linear equation we are able to encompass over a century of research. And while the PoV and the Field of Contrast sensitivity are approximations, with acknowledged omissions, they nonetheless provide a powerful description of the bounds on the universe of visible signals.
Appendix
 
The following are some methodological details for the six studies analyzed in this report. Unless stated otherwise, the stimulus was a CCG, viewing was binocular, and time course was Gaussian. Detection thresholds were measured with a 2IFC QUEST staircase [34]. Additional details are provided in Table A1.
Table A1.
Experimental details for the six studies cited in this paper.
StudyMeanFR max maxDurationStandard deviationBandwidth
(nit)(cycle/deg)(deg)(cycles)(ms)(cycles)(octave)
Robson & Graham (1981)5001.5–242032710.44
Watson (1987)1000.25–163481671.130.48
Pointer and Hess (1989)1001.6–12.840961772.260.36
Arnow & Geisler (1996)130 2001.090.5
Foley, Varadharajan, Koh & Farias (2007)110452090 or 24010.55
Baldwin, Meese & Baker (2012)60–850.7–418181000.371.6
Additional Notes
Robson & Graham [22]: The stimulus was not exactly a Gabor; the aperture was a square with raised cosine flanks, but included at least 3 cycles. Frequency was varied by varying viewing distance.
Pointer and Hess (1989): The time course included a cosine modulation at 1 Hz, but with a time Gaussian with standard deviation of 177 ms this is effectively just a narrower Gaussian.
Arnow & Geisler [24]: CCG were in sine phase with respect to the Gaussian envelope. Subjects viewed the display with the right eye and natural pupil. Eccentricity was varied by moving the display with respect to the fixation point, and spatial frequency was varied by a combination of viewing distance and software.
Foley, Varadharajan, Koh & Farias [35] : All data were collected at 4 cycles/deg CCG was in sine phase. Duration was either 90 or 240 ms for two observers.
References
1FrisénL.Clinical Tests of Vision1990Raven PressNew York
2NiederhauserS.MojonD. S.2002Normal isopter position in the peripheral visual field in Goldmann kinetic perimetryOphthalmologica216406408406–810.1159/000067554
3GrobbelJ.DietzschJ.JohnsonC. A.VontheinR.StinglK.WeleberR. G.SchieferU.2016Normal values for the full visual field, corrected for age- and reaction time, using semiautomated kinetic testing on the octopus 900 perimeterTransl. Vis. Sci. Technol.5555–10.1167/tvst.5.2.5
4SimpsonM. J.2017Mini-review: far peripheral visionVis. Res.1409610596–10510.1016/j.visres.2017.08.001
5SelwynE.1948The photographic and visual resolving power of lenses. Part I: visual resolving powerPhot. J.88B
6LowryE. M.DepalmaJ. J.1961Sine-wave response of the visual system. I. The Mach phenomenonJ. Opt. Soc. Am.51740746740–610.1364/JOSA.51.000740
7RobsonJ. G.1966Spatial and temporal contrast sensitivity functions of the visual systemJ. Opt. Soc. Am.56114111421141–210.1364/JOSA.56.001141
8RobsonJ.ShapleyR.LamD. M.-K.Contrast sensitivity: one hundred years of clinical measurementContrast Sensitivity19935MIT PressCambridge, MA253267253–67
9PelliD. G.BexP.2013Measuring contrast sensitivityVision Research90101410–410.1016/j.visres.2013.04.015
10WatsonA. B.AhumadaA. J.The pyramid of visibilityIS&T Electronic Imaging: Human Vision and Electronic Imaging 20162016IS&TSpringfield, VAHVEI-102-1HVEI-102-6HVEI-102-1–6 10.2352/ISSN.2470-1173.2016.16.HVEI-102
11WatsonA. B.Ahumada, Jr.A. J.FarrellJ.1986Window of visibility: psychophysical theory of fidelity in time-sampled visual motion displaysJ. Opt. Soc. Am. A3300307300–710.1364/JOSAA.3.000300
12WatsonA. B.2013High frame rates and human vision: a view through the window of visibilitySMPTE Motion Imaging J.122183218–3210.5594/j18266XY
13WatsonA. B.BarlowH. B.RobsonJ. G.1983What does the eye see best?Nature302419422419–2210.1038/302419a0
14WatsonA. B.2000Visual detection of spatial contrast patterns: evaluation of five simple modelsOpt. Express6123312–3310.1364/OE.6.000012
15CarneyT.TylerC. W.WatsonA. B.MakousW.BeutterB.ChenC.-C.NorciaA. M.KleinS. A.2000Modelfest: year one results and plans for future yearsProc. SPIE3959140151140–51
16WatsonA. B.AhumadaA. J.2005A standard model for foveal detection of spatial contrastJ. Vis.5666–10.1167/5.9.6
17RovamoJ.VirsuV.NasanenR.1978Cortical magnification factor predicts the photopic contrast sensitivity of peripheral visionNature271545654–610.1038/271054a0
18WatsonA. B.1987Estimation of local spatial scaleJ. Opt. Soc. Am. A4157915821579–8210.1364/JOSAA.4.001579
19DaceyD. M.1993The mosaic of midget ganglion cells in the human retinaJ. Neurosci.135334555334–5510.1523/JNEUROSCI.13-12-05334.1993
20StrasburgerH.RentschlerI.JuttnerM.2011Peripheral vision and pattern recognition: a reviewJ. Vis.111821–8210.1167/11.5.13
21WatsonA. B.“A formula for human retinal ganglion cell receptive field density as a function of visual field location”, J. Vis. 14, 1–17 (2014)
22RobsonJ. G.GrahamN.1981Probability summation and regional variation in contrast sensitivity across the visual fieldVis. Res.2140918409–1810.1016/0042-6989(81)90169-3
23PointerJ.HessR.1989The contrast sensitivity gradient across the human visual field: With emphasis on the low spatial frequency rangeVis. Res.29113311511133–5110.1016/0042-6989(89)90061-8
24ArnowT. L.GeislerW. S.1996Visual detection following retinal damage: predictions of an inhomogeneous retino-cortical modelProc. SPIE2674119130119–30
25BaldwinA. S.MeeseT. S.BakerD. H.2012The attenuation surface for contrast sensitivity has the form of a witch’s hat within the central visual fieldJ. Vis.1210.1167/12.11.23
26WatsonA. B.1979Probability summation over timeVis. Res.19515522515–2210.1016/0042-6989(79)90136-6
27WilkinsonM. O.AndersonR. S.BradleyA.ThibosL. N.2016Neural bandwidth of veridical perception across the visual fieldJ. Vis.16110.1167/16.2.1
28ThibosL. N.StillD. L.BradleyA.1996Characterization of spatial aliasing and contrast sensitivity in peripheral visionVis. Res.36249258249–5810.1016/0042-6989(95)00109-D
29KoenderinkJ. J.BoumanM. A.Bueno de MesquitaA. E.SlappendelS.1978Perimetry of contrast detection thresholds of moving spatial sine wave patterns. II. The far peripheral visual field (eccentricity 050)J. Opt. Soc. Am.68850854850–410.1364/JOSA.68.000850
30VirsuV.RovamoJ.LaurinenP.NasanenR.1982Temporal contrast sensitivity and cortical magnificationVis. Res.22121112171211–710.1016/0042-6989(82)90087-6
31TylerC. W.HamerR. D.1990Analysis of visual modulation sensitivity. IV. Validity of the Ferry-Porter lawJ. Opt. Soc. Am. A7743758743–5810.1364/JOSAA.7.000743
32PerryJ. S.GeislerW. S.2002Gaze-contingent real-time simulation of arbitrary visual fieldsProc. SPIE4662576957–69
33WatsonA. B.AhumadaA. J.“Letter identification and the neural image classifier”, J. Vis. 15, 1–26 (2015)
34WatsonA. B.PelliD. G.1983QUEST: a Bayesian adaptive psychometric methodPerception Psychophys.33113120113–2010.3758/BF03202828
35FoleyJ. M.VaradharajanS.KohC. C.FariasM. C.2007Detection of Gabor patterns of different sizes, shapes, phases and eccentricitiesVis. Res.478510785–10710.1016/j.visres.2006.09.005