Back to articles
Regular Articles
Volume: 1 | Article ID: jpi0111
Image
The Role of Structure and Textural Information in Image Utility and Quality Assessment Tasks
  DOI :  10.2352/J.Percept.Imaging.2018.1.1.010501  Published OnlineJanuary 2018
Abstract
Abstract

The perceptual process of images is hierarchical. Human tends to first perceive global structural information such as shapes of objects and further focus on local regional details such as texture. Furthermore, it is widely believed that structure information plays the most important role in task of utility assessment and quality assessment, especially in new scenarios like free-viewpoint television, where the synthesized views contain geometric distortion around objects. We thus hypothesize that the degradation of structural information in an image is more annoying for human observers than the one of the textures in certain application scenarios. In order to confirm our hypothesis, a bilateral filtering based model (BF-M) is proposed referring to a recent subjective perceptual test. In the proposed model, bilateral filters are first utilized to separate structure from the texture information in images. Afterward, features that capture object properties and features that reflect texture information were extracted from the response and the residual of bilateral filtering separately. A contour, a shape related and a texture based estimator are then proposed with the corresponding extracted features. Finally, the model is designed by leveraging the three estimators according to target tasks. With the task-based model, one can then investigate the role of structure/texture information in certain task by checking the correspondence optimized weights assigned to the estimators. In this paper, the hypothesis and the performance of the BF-M is verified on CU-Nantes database as utility estimator and on SynTEX, IRCCyN/IVC-DIBR databases as quality estimator. Experimental results show that (1) structure information does play greater role in several tasks; (2) the performance of the BF-M is comparable to the state-of-the art utility metrics as well as the quality metrics designed for texture synthesis and views synthesis. It is thus validated that the proposed model can also be applied as a task-based parametric image metric.

Subject Areas :
Views 252
Downloads 34
 articleview.views 252
 articleview.downloads 34
  Cite this article 

Suiyi Ling, Patrick Le Callet, Zitong Yu, "The Role of Structure and Textural Information in Image Utility and Quality Assessment Tasksin Journal of Perceptual Imaging,  2018,  pp 010501-1 - 010501-13,  https://doi.org/10.2352/J.Percept.Imaging.2018.1.1.010501

 Copy citation
  Copyright statement 
Copyright © Society for Imaging Science and Technology 2018
  Article timeline 
  • received September 2017
  • accepted May 2018
  • PublishedJanuary 2018

Preprint submitted to:
jpi
Journal of Perceptual Imaging
J. Percept. Imaging
J. Percept. Imaging
2575-8144
Society for Imaging Science and Technology
1.
Introduction
Human visual system (HVS) tends to perceive global structure first and then fine-grained details of an image. The procedure of processing a scene proceeds from top of the hierarchy to the bottom (global to local) [1]. In another word, the global structure of a visual object within a human observer’s effective global span will be comprehended before its local features. It has been pointed out in [1] that the global precedence accelerates several possible advantages including utilization of low-resolution information, economy of processing resources, and disambiguation of indistinct details. Therefore, it is intuitively appealing to assume that structure information (i.e., edges, contours etc.) plays greater role in tasks like utility assessment where the objectiveness is to evaluate the usefulness instead of perceived quality of a distorted natural image. Because if structure information captured by an imaging system is useful, then the degradation will be tolerant as long as the underlying task is performed reliably. Examples of use cases include prevention of terrorist attack, fire control, emergency services and the military use imaging systems in real-time tactical scenarios for immediate decisions making on how best to respond to an incident [24], and so on.
“Visual texture” is usually defined as the portion of an image that is filled with repeated elements and often subject to some randomization in their location, size, orientation, and so on [5]. First, natural texture provides an important source of information of visible surfaces and details [6]. It is thus important for tasks like quality assessment, where texture descriptors were usually utilized as a proxy to quantify blurriness. Second, texture cues in images provide human observers with a potentially rich source of surface and shapes of objects [7]. In the field of quality assessment, distortions on both structure and texture regions affect how human observers judge the quality of an image. For instance, a three-component weighted SSIM (3-SSIM) has been proposed in [8] by assigning different weights to the SSIM scores according to the type of local regions: edge, texture, or smooth area. Recently, as immersive multimedia has developed in leaps and bounds, Free-viewpoint TV (FTV), Virtual Reality (VR), and so on have engaged a great amount of users and become the novel hot topic in the field. Taking FTV as an example, virtual views are commonly generated with Depth-Image-Based Rendering (DIBR) based algorithms. Quality assessment is important for selecting the appropriate view synthesis approach. Different from common images, synthesized views generated based on DIBR algorithms contain artifact mainly around disoccluded regions, including objects shifting, twisted shape of objects, blurriness along edges and even unfilled holes. It can be visually observed that structure related distortion (e.g., geometric distortion) and texture related distortion (e.g., blurriness) affect unequally the process of evaluating the quality of DIBR based synthesized images.
As discussed above, it is obvious that the effect of degradation on structural and texture regions differs with tasks. To the best of our knowledge, there is no related work that explores how different the roles of structure and texture information are playing in different tasks. If one knows which information plays larger or vital role in certain task, the task can be accomplished more accurately and efficiently toward a right direction. In this paper, we hence hypothesize that structure information and texture information play different roles in different tasks within different application scenarios.
To verify our hypothesis, a perceptually inspired BF-M is proposed. In the proposed scheme, a bilateral filter is first adopted to extract the structure and texture information separately based on a subjective study of human material perception in [9], i.e., structural features are extracted from the filter response while the texture features are extracted from the residual of the filter. Then, a “NICE” based edge estimator named bilateral Natural Image Contour Evaluation (BI-NICE), a shape related estimator named bilateral Histogram of Oriented Gradients estimator (BI-HOG) and a texture estimator named bilateral Local Radius Index estimator (BI-LRI) are introduced by calculating the dissimilarity between the original and distorted images with extracted features. Finally, the model is designed by leveraging the weights of the three proposed basic estimators to yield the best performance in different tasks. By doing so, one can determine to what extend the disruption of different information in an image affects the procedure of different tasks. The proposed hypothesis and the performance of the model are verified on CU-Nantes database as utility estimator and on SynTEX, IRCCyN/IVC-DIBR database as quality estimator.
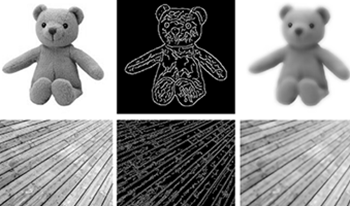
Figure 1 is an example explaining the fundamental idea of the proposed bilateral filtering based model (BF-M): (a) By only observing the edge map of the response of bilateral filtering (the fourth column in Fig. 1), it is obvious that one can recognize the shape of the “teddy bear” easily from the first image (i.e., first row in the fourth column), while it is difficult to tell the second one (i.e., second row in the fourth column) is an image of “wood floor.” (b) For the third image from the IRCCyN-DIBR database, one can observe not only the geometric distortion around objects but also the blurred regions. Obviously, the former disruption is more annoying considering the fake edges and changes of shape around the girl. (c) For the fourth image from the SynTEX database, one can see that the structure of the stones has been emphasized by comparing the edge maps of the original image (i.e., fourth row and second column) and one of the responses of bilateral filtering (i.e., fourth row and fourth column). Unrelated texture of the stones has been removed after bilateral filtering. It is thus more reasonable to extract structure related features from the response instead of the original image. (d) The last two images in Fig. 1 are from CU-Nantes with different quality. The previous one (i.e., the fifth row) is the reference of the other one (i.e., the sixth row). By checking the last column of these two images (i.e., the residual obtained by subtracting the response of the bilateral filter from the original image), one can see that there is more details/texture information maintained in the residual of the reference image. An intuitive assumption on the basis of this observation could be that texture plays more important role in higher quality images in certain tasks.
Figure 1.
Example of separating structure information from texture information. First column: original image; Second column: edge map of the original image; Third column: response of the bilateral filter on the image; Fourth column: edge map of the response of the bilateral filter; Fifth column: residual of bilateral filtering obtained by subtracting the original image with the respond.
The contribution of this paper is two-fold:
(1)
This paper investigates the roles of structure and information in different tasks and presents a model to further explore and verify the weights of them in different tasks. With the proposed model, our hypothesis that structure information is more important in certain tasks has also been validated.
(2)
The proposed model can serve as a task-based parametric image metric for different application scenarios. The performance of which has been tested and proven to be comparable to the state-of-the-art metrics in different tasks.
The remainder of the paper has the following organization. The second section introduces our hypothesis and related theoretical foundations of the proposed model. The third section describes the proposed basic estimators and how those estimators are combined into one according to specific application for the verification of our hypothesis. The experimental results are reported and analyzed in the fourth section. Finally, conclusions and future work are presented in the last section.
2.
Hypothesis and Theoretical Foundation
As discussed in [10], on one hand, structure information in visual scene provides HVS with more semantic information. Continuous edges/contours of an image could clearly reveal the visual objects inside the image, e.g., peoples. Those structural edges are important to the HVS and should be maintained as much as possible in digital image processing and tasks like object detection; On the other hand, the textures of a scene are usually the surface of objects which can also be the material of the targets, such as texture patterns of clothes on people, grass, sea and buildings’ surface. Texture contains details of objects, could thus further augment the objects with more appealing properties, such as fine texture, smooth gray-scale transition and rich color, and make them vivid to human perception. In summary, structure and texture jointly render the users impressive perspective of visual scenes and structural contours provide HVS with most of the semantic information while details are provided by textures. Therefore, we hypothesize that features that focusing on structural properties and feature measuring details play different roles in different applications. To verify this, in the following sub-sections, we first explain the reason why local edge/contour can represent the structure and then further discuss how we separate texture from structure and extract different features separately as followed.
2.1
Local Edges/Contours Reveal Structure
According to [5], the perception of complex visual patterns and objects appears from neural activity as it is transformed through a cascade of areas in the cerebral cortex. Neurons in the primary visual cortex (V1) are selective for local orientation and spatial scale of visual input [1113]. Downstream regions contain neurons selective for more complex attributes, which is approximately achieved by assembling particular combinations of their upstream afferents. Considering the ubiquity of orientation selectivity in primary visual cortex [14], it is intuitive to make the assumption that its computational purpose is to represent the local orientation of edges.
Furthermore, over the past decades, the mainstream view in both the biological and computational vision communities is that later stages of processing should somehow combine these local edge elements to construct more extensive contours, eventually leading to shapes, forms, and objects [15]. Until recently, most researches on object recognition were built around this paradigm, as well as much of the study of mid-level pattern perception, and physiological measurements in areas V2 and V4 of the ventral stream.
It can thus be concluded that local edges and contours, which are local structural information in images, are vital foundation for the following process of higher level semantic structure understanding of images. Edges and contours features are important elements that reveal the structure information of an image. Therefore, in the proposed model, a contour based estimator as well as a histogram of oriented gradient based estimator are designed to quantify the amount of structural change due to disruption. Details of these estimators will be given in the following sections.
2.2
Separating Structure from Texture
Subjective test done in [9] about human material perception provides us with important clues about how to extract structural features and texture features separately. In [9], the subjective experiment is conducted in order to understand which features are useful for the recognition of material categories. In their experiments, images emphasizing local surface information and global structure information were generated separately with bilateral filtering, which is usually used as a non-linear, edge-preserving and noise-reducing smoothing filter for images.
More specifically, Sharan et al. followed the idea of Bae et al. [16] to extract the micro-structure of the surface by smoothing an image with bilateral filtering. Afterward, they utilized the residual image for further texture analysis. The residual image was obtained by subtracting the bilateral filtered results from the gray-scale versions of the original images to emphasize details of surface structure, which is an operation similar to high-pass filtering. In their subjective test, observers were asked to categorize those distorted images into ten material categories. Based on their results, they concluded that texture is the important attribute of material appearance, while information about surface micro-structure is often related to certain categories, i.e., higher level semantics.
Based on their conclusion, in this paper, bilateral filtering is used as a proxy to separate structure and texture information. In the proposed model, structure features related to shape are extracted from the response of bilateral filtering while texture features were extracted from the residual.
3.
The proposed BF-M model for validating the proposed hypothesis
In order to verify the different roles that structure and texture information are playing in different perceptual related tasks, a model on the basis of separating these two pieces of information is proposed and will be introduced in detail in this section. Figure 2 is the overall framework of our proposed model. First and foremost, structure and details related features are extracted separately with bilateral filtering from both the original and the degraded images. More specifically, images are first separated into the base image, i.e., bilateral responses, and the residuals after bilateral filtering [9]. In order to generate the response more efficiently, a faster approximation of bilateral filters [17] is used. The scale σs of the spatial kernel and the range value σr are set differently according to different tasks [18]. Then, structure related features including Histogram of Oriented Gradients estimator (HOG) and the Natural Image Contour Evaluation estimator (NICE) are calculated with the base image, while the texture related feature Local Radius Index (LRI) is extracted from the residual image. With the extracted features set fHOG, fNICE and fLRI from both the reference and degraded images, dissimilarity scores are then calculated. After normalization, the three estimators, BI-NICE, BI-HOG, and BI-LRI are combined with different assigned weights according to different applications. Finally, the roles of different information can be investigated by checking the optimized weights.
Figure 2.
Overall framework of the proposed model based on separating structure and texture information using bilateral filtering.
3.1
Bilateral Filtering Based Contour-Based Image Evaluation Estimator (BI-NICE)
As discussed in the second section that local contours reveal the structure of an image, in this section, a contour based estimator is thus introduced. It has been confirmed that fragments of contours can be used to successfully understand semantics in images [1921], which further showcases the importance of structure information in semantics related tasks. Since contours are important for global structure understanding, the NICE estimator is improved by using bilateral filter to emphasize important structural local elements. First of all, the edge maps are generated only on the responses of bilateral filtering using the Canny edge detector. For the reference and the degraded images, the obtained contour maps are then denoted as CBI and CBI ̂ correspondingly.
Before calculating the distance, to probe and expand the shapes contained in the image, the contour maps are subjected to morphological dilation with a 3 × 3 “plus-sign” shaped structuring element E. In line with the one-scale NICE estimator, the object score was computed by comparing the binary contours map of the reference and the test images. Afterward, the final contour error map is obtained by exerting point-wise exclusive-or (XOR) operation of the dilated binary images, since XOR is the commonly used operation for contours maps comparison. In the end, the overall BI-NICE score for a test image is defined as
(1)
BINICE=dH(CBIE,CBI ̂E)NCBI,
where NCBI is the number of contours elements, dH(X, Y ) denotes the Hamming distance between the X and Y , and CBIE denotes the dilation operation of the contour map CBI with the morphological structuring element E.
3.2
Bilateral Filtering Based Histogram of Oriented Gradients Estimator (BI-HOG)
Considering the fact that HOG [22] is a powerful shape related descriptor used in computer vision and image processing for the purpose of object detection, action recognition and so on, we extract HOG features from each response of bilateral filtering as a higher level structure feature. First, each image is divided into 8 × 8 cells/blocks. After calculating the histogram of each cell, spatial pooling strategy based on visual importance proposed in [20] is utilized to pool the dissimilarity values. This pooling strategy was presented based on the perception study that humans tend to perceive “poor” regions in an image more severely than the “good” ones.
Finally, the shape related estimator named bilateral HOG estimator (BI-HOG) is then defined as
(2)
BIHOG=1|bijBp|bijBpDe(HHOGijR,HHOGijD),
where H-HOGijR and H-HOGijD denote the histograms correspond to the cells at the ith row and jth column of the bilateral response of both the reference and distorted images. Bp is the lowest 60% of cells ranked by the dissimilarity values. De(X, Y ) denotes the euclidean distance between the two vectors X and Y .
3.3
Bilateral Filtering Based Local Radius Index Estimator (BI-LRI)
To represent detail information in images, texture related features are considered in this section. Different from [9], instead of extracting micro-jet and micro-SIFT features, the LRI [23] texture descriptor is extracted in this paper with a size limit of K = 4 and a threshold T equaling to the standard deviation of the image divided by 2. Similar to BI-HOG, LRI texture descriptor is extracted based on 8 × 8 cells/blocks. After extracting the LRI descriptors from the residual of the bilateral filtering from both of the reference and degraded images, the texture based estimator named bilateral LRI estimator (BI-LRI) is then defined as
(3)
BILRI=1|bijBp|bijBpDe(HLRIijR,HLRIijD),
where H-LRIijR and H-LRIijD denote the LRI feature histograms correspond to the cell at the ith row and jth column of the bilateral residual of both the reference and distorted images.
3.4
The Final Bilateral based Model
As discussed in the second section of this paper, different information plays different roles in different application scenarios. Therefore, we combine the three proposed estimators so that the weights of which can be tuned as parameters according to certain applications. The output of each estimator, which is the dissimilarity value calculated based on different features, is normalized to a range of [0,1]. Finally, the proposed BF-M model, which can also be utilized as a tasks-based parametric image metric, is designed as
(4)
BFM=1(αBINICE+βBIHOG+γBILRI)s.t.α+β+γ=1,
where α, β, γ are the aforementioned weights for fine-tuning the roles of the contour, shape, and texture based estimators, respectively and α + β + γ = 1. The configurations of these three estimators are set differently according to the specific task in our experiments and will be further discussed for the purpose of investigating the functionality of different information in images in the following section.
4.
Results and Analysis
To verify the assumption that structure information like edges/contours does not play the same role as detail information like texture in different tasks, the proposed BF-M model described in the previous section is served as an utility estimator on CU-Nantes database [24] and as a quality estimator on both SynTex database [2527] and IRCCyN-DIBR database [28, 29]. With the best-fit weights assigned to BI-NICE, BI-HOG and BI-LRI, the roles of both structure and texture information in the correspondence tasks can be uncovered.
Task descriptions and baselines for utility/quality prediction performance for each use case will be given at the beginning of each following relative sub-sections. Additionally, since the proposed model can also be applied for many tasks by tuning the weights, performance of the metric and related experimental results are also concluded and analyzed in each sub-section. The performance of the model used as task-based parametric metric is evaluated according to Pearson’s Correlation Coefficient (PCC), Spearman Rank Order Correlation Coefficient (SROCC), Kendall Rank Order Correlation Coefficient (KROCC), and the Root Mean Squared Error (RMSE).
4.1
Results: Objective Estimates of Perceived Utility
In utility assessment task, human observers estimate the usefulness of a natural image as a substitute for a reference. In such a task, structure information is important since the main purpose is to quantify the amount of useful information from an image instead of evaluating its quality. For example, as long as the license plate numbers of vehicles are captured by the surveillance camera, the image is useful for tracking them. More interestingly, according to what have been analyzed in [24] based on the results obtained on the CU-Nantes database, there is a linear relationship between perceived quality score and perceived utility score for images with quality scores under 30, while the one is non-linear for those whose quality scores are higher. It was concluded that observers evaluate very low quality images in terms of the ability to interpret the content. About why the relationship between them is non-linear for higher quality images, one possible explanation could be that texture information plays different role in task of utility and quality assessment for higher quality images. Because the higher the quality, the more details will be maintained. Disruption of texture, e.g., blurriness, is annoying for human observers while judging the quality of the image. For example, in Fig. 1, the image in the last row is one degraded image while the one in the second last row is its reference image. It can be observed from the last columns of the two rows (i.e., the residual of the correspondence images) that there are more texture information in the residual of the reference image than the one of the degraded images. For the task of quality assessment of high quality images, details are important but may not be the same case in utility assessment. Therefore, we also hypothesize that the roles of structure and texture information in the task of utility assessment vary with the quality.
To affirm the assumption that (1) structure information plays the main role in this task, (2) the role of texture and structure differs in different quality ranges, the proposed BF-M model is utilized as the utility estimator and is tested on the CU-Nantes database [24]. The CU-Nantes database consists of 9 reference gray-scale images and 235 distorted images. Each image was degraded by one of the five processes including JPEG compression, blocking, JPEG2000 with dynamic contrast-based quantization, texture smoothing (TS) and texture smoothing with high-pass filtering. To further check how the weights of different information vary with quality, one best configuration will be selected for each sub-interval divided according to the perceived quality score, i.e., the mean opinion score (MOS). To confirm the feasibility of using the proposed model as estimator, ReDLOG [30], most apparent distortion (MAD) [31] metric, multi-scale SSIM (MS-SSIM) [32], the visual information fidelity criterion (VIF) [33], the contours based image evaluation (NICE) [2] metric, the multi-scale version of NICE (MS-NICE) and the multi-scale difference of Gaussian utility (MS-DGU) [34] metrics are chosen to be the compared metrics for utility prediction performance evaluation.
In the experiment, since each sample in the database is labeled not only with the utility score but also with the quality score ranging from 1 to 5, we divide the whole range into quarters and optimize one configuration for each sub-range. Table I illustrates the correlation between objective and subjective scores in different quality interval along with the relative weights configuration. As it can be observed from Table I, for images locate in the quality range of [1,3], the proposed model performs the best with a configuration of α = 0.9, β = 0.1, γ = 0, while for higher quality images which locate in the range of [3,5], the model performs better with a higher weight for the texture estimator. Overall speaking, it can be concluded that structure plays a vital role in utility assessment, especially for lower quality images. Furthermore, it is also obvious that texture also plays certain role in evaluating the utility of higher quality images. It has been verified that the role of structure and texture information is different among different quality ranges in utility evaluation task.
Table I.
Results summarizing the performance of the parametric metric with different parameters in different quality ranges.
SROCCQuality Range
α, β, γ[1 , 2][2 , 3][3 , 4][4 , 5]
1 ,0 ,00.6870.7520.6590.661
0.9,0.1,00.6960.7560.7190.854
0.8, 0.1,0.10.6810.7430.7370.831
0.7, 0.1,0.20.6940.7550.7280.888
For performance evaluation, best weights are selected for the three basic estimators for images with different quality according to Table I. The overall performance of the metrics is concluded in Table II. Among the compared metrics, the proposed BF-M performs the best. It is proven that the proposed model is qualified for the task of utility assessment.
Table II.
Results summarizing the performance of various estimators as utility estimator.
SROCCKROCCPCCRMSE
ReDLOG [30]0.77570.58470.757539.89
MAD [31]0.73030.57360.724142.1
MS-SSIM [32]0.85100.67690.83333.8
VIF [33]0.9590.8210.94312.4
NICEcanny [2]0.9370.7850.93513.3
MS-NICE [2]0.9590.8210.91115.4
MS-DGU [34]0.9600.8250.96110.3
BF-M0.9610.8290.96110.2
To better understand why structure related information is more vital in the case of utility assessment, the edge maps and the extracted HOG descriptors are visualized in the second and third rows of Figure 3. In the figure, the first column is the reference image while the other two are the degraded image and the one in the second column has higher utility score than the third one (10.528 > −47.638). By only observing the edges and HOG maps, one can observe that the shapes of the “pumpkin lanterns” on the floor in the first and second columns are recognizable while the ones in the third column are not. It can be thus concluded that, for low quality distorted images, where most of the texture information is lost, structure is the most important information for judging its utility.
Figure 3.
Examples explaining why structure related information plays greater role in the task of utility assessment.
4.2
Results: Objective Estimates of Perceived Quality for Synthesized Texture Images
Texture synthesis is a broadly and commonly used technique for bit-rate saving in image, video compression, in-painting (e.g., used for error concealment or disoccluded regions filling for view synthesis in FTV system) and so on. The purpose of quality assessment for texture synthesized images is to estimate the perceived quality of the synthesized texture referring to the original texture in images. Therefore, the role of texture information is definitely more important than one of the structure information in such case.
In verifying what has been discussed above, we test the proposed BF-M model on the SynTEX Granularity database [2527]. This database contains 21 reference textures and 105 synthesized texture images generated with five different texture synthesis algorithms. For BF-M, relatives parameters of the model are set as described in the previous section to obtain the most correlated objective scores with the MOS. According to [35], CWSSIM [36], WCWSSIM [37], parametric metric that proposed in [38] and STQA [35] are the four most promising metrics on the SynTEX Granularity database for evaluating the quality of synthesized texture. Therefore, the performance of the proposed model used as an estimator of perceived quality for texture synthesized images is tested on the same database and compared to these four methods.
During the experiment, when α = 0.2, β = 0.2, γ = 0.6 the proposed model gets the most consistent objective quality score with the subjective one. Since the weights for the texture estimator (i.e., BI-LRI) account for the greatest proportion, we can then draw the conclusion that texture is more important than structure in the task of quality assessment for texture synthesis. In addition, the overall performance of the model applied as quality estimator for texture synthesized images is concluded in Table III. Although BF-M does not outperform STQA, the performance is still comparable to the others. This result proves the feasibility of using the proposed model as a quality estimator for texture synthesized images.
Table III.
Results summarizing the performance of various estimators as quality estimator for synthesized texture.
SROCCPCCRMSE
WCWSSIM [37]0.4970.5460.170
CWSSIM [36]0.6440.6630.198
Parametric [38]0.4810.4120.253
STQA [35]0.7550.7660.799
BF-M0.7190.7080.162
For further interpreting why texture information is most important for quality assessment of synthesis texture, we visualized the edges, HOG, LRI maps and the error map between the LRI maps of the reference and the synthesis texture images in the second to fourth columns in Figure 4. In the figure, the first row corresponds to the reference image while the second and third rows correspond to synthesis texture images and the second one has higher perceived quality score (4.647 > 1.235). For better observation, when generating the visualized LRI maps, we select a slightly larger block size 16 × 16 and crop only the top left part of the image. In the visualized LRI map, each sub-figure is an LRI histogram representing the texture information of the local block. LRI is a statistical texture feature that considers inter-edge distance distribution along different angles, i.e., eight directions by comparing the current pixel value to the closest edge pixel value along each direction. The magnitude of each bin in the histogram is decided by the pixel number between the current pixel and the closest edge pixel along the direction and the sign of the bin is decided by comparing the two pixels’ value. Therefore, the more saturated the histogram, the smoother the block. By comparing the edges, HOG maps of the synthesis texture images with the ones of the original image, it is almost impossible for human observers to tell the difference between them, let alone asking them to judge which one is better synthesized. On the contrary, the LRI map can provide more clues about the statistical difference between the texture in images. By comparing the error maps calculated using Euclidean distance between the LRI histograms of the original image and the synthesized one, it can be observed that the overall error in the third row is larger than the one in the second row, which is consistent to the perceived quality score (bins in the error map larger than 1.2 are labeled with red color). It can be concluded from this sub-section that texture information is more important when task involves mainly fine-granular texture in the images. Since there is no clear main structure (e.g., boundaries of objects) in these images, details of these images (i.e., the texture) are the dominant factor in the task.
Figure 4.
Examples explaining why texture related information plays greater role in the task of quality assessment for synthesis texture.
4.3
Results: Objective Estimates of Perceived Quality for DIBR based Synthesized Views
Depth-Image-Based-Rendering (DIBR) techniques are indispensable for three-dimensional (3D) video applications including 3D Television (3DTV) and free-viewpoint video. Views that synthesized with DIBR based techniques contain specific distortions like object shifting, incorrect rendering, flickering, blurriness and geometry distortion around disoccluded regions. Since HVS is more sensitive to local severe disruptions than the global consistent ones [39], we hypothesize that structure information plays greater role than texture information during the process of assessing the quality of synthesized views.
Targeting at evaluating the synthesized images’ quality properly, several metrics have been proposed to improve common used metrics. In [40], VSQA was proposed to improve SSIM with three visibility maps which help in characterizing complexity of the images. Federica et al. [41] presented the 3DswIM on the basis of statistical features of wavelet sub-bands. Considering the fact that multi-resolution image quality assessment approaches perform better than the single-resolution ones, Dragana [42] first deployed morphological wavelet decomposition for quality assessment of synthesized images named Morphological Wavelet Peak Signal-to-Noise Ratio metric (MW-PSNR). Later, they devised PSNR with morphological pyramids decomposition (MP-PSNR) instead of morphological wavelet decomposition to obtain better performances [43]. However, none of the aforementioned researches has verified the importance of structure information.
To verify our hypothesis, the proposed model is applied as a quality estimator and is tested on the IRCCyN/IVC-DIBR images database [28, 29]. Images from this database were generated from three multi-view video plus depth sequences including Book Arrival (1024 × 768, 16 cameras with 6.5 cm spacing), Lovebird1 (1024 × 768, 12 cameras with 3.5 cm spacing) and Newspaper (1024 × 768, 9 cameras with 5 cm spacing). Seven DIBR algorithms labelled as A1–A7 [4449] processed the three sequences to generate four new virtual views for each of them. The database is composed of 84 synthesized views and 12 original frames extracted from the corresponding sequence along with subjective score in the form of MOS. The difference mean opinion score (DMOS) is then calculated measuring the subjective difference between the reference and synthesized images. In [42, 43], images synthesized with A1 are excluded from the experiment due to the significant shifting artifacts compared to the others. However, according to the MOS, images synthesized with A1 have better quality compared to the others, and thus are more similar to advanced synthesized algorithms. Since the main purpose of developing a quality metric is to evaluate the performance of synthesis algorithms, the tested database should be in line with the images/videos synthesized with the state-of-the-art synthesis algorithms to follow the trend. Based on the previous discussion, in our experiments, we include the image set generated by A1 and check the performance on the full IRCCyn/IVC DIBR database. As claimed in [42, 43, 50], MP-PSNR MW-PSNR performed the best among the state-of-the-art metrics designed for synthesized views. According to Dragana et al. [50], PSNR is more consistent with human judgment when calculated at higher morphological decomposition scales. They thus proposed a reduced version of the morphological multi-scale measures, which are reduced MP-PSNR, and reduced MW-PSNR correspondingly, by using only detail images from higher decomposition scales. The reduced versions outperform the full ones. Therefore, in this section, we mainly compare our proposed model with MW-PSNRfull, MP-PSNRfull MW-PSNRreduced and MP-PSNRreduced. To obtain the best performance of them, a 5 × 5 size of SE is used for MP-PSNR and a min Haar wavelet decomposition is used for MW-PSNR as reported in [50].
The overall performance of the metrics is concluded in Table IV. In the experiment, by setting α, β, γ to 0.5, 0.2 and 0.3, the performance of the our model peaks. This configuration indicates the fact that both structure and texture information play roles in evaluating the quality of synthesized views, and one of the structures is greater than the other. In another word, artifact that interferes the structure of the view is more annoying for HVS, which verifies our previous assumption. Moreover, according to Table IV, the proposed BF-M achieves 0.6980 value of PCC, which outperforms all of the compared metrics designed for synthesis images. Compared to the second best performing MP-PSNRredeuce our proposed model obtains a gain of 0.0247 in PCC, which verifies its capability of assessing the perceived quality of synthesized views.
Table IV.
Performance comparison of the proposed metric with state-of-the-art metrics for synthesized views.
PCCSROCCRMSE
ReDLOG [30]0.14000.33610.6271
MP-PSNRfull0.65530.62390.5029
MP-PSNRreduced0.67330.660.4923
MW-PSNRfull0.60890.57380.4348
MW-PSNRreduced0.64440.62180.5091
BF-M0.69800.58850.4768
In order to understand how different information loss affects the perceived quality in the scenario of quality evaluation for synthesized views, the edges, HOG and LRI maps of the synthesized image in the third row of Fig. 1 and one of its original images are made visible in Figure 5. By only comparing the edges and HOG map, one can easily notice the geometric distortion around the face of the girl, specially at the right part where the entire regions are blurred. Therefore, it is obvious that structure related information is more important in this task since the deformation of objects’ shapes caused by synthesized algorithms is more eye catchy and can be well captured by structure related descriptors. More interestingly, by comparing the right part of the two LRI maps, one can easily notice the big differences of the histograms in that part. Due to the blurriness introduced by the DIBR algorithms, texture information has been modified, and start become annoying. That is why BI-LRI accounts for 20% in this task.
Figure 5.
Examples explaining why both structure and texture information plays considerable role in the task of quality assessment synthesized views.
4.4
Discussion and Failure Cases
In summary, the optimized configurations of BI-NICE, BI-HOG, and BI-LRI in tasks of utility assessment, quality assessment for synthesized texture and views are concluded in Figure 6. The setting of the weights is selected according to the performance of the proposed model tested on the Cu-Nantes, SynTEX, and IRCCyN-DIBR database correspondingly. According to the optimized setting, two main conclusions can be made:
(1)
Our hypothesis has been verified: It is obvious that structure information does play greater role than texture information in tasks like utility assessment and quality assessment for synthesized views. Nevertheless, in the context of texture synthesis quality assessment, information of details is more important.
(2)
In the task of utility assessment, interesting result can be found: the roles of structure and texture information change as the quality of images varies. The fact that texture starts to play greater important role with increasing quality may also be true in the case of normal image quality assessment and will be verified in the future work.
Figure 6.
Optimized configurations of BI–NICE, BI–HOG, and BI–LRI in tasks of utility assessment, quality assessment for synthesized texture and views.
Figure 7.
Examples of failure cases that BF–M fails to measure.
Although our model manages to quantify the structural/textural errors for certain cases in different tasks, there are still some cases that our model fails to handle. Examples are shown in Fig. 7: (1) For quality assessment of synthesized views, since BI-LRI and BI-HOG are calculated at block level, the global shifting artifact has been over-penalized to some extend. For example, in the fist row of Fig. 7, the three images are the reference, synthesized image and the error map (the darker the color the more errors there are) between them correspondingly. There is an obvious shift of the object but is not noticeable by only checking the synthesized image. It is obvious that this shifting artifact is durable for human observers compared to the severe local geometric distortions, but it is over-penalized by our model. This can be improved by block matching before dissimilarity calculation; (2) For quality assessment of synthesis texture image, our proposed BI-LRI estimator is not rotation invariant enough, meaning that it is not invariant enough for acceptable rotation of textures. For example, in the second row of Fig. 7, where the first column is the original image and the rest are two synthesized texture images with slightly different subjective quality score. The characteristic of this “goldWeave” is that it consists of a set of regular small geometric figures. Slight rotation of the geometric figure does not affect significantly the overall perceived quality, but will be over-penalized by our model. In this paper, the LRI descriptor is chosen mainly for its capability of being easily visualized, which makes it easier for analysis. It can be improved significantly by using more advanced texture descriptor, e.g., code-book based model.
4.5
BF-M with other Features or Measures
As the main goal of this paper is to explore the role of structure and texture information in different tasks, simple structure and texture descriptors, which are easier, clearer for visualization, are selected. However, with more powerful structural and texture relative features or measures, the proposed model has the capability to achieve better performance. In order to check how far BF-M can be improved as well as to verify whether the weights will change with different features, in this sub-section, we take quality assessment of synthesized view as an example and replace the simple descriptors with more complicated ones.
More specifically, the mid-level contour descriptor based measure ST-IQA proposed in [51] (other structure related measures like [52, 53] could be utilized too) is used to replace the structure related estimators BI-NICE and BI-HOG as BI-ST, while the spatial contrast sensitivity (CSF) based texture descriptor proposed in [54] is used to replace the texture related estimator BI-LRI as BI-CSF. Thus, equation (4) can be modified as
(5)
BFMnew=1[(α+β)BIST+γBICSF]s.t.α+β+γ=1,
and the performance of the BF-Mnew is summarized in Table V. The optimized performance of BF-Mnew is obtained while (α + β) is set as 0.8 and γ as 0.2. This best-fit configuration is similar to the optimum configuration of BF-M as described in the previous section. The conclusion that structural information plays the major role in the task of synthesized views’ quality assessment is still solid in this case. As it can be seen from the table, the performance of BF-M is much better than the one of BF-M with more advanced structural/texture estimators. It can be thus concluded that, (1) the weights of structural and texture estimators do not fluctuate with different features/measures; (2) the performance of the proposed model can be improved significantly with more advanced structure/textures measures.
Table V.
Performance of the modified BF-M with more advanced features/measures.
PCCSROCCRMSE
BI-ST0.80130.75560.3983
BI-CSF0.72790.64090.4565
BF-M0.69800.58850.4768
BF-Mnew0.81050.76720.3752
5.
Future Work
In the future, to obtain more robust model, subjective tests will be conducted to generate larger database for parameters training. Furthermore, we will try more powerful structure/texture descriptors by incorporating more perceptual factors and explore more use cases with the proposed model including: (1) Select appropriate patches for patch-based training tasks, e.g., patch-based deep learning. (2) Select appropriate images for material recognition training. (3) Separate image/sequence into texture and contours regions as a pre-process stage for object detection. (4) Select reliable samples of subjective tests from crowd sourcing data. (5) Quality evaluation for higher quality images/videos.
6.
Conclusion
Human observers tend to perceive global structure first then finer granularity details like texture. Based on which, we hypothesize that structure and texture information plays different roles in different tasks considering the characteristics of the tasks. To validate this assumption, a contour, a coarse-grained structure related, and a texture estimator are first introduced using bilateral filtering. A BF-M is then designed to combine the three estimators differently according to different applications. Experiments are conducted on three different databases for different tasks. The optimized configurations of the model serve as a proxy for checking the roles of structure and texture information in those tasks. According to the experimental results, our hypothesis has been verified and the performance of the proposed model applied as a tasks-based parametric metric is proven to be comparable to the state-of-the-art utility/quality metrics. In the future, more use cases will be explored and tested with the proposed model.
References
1NavonD.1977Forest before trees: The precedence of global features in visual perceptionCogn. Psychol.9353383353–8310.1016/0010-0285(77)90012-3
2RouseD. M.HemamiS. S.Natural image utility assessment using image contours16th IEEE Int’l. Conf. on Image Processing (ICIP)2009IEEEPiscataway, NJ221722202217–20
3WangZ.BovikA. C.Modern Image Quality Assessment (Synthesis Lectures on Image, Video, and Multimedia Processing)2006Morgan ClaypoolSan Rafael, CA
4LeszczukM. I.StangeI.FordC.Determining image quality requirements for recognition tasks in generalized public safety video applications: Definitions, testing, standardization, and current trendsIEEE Int’l. Symposium on Broadband Multimedia Systems and Broadcasting (BMSB)2011IEEEPiscataway, NJ151–5
5MovshonJ. A.SimoncelliE. P.Representation of naturalistic image structure in the primate visual cortexCold Spring Harbor Symposia on Quantitative Biology2014Vol. 79Cold Spring HarborNY, USA115122115–22
6AloimonosJ.1988Shape from textureBiol. Cybern.58345360345–6010.1007/BF00363944
7KenderJ. R.Shape from texture: An aggregation transform that maps a class of textures into surface orientationProc. 6th Int’l. Joint Conf. on Artificial Intelligence1979Vol. 1Morgan Kaufmann Publishers Inc.Burlington, MA, USA475480475–80
8LiC.BovikA. C.2009Three-component weighted structural similarity indexProc. SPIE7242191–9
9SharanL.LiuC.RosenholtzR.AdelsonE. H.2013Recognizing materials using perceptually inspired featuresInt. J. Comput. Vis.103348371348–7110.1007/s11263-013-0609-0
10XuL.LinW.MaL.ZhangY.FangY.NganK. N.LiS.YanY.2016Free-energy principle inspired video quality metric and its use in video codingIEEE Trans. Multimedia18590602590–60210.1109/TMM.2016.2525004
11HubelD. H.WieselT. N.1962Receptive fields, binocular interaction and functional architecture in the cat’s visual cortexJ. Physiol.160106154106–5410.1113/jphysiol.1962.sp006837
12HubelD. H.WieselT. N.1968Receptive fields and functional architecture of monkey striate cortexJ. Physiol.195215243215–4310.1113/jphysiol.1968.sp008455
13BrincatS. L.ConnorC. E.2004Underlying principles of visual shape selectivity in posterior inferotemporal cortexNature Neurosci.788010.1038/nn1278
14PriebeN. J.FersterD.2012Mechanisms of neuronal computation in mammalian visual cortexNeuron75194208194–20810.1016/j.neuron.2012.06.011
15RiesenhuberM.PoggioT.1999Hierarchical models of object recognition in cortexNature Neurosci.210.1038/14819
16BaeS.ParisS.DurandF.Two-scale tone management for photographic lookACM Transactions on Graphics (TOG)2006Vol. 25ACMNew York, NY, USA637645637–45
17ParisS.DurandF.2009A fast approximation of the bilateral filter using a signal processing approachInt. J. Comput. Vis.81245224–5210.1007/s11263-007-0110-8
18DurandF.DorseyJ.Fast bilateral filtering for the display of high-dynamic-range imagesACM Transactions on Graphics (TOG)2002Vol. 21ACMNew York, NY, USA257266257–66
19ShottonJ.BlakeA.CipollaR.2008Multiscale categorical object recognition using contour fragmentsIEEE Trans. Pattern Anal. Mach. Intell.30127012811270–8110.1109/TPAMI.2007.70772
20BiedermanI.JuG.1988Surface versus edge-based determinants of visual recognitionCogn. Psychol.20386438–6410.1016/0010-0285(88)90024-2
21WinterJ. D.WagemansJ.2004Contour-based object identification and segmentation: Stimuli, norms and data, and software toolsBehav. Res. Methods Instrum. Comput.36604624604–2410.3758/BF03206541
22DalalN.TriggsB.Histograms of oriented gradients for human detectionIEEE Computer Society Conf. on Computer Vision and Pattern Recognition, 2005. CVPR 20052005Vol. 1IEEEPiscataway, NJ886893886–93
23ZhaiY.NeuhoffD. L.PappasT. N.Local radius index-a new texture similarity featureIEEE Int’l. Conf. on Acoustics, Speech and Signal Processing (ICASSP)2013IEEEPiscataway, NJ143414381434–8
24RouseD. M.PepionR.HemamiS. S.Le CalletP.2009Image utility assessment and a relationship with image quality assessmentProc. SPIE7240724010
25VaradarajanS.KaramL. J.A reduced-reference perceptual quality metric for texture synthesisIEEE Int’l. Conf. on Image Processing (ICIP)2014IEEEPiscataway, NJ531535531–5
26GolestanehS. A.SubedarM. M.KaramL. J.2015The effect of texture granularity on texture synthesis qualityProc. SPIE9599959912
27VaradarajanS.KaramL. J.A no-reference perceptual texture regularity metricIEEE Int’l. Conf. on Acoustics, Speech and Signal Processing (ICASSP)2013IEEEPiscataway, NJ189418981894–8
28BoscE.PepionR.Le CalletP.KoppelM.Ndjiki-NyaP.PressigoutM.MorinL.2011Towards a new quality metric for 3-d synthesized view assessmentIEEE Journal of Selected Topics in Signal Processing5133213431332–43IEEEPiscataway, NJ
29‘Irccyn ivc dibr database website,” http://ftp.ivc.polytech.univnantes.fr/IRCCyN_IVC_DIBR_Images/
30GolestanehS.KaramL. J.2016Reduced-reference quality assessment based on the entropy of dwt coefficients of locally weighted gradient magnitudesIEEE Trans. Image Process.25529353035293–30310.1109/TIP.2016.2601821
31LarsonE. C.ChandlerD. M.2010Most apparent distortion: full-reference image quality assessment and the role of strategyJ. Electronic Imaging1901100610.1117/1.3267105
32WangZ.SimoncelliE. P.BovikA. C.Multiscale structural similarity for image quality assessmentConf. Record of the Thirty-Seventh Asilomar Conf. on Signals, Systems and Computers, 20042003Vol. 2IEEEPiscataway, NJ139814021398–402
33SheikhH. R.BovikA. C.2006Image information and visual qualityIEEE Trans. Image Process.15430444430–4410.1109/TIP.2005.859378
34ScottE. T.HemamiS. S.Image utility estimation using difference-of-gaussian scale spaceIEEE Int’l. Conf. on Image Processing (ICIP)2016IEEEPiscataway, NJ101105101–5
35GolestanehS. A.KaramL. J.Reduced-reference synthesized-texture quality assessment based on multi-scale spatial and statistical texture attributesIEEE Int’l. Conf. on Image Processing (ICIP)2016IEEEPiscataway, NJ378337863783–6
36WangZ.SimoncelliE. P.Translation insensitive image similarity in complex wavelet domainProc. IEEE Int’l. Conf. on Acoustics, Speech, and Signal Processing (ICASSP’05)2005Vol. 2IEEEPiscataway, NJii573ii–573
37BrooksA. C.ZhaoX.PappasT. N.2008Structural similarity quality metrics in a coding context: Exploring the space of realistic distortionsIEEE Trans. Image Process.17126112731261–7310.1109/TIP.2008.926161
38Siddalinga SwamyD.Quality Assessment of Synthesized Textures,” Ph.D. dissertation, (Oklahoma State University, 2011)
39MoorthyA. K.BovikA. C.2009Visual importance pooling for image quality assessmentIEEE J. Sel. Top. Signal Process.3193201193–20110.1109/JSTSP.2009.2015374
40ConzeP. H.2012Objective view synthesis quality assessmentProc. SPIE828853
41BattistiF.BoscE.CarliM.CalletP. L.PerugiaS.2015Objective image quality assessment of 3d synthesized viewsSignal Process, Image Commun.30788878–8810.1016/j.image.2014.10.005
42Sandić-StankovićD.KukoljD.Le CalletP.Dibr synthesized image quality assessment based on morphological waveletsSeventh Int’l. Workshop on Quality of Multimedia Experience (QoMEX)2015IEEEPiscataway, NJ161–6
43Sandic-StankovicD.KukoljD.Le CalletP.Dibr synthesized image quality assessment based on morphological pyramids3DTV-Conf.: The True Vision-Capture, Transmission and Display of 3D Video (3DTV-CON)2015IEEEPiscataway, NJ141–4
44FehnC.2004Depth-image-based rendering (dibr), compression, and transmission for a new approach on 3d-tvProc. SPIE52919310493–104
45TeleaA.2004An image inpainting technique based on the fast marching methodJ. Graphics Tools9233423–3410.1080/10867651.2004.10487596
46MoriY.FukushimaN.YendoT.FujiiT.TanimotoM.2009View generation with 3d warping using depth information for ftvSignal Process. Image Commun.24657265–7210.1016/j.image.2008.10.013
47MuellerK.SmolicA.DixK.MerkleP.KauffP.WiegandT.2009View synthesis for advanced 3d video systemsEURASIP J. Image Video Process.20081111–11
48Ndjiki-NyaP.KoppelM.DoshkovD.LakshmanH.MerkleP.MullerK.WiegandT.2011Depth image-based rendering with advanced texture synthesis for 3-d videoIEEE Trans. Multimedia13453465453–6510.1109/TMM.2011.2128862
49KöppelM.Ndjiki-NyaP.DoshkovD.LakshmanH.MerkleP.MüllerK.WiegandT.Temporally consistent handling of disocclusions with texture synthesis for depth-image-based renderingIEEE 17th Int’l. Conf. on Image Processing2010IEEEPiscataway, NJ180918121809–12
50Sandić-StankovićD.KukoljD.CalletP. L.2016Dibr-synthesized image quality assessment based on morphological multi-scale approachEURASIP J. Image Video Process.2017410.1186/s13640-016-0124-7
51LingS.Le CalletP.Image quality assessment for free viewpoint video based on mid-level contours featureIEEE Int’l. Conf. on Multimedia and Expo (ICME)2017IEEEPiscataway, NJ798479–84
52LingS.Le CalletP.CheungG.Quality assessment for synthesized view based on variable-length context treeIEEE 19th Int’l. Workshop on Multimedia Signal Processing (MMSP)2017IEEEPiscataway, NJ161–6
53LingS.Le CalletP.Image quality assessment for dibr synthesized views using elastic metricProc. ACM on Multimedia Conf.2017ACMNew York, NY, USA115711631157–63
54RaiY.AldahdoohA.LingS.BarkowskyM.Le CalletP.Effect of content features on short-term video quality in the visual peripheryIEEE 18th Int’l. Workshop on Multimedia Signal Processing (MMSP)2016IEEEPiscataway, NJ161–6