Back to articles
Regular Articles
Volume: 1 | Article ID: jpi0110
Image
Color Matching Criteria in Augmented Reality
  DOI :  10.2352/J.Percept.Imaging.2018.1.1.010506  Published OnlineJanuary 2018
Abstract
Abstract

Augmented reality (AR) is growing in popularity, blending virtual objects into the real world, and one challenge it demands is the detailed colorimetric study. This research comprises two parts: a model of the displays in a commercial AR optical see-through head-mounted display (OST-HMD) was made using colorimetric measurements and spatial characterization, followed by a color matching experiment to explore the matching criteria when matching nonuniform colors in AR. The OST-HMD model was constructed by combining a traditional display model with camera-measured spatial luminance maps. Data from the color matching experiment were compared with the spatial model in order to infer the observers’ matching criteria when matching nonuniform patches. The experimental result suggests that the matching criterion is most likely position- or content-guided and measurably different from other possible criteria. The results can be used to improve uniformity in OST-HMDs and as a reference in modeling color appearance in AR.

Subject Areas :
Views 82
Downloads 27
 articleview.views 82
 articleview.downloads 27
  Cite this article 

Lili Zhang, Michael J. Murdoch, "Color Matching Criteria in Augmented Realityin Journal of Perceptual Imaging,  2018,  pp 010506-1 - 010506-8,  https://doi.org/10.2352/J.Percept.Imaging.2018.1.1.010506

 Copy citation
  Copyright statement 
Copyright © Society for Imaging Science and Technology 2018
  Article timeline 
  • received April 2018
  • accepted September 2018
  • PublishedJanuary 2018

Preprint submitted to:
jpi
Journal of Perceptual Imaging
J. Percept. Imaging
J. Percept. Imaging
2575-8144
Society for Imaging Science and Technology
1.
Introduction
Augmented reality (AR) technology supplements the real world with virtual (computer-generated) objects that appear to coexist in the same 3D space as the real world. AR has a wide range of applications [1] including medical visualization [2], education [3], engineering [4], and entertainment [5]. While many implementations are possible, optical see-through head-mounted displays (OST-HMDs) provide an appealing solution for wearable AR devices [6]. Generally, an OST-HMD utilizes an optical combiner to superimpose computer-generated image on the real world [7], coupled with head position tracking, resulting in a see-through display whose content is anchored in real-world coordinates rather than display coordinates. Technology for OST-HMDs is still developing, and it faces difficulties like limited field of view (FOV), inaccurate color reproduction, image position lag or “swimming,” bulky helmet design, etc. Our research addresses just one of these challenges, the accuracy and uniformity of color reproduction, and asks the question: if users are presented with nonuniform color stimuli in AR, what criteria do they use in matching that color to external color stimuli?
The optical combiner of an AR OST-HMD plays a crucial role in color reproduction. Several optical systems have been explored, including elements such as aspherical optics [8], holographic [9] and diffractive optical components [10], and freeform surfaces [11]. Many OST-HMD research prototypes have been demonstrated, but few have matured beyond the lab to become commercial devices with satisfying performance. Microsoft HoloLens, used in this research, is one example of a commercial AR OST-HMD. It has two 16:9 micro-liquid crystal on silicon (LCoS) displays inside the device [12] and a total internal reflective (TIR) waveguide to redirect and project images to the user’s eyes. Light from the LCoS display is coupled in through one diffractive element, propagated inside the waveguide, then coupled out through a second diffractive element toward the eyes to generate images superposed on the real world [13]. The waveguide is essentially a diffraction grating and is sensitive to wavelength, thus there is a separate waveguide layer for each primary [14]. Because the waveguides are transparent, the user can see through them to the real world, and the virtual, displayed content is optically added to the user’s view.
As with any kind of display, measuring and modeling its color reproduction can lead to improvements in performance and the ability to predictably display color. For a typical LCD display, a colorimetric characterization can be performed by measuring the tristimulus values of a set of stimuli including primary colors and a range (or ramp) of neutral colors. Then, a simple additive display model can describe the relationship between arbitrary input values and colorimetric output [15]. Such a model relies on assumptions of additivity, channel independence, temporal stability, and spatial uniformity.
Unfortunately, not all of these assumptions hold for AR OST-HMDs. Most importantly, the virtual images are usually not uniform. Figure 1 (left) shows photos from the user’s perspective of the left and right HoloLens displays displaying R, G, B, and white, showing spatial nonuniformity. The spatial nonuniformity causes two related problems: inaccuracy or ambiguity when modeling the displays’ colorimetric output, and uncertainty about what color stimulus a user is seeing, because the exact color stimulus depends on the position of an instrument or, equivalently, the direction of a user’s eye gaze within the display FOV.
Figure 1.
Left: Photo images of HoloLens primaries and white on left and right lenses (color is approximate). Right: Setup for measuring and photographing HoloLens displays through a reflective mirror (top) and chromaticities of R, G, B primaries from different locations on the display (bottom). The black curve shows the spectrum locus.
The visual effects of nonuniformity have been studied in various media. Previous research showed that texture can affect the total color appearance [16] and chromatic discrimination [17]. Similar problems appeared in other research areas like multi-projector displays [18]. It also affects the result in psychophysical validation depending on where the observer looks on the nonuniform display. Additionally, colors can be perceived differently through different media because of metamerism [19] or incomplete adaptation [20]. However, studies using color matching between virtual and real world provide a reliable method to access color appearance [21]. The AR OST-HMD is even more complex than previous evaluated media due to its transparency and sensitivity to both wavelength and angle. Virtual images anchored in real-world coordinates can be viewed through different parts of the display based on a user’s head position and relative eye gaze direction, and the background will blend with the virtual images as well. Because of the complexities of color in AR OST-HMDs, here we studied color in AR through color matching with spatially nonuniform virtual patches.
The first part of this paper will introduce an approach to characterization of a Microsoft HoloLens AR OST-HMD display and a model describing the display and its spatial variance. The second part will describe a color matching experiment between AR OST-HMD-presented virtual nonuniform color patches and uniform patches presented on a regular LCD display. Finally, using the AR display model to describe the matched colors, three hypotheses will be tested to explore the color matching criteria when matching spatial nonuniform patches in AR.
2.
HMD Characterization
Measurements of the HoloLens were performed to characterize its left and right displays. The primaries’ spectral characteristics and the spectral transmittance of the see-through displays were measured directly with a spectroradiometer. The spatial variance was measured indirectly with a DSLR camera. A model was built to describe the HMD including the spatial variance, binocular fusion, and chromatic adaptation.
2.1
Methods: Display Transmittance and Primaries’ Spatial Variance
The HMD displays were measured by placing a front-surface reflective mirror at 45 inside HoloLens at the eye position and measuring the reflected image from above, as in Fig. 1 (top right). Because the HoloLens is a complete computer rather than simply a display device, displayed content was controlled using the Unity game engine, showing a rendered scene with a diffuse patch of infinite size with defined color and illuminated with directional light at 45 in color (255, 255, 255). The patch was viewed at an angle normal to the Unity main camera. The HoloLens was set to its maximum luminance in all conditions, and measured in a dark room.
Primaries’ spectra were directly measured with PhotoResearch PR655 spectroradiometer at 12 different locations on both left and right displays. Fig. 1 (bottom right) shows the 24 sets of primary chromaticities in uv space where the black line is the spectrum locus. The average chromaticities of R, G, B in uv space are (0.5087, 0.5227), (0.0655, 0.5794), and (0.1850, 0.1046), respectively. Primary chromaticities are relatively stable between different locations, though luminance varies. Primary ramps were measured at one point near the center of the display. The average black level, aka flare, XY Z tristimulus values are (0.1565, 0.1209, 0.2231). Ramps were normalized and interpolated after subtracting flare as in Figure 2 (left). It is shown here that luminance for all channels reaches a peak before maximum digital intensity values.
Figure 2.
Left: Measured and normalized primary ramps in HoloLens: relative luminance versus input code value. Right: Measured transmittance of HoloLens versus wavelength.
The transmittance of the displays was also measured, with the HoloLens turned off. An incandescent light source in an integrating sphere was placed in front of the HoloLens and reflected by the mirror. Spectral radiance was measured with the PR655 at five different locations on both left and right lenses. The same setting was measured again without the HoloLens and transmittance was calculated as shown in Fig. 2 (right), where the left lens is in red and the right lens in green. The transmittance curve is slightly different for the left and right lenses. However, the difference was small, and because no hint of binocular rivalry was observed in any experiments, the average of all curves, drawn in blue, was used as the overall transmittance of HoloLens.
A camera was used as a colorimeter to measure the spatial variance of display primaries with the same mirror setup as above, because it cannot be measured accurately with a spectrophotometer. A Nikon D40 DSLR was set to manual mode with ISO 800, shutter time 1∕6 sec, aperture F32, and focal length 40 mm. These parameters were set so that the shutter time was long enough to cover RGB updating cycles, but the aperture was small enough to avoid overexposure. When the mirror angle was changed, the pattern moved for both left and right lenses. This indicates that the result can only represent one viewing position. Eight photos with the HoloLens showing R, G, B and W were shot through the mirror in a dark room for both left and right displays as shown in Fig. 1 (left). Photos were saved in raw image format for data processing (NEF for Nikon camera).
In order to estimate CIE XY Z for each pixel in the images, a camera characterization was performed. The same camera parameters as above were used to shoot a raw format photo of a Macbeth Colorchecker (MCC) target in a GretagMacbeth Spectralight III light booth under D65 illumination with 0∕45 geometry. CIE 1931 XY Z values were also measured with the same illumination and measurement geometry for all patches. The raw NEF image of the MCC was first converted into DNG format using Adobe DNG Converter with no compression, then read into MATLAB as color filter array (CFA). The original CFA image was then linearized with the compression curve stored in the TIFF file and demosaicked into camera RGB for all pixels with ‘BGGR’ pattern. The parameter ’AsShotNeutral’ stored in TIFF file indicates the signal intensity of each channel for neutrals. Camera RGB was then weighted by the reciprocal of ‘AsShotNeutral’ for each channel so that R = G = B is neutral [22]. For each patch on the MCC, the camera RGB value was taken as the average of the center 100 × 100 pixels. A camera RGB to CIE XY Z matrix M was calculated with pseudoinverse. The estimated XY Z of 24 patches were calculated with matrix M, and both measured and estimated XY Z were converted to Y uv to validate the matrix. The conversion error is 3.0 ± 0.8ΔE.
Images of the HoloLens, left and right lenses displaying R, G, B, and W were processed the same way as above to obtain camera RGB values for each pixel. The 3008 × 2000 images were blurred with a 20 × 20 pixels median filter for each channel separately to avoid discrete camera signal for later sampling. Camera RGB values were then converted into CIE XY Z using the matrix calculated above. From these XY Z images, a 21 × 56 grid with size of 10 × 10 pixels in the display area was built for sampling. The calculated chromaticities of sampled points of HoloLens R, G, B, and W are shown in Figure 3 in comparison to the measured primary average in Y uv space. It is clear from the R, G, B points that the display only varies spatially in luminance while the chromaticities are stable for each primary. We conclude that the chromaticity variation observed in W is due to the composition of the differently nonuniform R, G, B fields. In the next section, the chromaticity and spatial luminance maps were used to build the display model.
Figure 3.
Sampling of primaries and white from images in Y uv chromaticity diagram with relative luminance (colored dots). The spectrally measured primary locations are in circles.
2.2
Results: AR Display Model with Spatial Variance
The AR display model converts one triad of RGB input values to an XY Z image: a set of XY Z tristimulus values with spatial location to represent the spatial variance of the virtual patch based on the measurement described above. The model includes two parts: first, data from the two separate displays were combined into one binocular display, and the relative luminance was mapped to absolute luminance. Second, input RGB values were converted to XY Z tristimulus values using primary ramps and applying appropriate chromatic adaptation. The model is explained here and applied to the color matching experiment in the next section.
The two sets of spatial luminance variance calculated above, of the left and right lenses, were combined into one by averaging and normalizing them to represent binocular vision. The left 10% area of the left display and right 10% of the right display were discarded before merging because they are assumed to be outside of binocular vision. To restore the absolute luminance, the maximum spectroradiometer-measured luminance of each channel characterization section was used as peak luminance to scale the camera-based, normalized luminance map to absolute luminance in cd/m2. The R, G, and B channel spatial luminance maps are shown in Figure 4, along with the spatial luminance of white as the summation of three channels. The G luminance reaches 315.7 cd/m2 while R and B peak at 230.2 cd/m2 and 17.2 cd/m2, respectively.
Figure 4.
Average spatial luminance of three channels and white in binocular vision, with color scales indicating luminance in cd/m2. X and Y axes are the horizontal and vertical dimensions of the lenses.
The model was applied as follows: for each spatial pixel, HoloLens RGB values were converted into normalized XY Z for each channel separately using normalized ramp data as a lookup table and scaled to actual XY Z with the spatial luminance map. Final XY Z values were calculated taking the summation of three channels and then adding the flare and background XY Z. Chromatic adaptation was applied on the tristimulus values of the patches using CIECAT02 model, using parameters selected according to the viewing condition [23]. For the experiment described in the next section, the background luminance surrounding the virtual patches (1.811 cd/m2) was used as the adapting luminance, the white point was (94.95, 100.0, 65.39), and the viewing condition was set to “average.”
3.
Observers’ Color Matching Criteria with Nonuniform Colors
A color matching experiment was carried out between uniform color patches on a regular LCD display and nonuniform colors on the HoloLens OST-HMD. The matched virtual patches were reconstructed with the AR display model above to explore color matching criteria.
3.1
Methods: Color Matching Experiment
A color matching experiment was performed between the HoloLens and a LCD display. The HoloLens was driven by Unity through Holographic Remoting, showing a diffuse patch of 0.3 × 0.3 m illuminated with white directional light at 45. In real-world room coordinates, this virtual patch was positioned at the observers’ eye level at a distance of 2.4 m, just in front of a black board background with luminance at 1.811 cd/m2. A LCD display (Apple Cinema Display Model A1083) was positioned at the same distance height, to the right of virtual patch. The LCD was covered by a black board with 0.3 × 0.3 m square cut out in which to show a reference patch. The virtual patch shown with HoloLens and reference patch shown with LCD were each about 7 of visual angle in size, separated by 17 depending on the initial head position of the observer. Thus, the viewing angle from the left edge of virtual patch to the right edge of reference patch was from about 15 to 21 (Figure 5, left). Observers were free to move their head during the experiment, but thanks to the head position sensing in the HoloLens, the virtual patch remained fixed in space.
Figure 5.
Left: Color matching experimental setup. Virtual patch on the left is displayed by HoloLens in front of a black board as background, and reference patch on the right by LCD. Right: Control flow chart of the color matching experiment. Observers compared patches between LCD and HoloLens. The virtual patch was controlled by MATLAB through Unity. Observer-adjusted HSV values were sent back to MATLAB to update the patch dynamically.
In the experiment, observers were asked to adjust the color of the virtual patch to match the reference, using a keypad to adjust dimensions of hue, saturation, and value (HSV). Selected HSV values were sent to MATLAB and then to Unity through TCP/IP connection to update the color of virtual patch (Fig. 5, right). A total of 27 reference patches (a 3 × 3 × 3 grid in RGB, visible in both Figures 6 and 7) were selected for matching. After the matching experiment, two questions were asked about the experiment: Did you notice the nonuniformity during matching? Is it difficult to match with the nonuniformity? 18 observers with normal color vision participated in the experiment, of whom 12 were male and 6 female. 16 out of 18 observers noticed the spatial nonuniformity of the virtual patch. The other two noticed side-to-side difference or edge strips but not spatial variance. No observers reported that the patch is impossible to match due to the color difference between two displays.
3.2
Results: Reconstructed Matched Virtual Patches
Tristimulus values of all of the LCD-displayed reference patches were measured under the experiment illumination condition from the observer’s eye position using a PR655 and combined with the measured transmittance of HoloLens HMD. CIECAT02 was applied with the reference white patch as the white point and background luminance as adapting luminance as described in section 3.2.
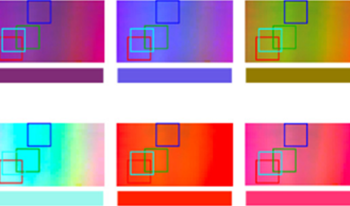
Virtual patches were reconstructed from observers’ matching results: the HSV values were converted to RGB and used as input to the AR display model described above, using the same chromatic adaptation parameters as the reference patches. For every set of input RGB values, the AR display model output a spatial image, essentially a set of colors with spatial coordinates. A General Observer for each patch was created by averaging all observers’ matching result in CIE XY Z space, shown along with the references in the Y uv chromaticity diagrams in Fig. 6. The reconstructed General Observer colors in HoloLens are marked as dots while reference colors are marked as diamonds. Each reference patch diamond is inside or very near the cluster for most patches, and in most cases the reference patch is lower in luminance than the match. The spatial images of the reconstructed virtual patches are shown in Fig. 7, and below each reconstructed image the corresponding reference patch colors are shown as uniform color bars.
Figure 6.
Reference patches and matched scattered colors in HoloLens from average matching result for all 27 patches, with luminance in cd/m2 versus uv chromaticity.
Figure 7.
Reconstructed matched HoloLens patches with spatial variance and reference color bar on the bottom (color is approximate). The boxes and legend definitions are explained in section 3.3.
3.3
Results: AR Color Matching Criteria
Given the visible nonuniformity in the AR OST-HMD, it is unknown what portion of the display observers were using when performing color matches. Our three plausible hypotheses are that observers may be matching the brightest area, most uniform area, or simply the initial location as presented in the side-by-side arrangement in the color matching experiment.
Color difference in CIE Delta-E2000 (ΔE) for each patch was calculated between all spatial sampling points on the reconstructed patch and reference patch. In all patches, there are certain areas whose color difference is much smaller than other areas, suggesting that observers may be using this in their match. To test the plausibility of different matching criteria, a window size of 8 × 8 (in spatial sampling units) was slid over the reconstructed display images to find the position of the minimum ΔE between the reference and the General Observer’s match. The window position was considered minimum only when the summation over all 27 patches was the smallest.
The ΔE values of the brightest area and the most uniform area were calculated in a similar manner by finding the overall brightest or least variance window position, respectively. The position of the initial location window was selected assuming observers kept their head position fixed with an initial forward gaze toward the space between the virtual and reference patches during the experiment, an assumption that seems plausible based on watching the observers’ behavior. The positions of the four computed window positions are drawn on the reconstructed patches in Fig. 7, and the ΔE values of the four windows for all patches are shown in Figure 8. The minimum ΔE in red is overall the smallest, as expected. The ΔE of the initial location window in cyan is generally smaller than the other two windows and close to the minimum ΔE window, meaning the two hypotheses of matching brightest and most uniform area are unlikely to be correct. It is likely that observers simply oriented their heads to look toward the middle in the experiment and held their heads relatively still while making matches. Looking at the four window locations drawn on the reconstructed patches in Fig. 7, it can be seen that the minimum ΔE window location greatly overlaps the initial location window, further supporting the initial location hypothesis.
Figure 8.
Comparison of color difference to reference for four matching windows and observer’s variance on the minimum ΔE window.
Additionally, the observers’ variance in making matches was calculated in the minimum ΔE window with CI of the Poisson distribution [24]. Observer’s average ΔE is significantly larger than General Observer’s ΔE, which is reasonable since the matching result is a cluster around the reference point in 3D space, and the average of the cluster should be closer to the reference than the ΔE from any single matching point. Meanwhile, the observer’s ΔE CI seems stable among different reference colors within the range of ± 1.6ΔE.
To explore how different reference colors affect the matching ΔEs, the relationships between minimum difference window ΔE and chroma and lightness for all 27 patches are shown in Figure 9. Except two blue patches that are out of gamut (marked in triangle), there appears a trend that the more chromatic the patch is, the more accurate the color is matched. The computed linear correlation coefficient between matched chroma and minimum color difference is − 0.5933 with p value of 0.0018. This could be simply because in the AR OST-HMD more chromatic colors are produced using fewer color channels and are thus affected less by the channel spatial variance. Composite neutral colors like white and gray are affected the most, which fits our observations. Lightness of the patches on the other hand does not show a clear relation with correlation coefficient and p value of − 0.0104 and 0.9607, respectively.
Figure 9.
Color difference versus chroma (left) and lightness (right) for all samples. The marker colors represent the approximate reference patch color. Triangles represent patches whose reference colors are outside HoloLens color gamut.
4.
Discussion
4.1
Display Nonuniformity and Compensation
Nonuniformity of near-eye displays is common in both augmented reality (AR) and virtual reality (VR) displays. Attempts have been made to create more uniform near-eye displays, mostly by focusing on better waveguides [25, 26]. In the current case, we are not sure if the nonuniformity originates in the LCoS or the optical waveguide, but the nonuniformity patterns exist only in each RGB channel’s luminance distribution, and they move rigidly with eye location. This suggests that nonuniformity compensation is possible by adjusting the input channel spatial intensity to achieve better uniformity; this may be a more practical solution than optimizing the optical elements for uniformity.
Based on the color matching experiment, though most observers noticed the nonuniformity, no observer reported the matching task was impossible, nor did they have difficulty in fusing two images from the left and right displays. The AR display model showed that the magnitude of spatial variance can be measured and applied to psychophysical results. It may be an interesting question to explore how much spatial variance would be necessary to cause binocular rivalry.
4.2
Background and Content Complexity
The display nonuniformity was first found when performing display measurement, meaning a large area of solid color in a darkened measurement lab. This was not noticed when viewing example holograms in a normal-use environment, so it is reasonable to assume that the noticeability and acceptability of nonuniformity are related to background and content complexity. Considering more common and more complex AR situations, it would be very interesting to quantify the noticeability and acceptability of nonuniformity as they depend on content complexity, including dimensionality, 3D model polygon count, texture maps, and motion, and also how they depend on background complexity in color, texture, and illumination.
4.3
Deviation from Optimal Eye Position
The eye position relative to the display can affect the nonuniformity pattern. For HoloLens, the large eye relief and relatively large eye box offer room for flexible eye position, which also introduces more variance in color appearance. In this research, we only measured and sampled the spatial variance from one viewpoint, while in the psychophysical experiment, observers’ eye locations could have been different. Thus, the observed virtual patches may not completely agree with the modeled patches. An improved future experiment might try to constrain eye position more precisely, but this would be difficult with the commercial HMD. Another possible improvement would be to measure the display from additional eye positions inside the eye box and then model the display with an additional variable of eye position. If the relative eye positions to the HMD could be measured, the model could predict the virtual image accurately and position-dependent compensation strategies could be used.
5.
Conclusion
The color matching criteria on nonuniform AR displays were explored through a color matching experiment with a reference LCD. We performed colorimetric and spatial measurement of the HMD display in order to measure and model its nonuniformity patterns, and computed plausible hypotheses for spatial windows observers may have used for color matching criteria. The results suggest the color matching criterion is most likely position- or content-guided and measurably different from other possible criteria. The average matching color difference in ΔE2000 has a moderate negative correlation with the chroma but no clear relation with lightness.
References
1AzumaR. T.1997A survey of augmented realityPresence: Teleoperators & Virtual Environments6355385355–8510.1162/pres.1997.6.4.355
2BirkfellnerW.FiglM.HuberK.WatzingerF.WanschitzF.HummelJ.HanelR.GreimelW.HomolkaP.EwersR.BergmannH.2002A head-mounted operating binocular for augmented reality visualization in medicine-design and initial evaluationIEEE Trans. Med. Imaging21991997991–710.1109/TMI.2002.803099
3KaufmannH.SchmalstiegD.2003Mathematics and geometry education with collaborative augmented realityComput. Graph.27339345339–4510.1016/S0097-8493(03)00028-1
4MackayW. E.FayardA.-L.FrobertL.MédiniL.Reinventing the familiar: exploring an augmented reality design space for air traffic controlProc. SIGCHI Conf. on Human Factors in Computing Systems1998ACM Press/Addison-Wesley Publishing Co.New York, NY, USA
5PiekarskiW.ThomasB.2002ARQuake: the outdoor augmented reality gaming systemCommun. ACM45363836–810.1145/502269.502291
6RollandJ. P.HuaH.2005Head-mounted display systemsEncyclopedia Opt. Engng1131–13
7ChengD.WangY.HuaH.TalhaM. M.2009Design of an optical see-through head-mounted display with a low f-number and large field of view using a freeform prismAppl. Opt.48265526682655–6810.1364/AO.48.002655
8RollandJ. P.2000Wide-angle, off-axis, see-through head-mounted displayOpt. Eng.39176017681760–810.1117/1.602555
9AndoT.YamasakiK.OkamotoM.ShimizuE.1998Head-mounted display using a holographic optical elementProc. SPIE3293
10MissigM. D.Michael MorrisG.1995Diffractive optics applied to eyepiece designAppl. Opt.34245224612452–6110.1364/AO.34.002452
11YamazakiS.InoguchiK.SaitoY.MorishimaH.TaniguchiN.1999Thin wide-field-of-view HMD with free-form-surface prism and applicationsProc. SPIE3639
12D. Takahashi. “A look inside Microsoft’s HoloLens holographic headset.” Aug 23, 2016 https://venturebeat.com/2016/08/23/a-look-inside-microsofts-hololens-holographic-headset. Accessed 5 Dec 2017
13BakerN.Mixed RealityKeynote presentation at the 28th Hot Chip Conf., Cupertino, CA.2016IEEEPiscataway NJ
14MukawaH.AkutsuK.MatsumuraI.NakanoS.YoshidaT.KuwaharaM.AikiK.2009A full-color eyewear display using planar waveguides with reflection volume hologramsJ. Soc. Inf. Disp.17185193185–9310.1889/JSID17.3.185
15FairchildM.DavidW.“Colorimetric characterization of the apple studio display (flat panel LCD),” Munsell Color Science Laboratory Technical Report, Chester F. Carlson Center for Imaging Science (1998)
16AmookhtS.KandiS. G.MahdavianM.2014Effect of surface texture on color appearance of metallic coatingsProg. Organic Coatings77122112251221–510.1016/j.porgcoat.2014.02.010
17HansenT.GieselM.GegenfurtnerK. R.2008Chromatic discrimination of natural objectsJ. Vis.8222–10.1167/8.1.2
18MajumderA.HeZ.TowlesH.WelchG.Achieving color uniformity across multi-projector displaysProc. Visualization2000IEEEPiscataway, NJ
19OichermanB.LuoM. R.RiggB.RobertsonA. R.2008Effect of observer metamerism on colour matching of display and surface coloursColor Res. Appl.33346359346–5910.1002/col.20429
20HenleyS. A.FairchildM. D.Quantifying mixed adaptation in cross-media color reproductionProc. IS&T/SID CIC8: Eighth Color Imaging Conf.2000IS&TSpringfield, VA305310305–10
21StahreB.BillgerM.Physical measurements versus visual perception: Comparing colour appearance in reality to virtual realityProc. IS&T CGIV2006: 3rd European Conf. on Colour in Graphics, Imaging and Vision2006IS&TSpringfield, VA146151146–51
22Adobe. Digital Negative (DNG) Specification. Version 1.4.0.0, June 2012
23MoroneyN.FairchildM. D.HuntR. W. G.LiC.LuoM. R.NewmanT.The CIECAM02 color appearance modelProc. IS&T/SID CIC10: Tenth Color Imaging Conf.2002IS&TSpringfield, VA232723–7
24PatilV. V.KulkarniH. V.2012Comparison of confidence intervals for the Poisson mean: some new aspectsREVSTAT–Statist. J.10211227211–27
25PiaoMei-LanKimN.2014Achieving high levels of color uniformity and optical efficiency for a wedge-shaped waveguide head-mounted display using a photopolymerAppl. Opt.53218021862180–610.1364/AO.53.002180
26LiuZ.PangY.PanC.HuangZ.2017Design of a uniform-illumination binocular waveguide display with diffraction gratings and freeform opticsOpt. Express25307203073130720–3110.1364/OE.25.030720