Back to articles
Work Presented at CIC33: Color and Imaging Conference 2025 FastTrack
Volume: 0 | Article ID: 050401
Image
The Lower the Bumps, the Higher the Translucency: How Editing Perceived Bumpiness Affects Material Appearance
Abstract
Abstract

A recent work proposed a methodology to effectively enhance or suppress perceived bumpiness in digital images. We hypothesized that this manipulation may affect perceived translucency due to similarity in affected image cues. In this work, we test this hypothesis experimentally. We conducted psychophysical experiments and found a correlation between perceived bumpiness and perceived translucency in processed images. This not only may have implications when digitally editing the bumpiness of a given material but also can be taken advantage of as a translucency editing tool unless the method produces artifacts. To check this, we evaluated the naturalness and quality of the processed images using subjective user study and objective image quality metrics, respectively.

Subject Areas :
Views 0
Downloads 0
 articleview.views 0
 articleview.downloads 0
  Cite this article 

Seyedeh Kimia Arfaie Oghani, Davit Gigilashvili, Mobina Mobini, Midori Tanaka, Takahiko Horiuchi, "The Lower the Bumps, the Higher the Translucency: How Editing Perceived Bumpiness Affects Material Appearancein Journal of Imaging Science and Technology,  2025,  pp 1 - 10,  https://doi.org/10.2352/J.ImagingSci.Technol.2025.69.5.050401

 Copy citation
  Copyright statement 
Copyright © Society for Imaging Science and Technology 2025
 Open access
  Article timeline 
  • received May 2025
  • accepted September 2025
jist
JIMTE6
Journal of Imaging Science and Technology
J. Imaging Sci. Technol.
1062-3701
1943-3522
Society for Imaging Science and Technology
1.
Introduction
Material appearance plays a significant role in our lives—from how we interact and handle objects in a daily routine to customer satisfaction in industry. With the widespread use of digital imaging, it becomes increasingly important to account for complex factors that affect material appearance reproduction, such as color fidelity [1, 2], JPEG compression [3], display subpixel arrays [4, 5], and pixel–aperture ratio [6]. Digitally authoring, editing, and transferring material appearance is an active topic of research [7, 8].
A recent work by Manabe et al. [9] proposed an efficient method to manipulate perceived bumpiness in digital images. Bumpiness is an important attribute of appearance, which is a characteristic of many materials such as wood, leather, orange peel, and plastic. We want to highlight that in this work, we focus on bumpiness as a visual property as perceived by the human visual system (HVS), not as a tactile property. Bumpiness is usually studied as a more general concept of roughness—often used interchangeably.
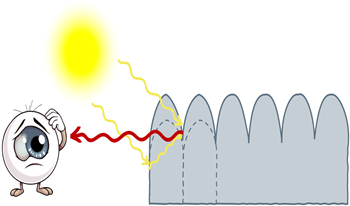
The above-mentioned method of bumpiness enhancement or suppression by Manabe et al. [9] led to sharpening or blurring the image and increasing or decreasing the contrast, respectively. Similar cues are used for translucency perception, which made us hypothesize that the method could affect perceived translucency as well. In photographs, we rarely have access to the ground truth material. Therefore, in this context, translucency perception may be evoked and the object may be considered visually translucent even though it is not optically translucent. The HVS relies on luminance distribution cues in the image to perceive translucency, and the lack of dark shadows below the bumps is often an indication of translucency [1]. For instance, refer to Figure 1—the intensity of the light reaching the human retina from a given point may result from two scenarios: either the bump is low and the light is hitting that area directly; or if the bump is high, the light could have reached that part via subsurface scattering, indicating that the material is translucent. Gigilashvili and Trumpy [10, 11] demonstrated that illusory translucency can be produced in augmented reality if light is projected near convex and concave areas that are usually shadowed in opaque objects.
Figure 1.
The human visual system has limited ability to understand whether the light incident from a given point is directly reflected from the object due to low bumps or is emerging from the subsurface due to the material’s translucency. Hence, when we decrease bumpiness and blur shadows, it may be interpreted as an increase in translucency.
We varied bumpiness with the proposed method [9] and conducted psychophysical experiments to quantify perceived bumpiness and translucency. We further studied how perceived naturalness and image quality were affected to understand to what extent the method can be applied in real-life applications without producing artifacts. If the experimental outcome supported our hypothesis, this could have several important implications: first, it may be hard to edit perceived bumpiness without inadvertently affecting perceived translucency; second, the method developed for editing bumpiness can be used to our advantage in the applications where editing translucency is needed even though this was not the original application of the method; and third, as hypothesized by Nagai et al. [12], differences in translucency perception can be attributed to differences in bumpiness perception, which will provide additional evidence to the role of perceived shape for translucency perception.
It is important to highlight that the objective of this study is not to validate the method by Manabe et al. itself but to use it as a tool for manipulating perceived bumpiness, which has been shown in previous work to be effective. This provides a reliable and controlled basis for our psychophysical experiment to explore the relationship between perceived bumpiness and translucency. Although this work is limited to one particular method for manipulating bumpiness, it serves as a foundational step toward broader generalization.
The manuscript is organized as follows. In Section 2, we overview related work. Afterward, we present the research methodology, followed by the discussion of experimental results. We conclude with limitations and future work.
2.
Related Work
Ho et al. [13] demonstrated failure in perceived roughness constancy of bumpy surfaces—roughness of a given surface was significantly affected by lighting conditions. This was partly attributed to different shadows cast by bumps at different lighting angles—the shadows and, respectively, the roughness being the strongest at lower lighting angles. The idea about the role of shadows to visually identify the multisensory tactile–visual property of surface roughness was discussed as early as in the 18th century by a philosopher Condillac (cited by Ho et al. [13]). Later, Pentland [14] introduced the concept of shape-from-shading—for Lambertian surfaces, high-frequency shape information can be reliably extracted from shading. Norman et al. [15] pointed out the important role of specular highlights in shape perception, and Marlow et al. [16] showed that specular reflections covary and may indicate the bump relief height. Ho et al. [17] conducted conjoint measurement of perceived gloss and surface bumpiness and concluded that physically glossier surfaces appeared bumpier and physically bumpier surfaces appeared glossier.
It is yet to be investigated, exactly what sort of surface variation is responsible for visual roughness and bumpiness [18]. A notable attempt to model it is the work by Padilla et al. [19], where authors tried to correlate physical properties of surface irregularity (roll-off factor and root-mean-square [RMS] height) with perceived roughness. They bandpass-filtered the surface height spectrum and analyzed the signal variance. Not only bumpiness but also many other material properties can be changed by manipulating the image in the frequency domain [20]. Boyadzhiev et al. [21] proposed band sifting—sub-band decomposition of the image and selective modification of the subband coefficients to affect various visual attributes, such as gloss, weathering, and even dryness of the human face.
There is ample evidence in the literature that bumpiness perception and cues affected in bumpiness editing are highly correlated and intertwined with translucency perception. Chowdhury et al. [22] demonstrated that due to lower steepness of the luminance gradient and the lack of shadows, translucent objects appear less bumpy than opaque ones even if the actual 3D shape is identical. Furthermore, Xiao et al. [23] proposed that the sharper the edges, the lower the translucency. Marlow et al. [24] argued that translucency and shape perception are closely related, and the HVS can tell translucent and opaque objects apart based on the covariation between luminance intensity and surface orientation—or the lack thereof. The special role in this process is played by self-occluding contours [25].
Specular highlights play an important role both in perception of shape and perception of translucency [1, 25]. Motoyoshi [26] demonstrated that blurring non-specular components and decreasing luminance contrast between specular and non-specular areas increases translucency. It was further substantiated by Kiyokawa et al. [27] that the relationship between specular highlights and diffuse areas is a strong cue to translucency. They created a model where perceived translucency was explained by the anisoshading ratio—“geometric differences in local shading anisotropy between specular highlights and surrounding non-specular shading.” They blurred the diffuse part while keeping the highlights to produce illusory translucency on an opaque object.
Finally, Nagai et al. [12] recently studied the impact of top-down effects on translucency. They showed diffuse and specular stimuli to two groups of observers in different order. Translucency judgments for those who saw diffuse stimuli first were more affected by the motion and binocular disparity than for those who saw the specular stimuli first. The authors argued that those who saw the specular stimuli identified the shapes more easily and hypothesized that shape perception could be the reason for the discrepancy between the two groups. They argued that future work should study the perceived magnitude of bumpiness and its correlation to perceived translucency. This highlights that our study is timely and addresses an important knowledge gap in the literature.
3.
Methodology
In this section, we discuss bumpiness editing, dataset preparation, and the experimental design.
3.1
Bumpiness Editing Method
In this paper, we adopted the bumpiness modulation technique proposed by Manabe et al. [9], which allows editing bumpiness in digital images by modulating their spatial frequency components.
The authors first conducted a series of analyses and experiments to investigate the factors that influence perceived bumpiness in digital images. They conducted psychophysical experiments in which observers rated the bumpiness of different images. Then, a linear regression model was fitted to analyze the correlation between the image statistics (mean, standard deviation, skewness, kurtosis, contrast) and the perceived bumpiness. They found that basic image statistics are not sufficient to explain bumpiness perception. Therefore, the analysis of bumpiness perception was extended to the frequency domain, as according to previous works [28], the perception of bumpiness is related to the spatial frequency of images. This was confirmed by the authors, as the power spectrum of low, medium, and high bumpiness images showed clear differences in the spatial domain. Next, they filtered images with bandpass filters in different frequency bands (5–25, 25–45, 45–65, 65–85,…, 105–125 cycles per image [CPI]) and obtained multiscale images. For each range of frequency bands, linear regression was used to assess the relationship between image statistics (within each frequency band) and perceived bumpiness. They found that 5–65 CPI had the strongest correlation with perceived bumpiness, so they proposed to modulate the power spectrum of an image in this range to enhance or suppress perceived bumpiness. They also noted that the contrast sensitivity function overlapped with this frequency range, further supporting the idea of using it in their modulation method.
First, the RGB image is converted into YCbCr color space to isolate the Y component. Afterward, Fourier transform is applied to the Y channel, transforming the image into the frequency domain. The power spectrum is then filtered using a bandpass filter to focus on the range of 5–65 CPI in the modulation. The authors propose two different methods to modulate the power spectrum in this range.
3.1.1
Method 1: Uniform Modulation
In this method, the intensity of the power spectrum is uniformly scaled by a factor, denoted by a, to either enhance (a > 1) or suppress (a < 1) bumpiness by amplifying or attenuating the intensity of the power spectrum as shown below:
(1)
L̂(a,f)=aL5f65[CPI]Lotherwise,
where L and L̂ are the intensity of the power spectrum before and after modulation, respectively, and f is the spatial frequency. Then, an inverse Fourier transform is applied to go back to the spatial domain. This inverse transformation gives us the luminance component, which is combined with the chrominance components to get back to RGB.
3.1.2
Method 2: Modulation based on Contrast Sensitivity
Method 2 introduces the concept of contrast sensitivity of the HVS to modulate bumpiness. As the peak of the contrast sensitivity function overlaps with the spatial frequency range that was found to be most important for bumpiness perception (5–65 CPI), an adaptive approach is used, where the power spectrum is modified based on the contrast sensitivity function as shown below:
(2)
L̂(a,f)=W(f)1Wmax1(b1)+15f65[CPI]Lotherwise,
where b is the modulation scale factor in which b > 1 would enhance the bumpiness and b < 1 would suppress it. Moreover, W is the contrast sensitivity function formulated as follows:
(3)
W(f)=(K+afc)ebfK,
where f is the spatial frequency, and a, b, c, and K are constants defining the curve with values 75, 0.2, 0.9, and 46, respectively. Figure 2 illustrates an example of bumpiness modulation with methods 1 and 2. Further details of the implementation can be found in Ref. [9].
Figure 2.
Example of modulation methods 1 (top row) and 2 (bottom row). The respective scales for each method are written below each image. Reproduced from [9].
3.2
Dataset Preparation
To create the dataset for our study, several essential questions had to be answered:
Which modulation method should be used?
Should a frequency band other than 5–65 CPI be explored?
Which scale factor values (a in Eq. (1)) are most appropriate?
Do we need to preserve specular highlights while modulating bumpiness?
Method 1 versus method 2: We inspected the images modulated with both methods and observed that both methods perform relatively the same in suppressing the bumpiness. However, suppression by method 1 is not as effective as method 2 for images with relatively low bumpiness and smooth surfaces. This is consistent with the findings by Manabe et al. [9]. However, this is negligible in this study since we primarily focus on images with moderate to high bumpiness. On the other hand, method 2 is prone to more artifacts while method 1 retains a more natural look. Therefore, we decided to focus on method 1 in this study.
Exploring other frequency bands: In this experiment, the frequency band was extended from 5–65 to 5–150, 5–300, and 5–500 to understand how varying the high-frequency range would affect the modulation process. We observed that adding higher frequencies in bumpiness suppression resulted in subtly smoother textures, which were hardly noticeable even when inspecting the close-up images; on the other hand, it produced more noise and artifacts when enhancing bumpiness. Therefore, the final decision was to continue with the original 5–65 frequency range. This also enables us to compare the results with that of Manabe et al. [9].
Choosing suitable scales: The next important process was to determine the scale factors (parameter a) to suppress/enhance bumpiness. It was important to have levels that produced perceptually different results from one another. We first experimented with the step of 0.25 in the range (0.25–1.75); however, the step size was insufficient to produce substantial perceptual differences for some images. Eventually, after a pilot study, we chose the step of 0.375, and the final scaling factors were 0.25, 0.625, 1 (original), 1.375, and 1.75.
Preserving highlights while modulating bumpiness: By inspection of the images, we concluded that filtering the entire image blurred specular reflections, which may affect the naturalness of the image. Furthermore, as discussed in Section 1, specular reflections may play a crucial role in translucency perception. A smoother surface does not produce identical specular reflections as its bumpy counterpart. Hence preserving highlights from the bumpier surface when bumpiness is suppressed is not physically accurate, but this allowed us to test whether the method could be extended to translucency editing, where specular reflections remain intact and only subsurface scattering changes. Therefore, we decided to include both versions: either filtering the entire image or preserving specular highlights and filtering non-specular components only.
We used a highlight detection technique to isolate the specular highlights. This is done only for those images that have specular reflections. Preserving highlights is achieved by detecting them and creating a binary mask of specular and non-specular regions. This mask helps isolate the areas that need to remain unaffected by the modulation. Then, we integrated the mask into the modulation pipeline to selectively manipulate the images and only modulate the non-specular regions while keeping the specular parts intact. After modulating the non-specular parts, the image is transformed back to the spatial domain, and then the mask is used again to overlay the original specular regions onto the modulated image.
In the following sections, we refer to images modulated with highlights preserved as masked modulated images and those without highlight preservation as non-masked modulated images. Figure 3 is an example of this workflow.
Figure 3.
(a) Original image; (b) its corresponding detected mask; (c) masked (highlight-preserved) bumpiness suppression; (d) non-masked version of the same modulation. Reproduced from the dataset published by Sawayama et al. [29].
It is important to note that the unnatural blurriness only happens in the suppression of bumpiness; the preservation of highlights was also analyzed when bumpiness was amplified. However, when bumpiness is enhanced, the highlights stay the same as the scale factor increases. Therefore, there was no need to preserve the highlights. Thus, masked versions were used only when the scale factor was less than 1.
To detect highlights, we used a machine-learning-based method from the literature [30]. The method utilizes SHDNet, a convolutional neural network, which extracts the features at multiple resolutions through a Feature Pyramid Network and captures both fine details and larger contextual information, enabling it to accurately identify highlights of various sizes and shapes while distinguishing them from other non-specular bright areas.
3.2.1
Dataset
The images used in this study are presented in Figure 4. In total, 19 original 500 × 500 pixel images were used. We wanted to cover different types of images: real photographs, images rendered with traditional computer graphics, and generative AI models. Therefore, we used royalty-free, free-to-use images from Unsplash [3133], computer-generated images from the literature [26, 29], and images generated by us with DALL-E. They cover many material types (glossy, matte, translucent, metallic) and bumpiness levels.
Figure 4.
Original images used in the experiment. Image 9, Michelangelo’s St. Matthew, can be found in Fig. 7(d) of Motoyoshi’s work [26].
Seven images were modulated in five levels of bumpiness (scale factors of 0.25, 0.625, 1, 1.375, 1.75) with 1 being the original image itself while the other twelve, in addition to the five levels, have other two levels of 0.25 and 0.625 with highlights preserved, making the images 119 in total.
3.3
Experimental Design
Three psychophysical experiments were conducted to evaluate bumpiness, naturalness, and translucency of the modulated images. Before each experiment, observers were given instructions including definitions of the evaluated attributes.
Naturalness was defined following the work of Drago et al. [34] in which they referred to it as the “degree to which the image resembled a realistic scene”; this definition was also used by Kadyrova et al. [35] in the natural perception of 2.5D prints, which would be close to the samples we are using. The following definition was given to our observers: “Naturalness refers to how close the image is to a realistic representation of the image, based on your subjective opinion.” Observers were asked to rate the naturalness of each image on a Likert-like scale of 1–5, with 1 being unnatural and 5 being natural. Bumpiness was defined as the “texture and surface irregularities you perceive.” Observers were asked to rate the bumpiness of each image, again on a scale of 1–5, with 1 being very smooth and 5 being very bumpy. Translucency was defined alongside some examples to make the definition clear for observers. The following definition was given: “Translucency occurs between two extremes of complete transparency and complete opacity. The phenomenon happens due to the subsurface scattering of light within the material. Think of materials such as wax, human skin, gummy bear, and etc.” We also made sure that observers understood what more translucent and less translucent mean, more translucent being “further away from opacity.” On a scale of 1–5, 1 was low and 5 was high translucency.
To avoid observer exhaustion, naturalness and bumpiness experiments were conducted in one sitting, taking around 30–40 minutes per observer, and the translucency experiment was carried out in another session, taking around 20 minutes. This design choice also helps to mitigate potential memory effects. On a gray background, 119 images were shown in random order with one-second delay between each. Observers had time to freely observe and rate each image. The distance between the observer and the display was 50 cm. The experiments were hosted on the QuickEval platform [36] and were conducted in a controlled environment; in a dark room and on color-calibrated BenQ SW321C display, with a resolution of 3840 × 2160, calibrated to sRGB with a gamma value of 2.2, brightness of 80 cd/m2, and white point D65. Sixteen observers, eight female and eight male, with an average age of 24.93 years, participated in the experiment. All of them had normal or corrected-to-normal visual acuity and normal color vision.
3.4
Image Quality
Finally, to evaluate how bumpiness editing affects the quality of the images, we analyzed the images with objective image quality metrics. To this end, we chose 12 quality metrics that include both full-reference and no-reference metrics, with some metrics measuring quality in the spatial domain and some in the frequency domain. The metrics are Mean Squared Error (MSE) [37], Structural Similarity (SSIM) [38], Multiscale Structural Similarity (MS-SSIM) [39], Feature SIMiliarity Index (FSIM) [40], Local Entropy Difference (EntropyDiff) [41], Haar wavelet-based Perceptual Similarity Index (HaarPSI) [42], Multiscale Gradient Wavelet (MSGW) [43], image blur metric [44], Cumulative Probability of Blur Detection (CPBD) [45], Blind/Referenceless Image Spatial Quality Evaluator (BRISQUE) [46], Natural Image Quality Evaluator (NIQE) [47], and Perception-based Image Quality Evaluator (PIQE) [48].
4.
Results and Discussion
We first present the results of each of the three experiments, followed by the image quality analysis.
4.1
Inter-observer Agreement
First, we evaluated agreement among 16 observers. For this, we calculated two common metrics: Fleiss’s kappa [49] and Kendall’s coefficient of concordance W [50]. The former ranges from − 1 to 1 while the latter ranges from 0 to 1, where 1 corresponds to perfect agreement in both cases. Fleiss’s kappa was 0.08, 0.14, and 0.19 (0.05 significance level; p < 0.01) for naturalness, bumpiness, and translucency experiments, respectively, indicating slight agreement. Kendall’s W was 0.36 for naturalness, 0.55 for bumpiness, and 0.67 for translucency (0.01 significance level; p < 0.01), indicating fair, moderate, and good agreement among observers, respectively. Both metrics showed that translucency was rated most consistently while naturalness varied most among observers.
4.2
Impact of Bumpiness Scale Factor on Perceptual Attributes
Figures 5 and 6 illustrate the results that show that the method has been successful in editing bumpiness as well as translucency while some artifacts impacting image quality might be noticeable. Figure 7 presents the results of the three psychophysical experiments. The mean opinion score (MOS) given by observers is calculated across all images with a given bumpiness scale factor a. The figure illustrates MOS as a function of a. It is worth mentioning that when suppressing bumpiness (a < 1), we had two separate scores for the majority of the images—for the two versions with and without preserving specular highlights, respectively. The results for bumpiness and naturalness are largely consistent with those reported by Manabe et al. [9]. Bumpiness increases as the scale factor increases, which demonstrates that the method can effectively suppress or enhance bumpiness, and the results reported by Manabe et al. could be successfully reproduced on the same images used in the original study as well as replicated on a completely different set of images.
Figure 5.
Editing results for images where masked version was not used. From left to right, a equals 0.25, 0.625, 1 (original), 1.375, and 1.75, respectively.
Figure 6.
Editing results with and without highlight preservation [29]. The number corresponds to the value of a.
Figure 7.
Mean opinion score (MOS) as a function of bumpiness scale factor a. The scores are averaged across 16 observers and all images with the same a. Red and blue markers signify versions with and without highlight preservation, respectively. Whiskers correspond to 95% confidence intervals. Naturalness is highest for the original. Near-linear relationship is apparent for bumpiness and translucency.
As for naturalness, it is the highest for the original, unprocessed images, which is similar to the results by Manabe et al. However, unlike the previous work, we observed asymmetry in the magnitude of naturalness changes—naturalness drops more when bumpiness is suppressed rather than when enhanced. This can be explained by two factors: first, the difference in processed images, since the effects can be context-dependent, as also acknowledged by Manabe et al. [9]; second, we used a different range of scale factors—covering more extreme values of 0.25 and 1.75 that were not included by Manabe et al., which makes the result hard to compare directly.
The magnitude of possible bumpiness manipulation seems to be content-dependent. For instance, in Figure 8, we see that for Image A with opaque material and a higher initial value of perceived bumpiness, bumpiness can be enhanced as well as suppressed successfully while for Image B with translucent material and low perceived bumpiness, little room remains to further suppress its bumpiness. Generally, translucent material makes it hard to suppress perceived bumpiness.
Figure 8.
The effectiveness of bumpiness editing is content-dependent. Opaque and highly bumpy objects leave more room for bumpiness manipulation, unlike highly translucent materials. Images from [29].
The overlap between 95% confidence intervals for masked and unmasked images indicates that highlight preservation has no significant impact on naturalness and bumpiness. Both values were slightly higher for highlight-preserved images when extreme suppression (a = 0.25) was applied.
Overall, the observers have rated images relatively low in naturalness. This can be explained by the high number of synthetic images in the dataset. As many observers had prior experience with computer graphics, it may have been hard for them to associate the images with real textures found in nature. For instance, the images 18 and 19 in Fig. 4 had a naturalness rating of around 2.5 even for the originals while it was 4 for a photograph shown as image 3 in the same figure.
The plot shows a clear trend for translucency—the lower the bumpiness scale factor, the higher the perceived translucency. Furthermore, as hypothesized, the magnitude of translucency is significantly higher when specular highlights are preserved. Highlight preservation seems to be substantial for translucency. This is consistent with the state-of-the-art knowledge on image cues for translucency perception [1]. The method introduces darker shadows and higher contrast, which leads to low perceived translucency scores when enhancing bumpiness. Moreover, when the scale factor is decreased (suppressing bumpiness), images get blurrier with lower contrast, which is a strong cue to translucency, leading to higher perceived translucency scores.
4.3
Correlation between Perceived Bumpiness and Translucency
Figure 7 indicates that the bumpiness scale factor has a strong positive and negative correlation with perceived bumpiness and perceived translucency, respectively. We calculated Pearson’s Linear Correlation Coefficient (PLCC) between the pairs of perceived bumpiness and translucency values for each image included in the dataset and found a strong negative correlation of − 0.88. Figure 9 further supports our hypothesis that there is a negative linear correlation between the two parameters (R2 = 0.77 for the linear model).
Figure 9.
Perceived translucency as a function of perceived bumpiness. Each data point corresponds to each of the 119 images. The dotted line is the curve of the best linear fit.
4.4
Image Quality
To study the relation between the MOS and the mentioned objective image quality metrics, we computed the Spearman Rank Order Correlation Coefficient (SROCC), a popular measure of studying correlation in image quality. Table I shows the SROCC values of the metrics for each image attribute. The results show that most of the full-reference metrics can capture the naturalness of the images (SROCC higher than 50%) while they struggle to predict bumpiness and translucency. The highest SROCC among all the metrics for all of the attributes belongs to MSGW, a full-reference image quality metric, because this metric measures the image gradient differences, which are in relation to the blurring of the produced images. For full-reference image quality metrics, the reference is the image with a scale factor of 1—usually, the larger the deviation of the applied scale factor from 1, the lower the image quality (i.e., similarity to the reference). This was anticipated, and the full-reference image quality metrics could potentially be utilized to estimate the magnitude of applied bumpiness editing wherever the ground truth value of a scale factor or another editing parameter used in the process is not disclosed. The analysis of the CPBD metric scores shows a very varied range of scores from 0.099 to 0.879 (with a standard deviation of 0.195), which shows the sensitivity of this no-reference metric to the content of images.
Table I.
The SROCC values of image quality metrics for the measured perceptual attributes. The full-reference metrics are marked in blue and the no-reference metrics in yellow.
Moreover, we calculated the correlations in terms of PLCC, the Kendall Rank Order Correlation Coefficient, and RMS error values across all metrics for all the measured attributes. The results of these measures are aligned with what we notice in SROCC’s results. It is more interesting to analyze the results of no-reference image quality metrics and check whether the original is the one with the highest quality (which was indeed the case for full-reference metrics).
Figure 10 shows the scores of the NIQE no-reference metric for masked and non-masked images separated by scale factors. The colors show the different scale factors, and the images highlight preservation differentiation. We chose NIQE to present the results since this metric measures predictable statistical patterns of image patches and their Mahalanobis distance from high-quality images. In NIQE, a smaller score indicates a higher image quality. The scores of the different scale factors as they increase indicate a non-linear relationship. The differences between the scores of the same scale factor show the role that the content of images plays in their quality. This quality score difference is also repeated for the other quality metrics we studied.
Figure 10.
The NIQE scores for all the images across different scale factors. Blue, red, yellow, purple, green, cyan, and maroon bars correspond to masked 0.25, masked 0.625, 0.25, 0.625, 1, 1.375, and 1.75 scale factors, respectively. Lower score means higher quality. Scale factor 0.25 often produces the lowest quality while the others do not substantially differ from the original. However, the trend varies from image to image and illustrates the content-dependent nature of filtering’s impact on image quality.
The originals of AI-generated images (8, 10, and 11 in Fig. 4) have lower quality than photographs (1–3). Image 1 with a smoother luminance gradient has overall high quality, but the original is not always the one with the best quality as for this image, whose quality further improves by suppressing bumpiness. On the other hand, when the original contains noise and high contrast black-and-white patterns (4 and 8), its quality can degrade further when suppressing bumpiness (i.e., decreasing sharpness and retaining substantial noise). For some chromatic images (e.g., image 7), the original may have high quality, but bumpiness suppression may produce unnatural chromatic artifacts and degrade its quality. The pattern varies among images, but the data is not sufficient to identify generalizable content-dependence trends from 19 images. Content dependence needs a rigorous, independent experiment in the future.
5.
Conclusion
The image cues responsible for perceiving translucency and surface bumpiness bear substantial similarities. Therefore, we hypothesized that a recent image processing method proposed for enhancing or suppressing perceived bumpiness in digital images should have affected perceived translucency of the materials. For this purpose, we created a diverse dataset of images with different types of materials, natural and synthetic textures, and conducted psychophysical experiments to scale perceived bumpiness and translucency. The results provided strong evidence in support of our hypothesis, indicating a strong negative linear correlation between the two attributes. Furthermore, we found that the impact on translucency is stronger when keeping specular highlights intact, which is consistent with the existing literature. We need to account for this factor when the objective is to edit bumpiness without affecting material appearance. On the other hand, the methodology can be used alone for editing perceived translucency in digital images. However, subjective and objective evaluations conducted by us have shown that the method may affect perceived naturalness and image quality.
The study comes with several limitations: first, even though we tried to cover a broad range of textures and materials, we observed that the effects are content-dependent, so generalization of the findings should be made with care; besides, the majority of the observers had background in color imaging or computer graphics, which may have affected their judgments in comparison to naïve observers.
Our current findings reveal a perceptual trend that is likely not limited to one particular editing method. However, future work should explore other methods for bumpiness editing, including rendering with 3D normal maps. The future work should also focus on creating a larger and more diverse dataset, incorporating a broader range of material types. It is important to further investigate content dependence on results—both in terms of objective optical properties of the depicted material and geometric resolution of edited bumps as well as the role of high-level semantic associations. Finally, the correlation of bumpiness and translucency with other visual attributes, such as gloss and color, as well as the relationship between subjective naturalness and objective image quality metrics also merits further study.
Acknowledgment
M.M. is supported by the Research Council of Norway through the “Quality and Content” project (grant number 324663).
References
1GigilashviliD.ThomasJ.-B.HardebergJ. Y.PedersenM.2021Translucency perception: a reviewJ. Vis.211411–4110.1167/jov.21.8.4
2LiaoC.SawayamaM.XiaoB.2022Crystal or jelly? effect of color on the perception of translucent materials with photographs of real-world objectsJ. Vis.221231–23
3TanakaM.TakanashiT.HoriuchiT.2020Glossiness-aware image coding in JPEG frameworkProc. IS&T CIC28: Twenty-Eighth Color and Imaging Conf.28708470–84IS&TSpringfield, VA10.2352/J.ImagingSci.Technol.2020.64.5.050409
4AketagawaK.TanakaM.HoriuchiT.2024Influence of display sub-pixel arrays on roughness appearanceJ. Imaging Sci. Technol.6810.2352/J.ImagingSci.Technol.2024.68.6.060404
5TanakaM.AketagawaK.HoriuchiT.2024Impact of display sub-pixel arrays on perceived gloss and transparencyJ. Imaging1022110.3390/jimaging10090221
6AketagawaK.TanakaM.HoriuchiT.2025Impact of display pixel–aperture ratio on perceived roughness, glossiness, and transparencyJ. Imaging1111810.3390/jimaging11040118
7Jimenez-NavarroS.Guerrero-ViuJ.Masiaand B.“A controllable appearance representation for flexible transfer and editing,” Preprint, arXiv:2504.15028 (2025)
8TanakaM.AraiR.HoriuchiT.2017PuRet: Material appearance enhancement considering pupil and retina behaviorsProc. IS&T CIC25: Twenty-Fifth Color and Imaging Conf.25404740–7IS&TSpringfield, VA
9ManabeY.TanakaM.HoriuchiT.2022Bumpy appearance editing of object surfaces in digital imagesJ. Imaging Sci. Technol.6605040310.2352/J.ImagingSci.Technol.2022.66.5.050403
10GigilashviliD.TrumpyG.2022Appearance manipulation in spatial augmented reality using image differencesProc. 11th Colour & Visual Computing Symposium (CVCS2022), CEUR Workshop Proceedings32711151–15CEUR-WS TeamAachen, Germany
11TrumpyG.GigilashviliD.2023Using spatial augmented reality to increase perceived translucency of real 3D objectsProc. EUROGRAPHICS Workshop on Graphics and Cultural Heritage858885–8The Eurographics AssociationEindhoven, The Netherlands
12NagaiT.KiyokawaH.KimJ.2025Top-down effects on translucency perception in relation to shape cuesPloS One201201–2010.1371/journal.pone.0314439
13HoY.-X.LandyM. S.MaloneyL. T.2006How direction of illumination affects visually perceived surface roughnessJ. Vis.6634648634–4810.1167/6.5.8
14PentlandA.1988Shape information from shading: a theory about human perception[1988 Proc.] Second Int’l. Conf. on Computer Vision404413404–13IEEEPiscataway, NJ
15NormanJ. F.ToddJ. T.OrbanG. A.2004Perception of three-dimensional shape from specular highlights, deformations of shading, and other types of visual informationPsychol. Sci.15565570565–7010.1111/j.0956-7976.2004.00720.x
16MarlowP. J.KimJ.AndersonB. L.2012The perception and misperception of specular surface reflectanceCurr. Biol.22190919131909–1310.1016/j.cub.2012.08.009
17HoY.-X.LandyM. S.MaloneyL. T.2008Conjoint measurement of gloss and surface texturePsychol. Sci.19196204196–20410.1111/j.1467-9280.2008.02067.x
18FlemingR. W.2014Visual perception of materials and their propertiesVis. Res.94627562–7510.1016/j.visres.2013.11.004
19PadillaS.DrbohlavO.GreenP. R.SpenceA.ChantlerM. J.2008Perceived roughness of 1/fβ noise surfacesVis. Res.48179117971791–710.1016/j.visres.2008.05.015
20ManabeY.TanakaM.HoriuchiT.2021Glossy appearance editing for heterogeneous material objects (jist-first)Electron. Imaging34
21BoyadzhievI.BalaK.ParisS.AdelsonE.2015Band-sifting decomposition for image-based material editingACM Trans. Graph. (TOG)341161–1610.1145/2809796
22ChowdhuryN. S.MarlowP. J.KimJ.2017Translucency and the perception of shapeJ. Vis.171141–1410.1167/17.3.17
23XiaoB.ZhaoS.GkioulekasI.BiW.BalaK.2020Effect of geometric sharpness on translucent material perceptionJ. Vis.201171–1710.1167/jov.20.6.1
24MarlowP. J.KimJ.AndersonB. L.2017Perception and misperception of surface opacityProc. Natl. Acad. Sci.114138401384513840–510.1073/pnas.1711416115
25MarlowP. J.de HeerB. P.AndersonB. L.2023The role of self-occluding contours in material perceptionCurr. Biol.33252825342528–3410.1016/j.cub.2023.04.056
26MotoyoshiI.2010Highlight–shading relationship as a cue for the perception of translucent and transparent materialsJ. Vis.101111–1110.1167/10.2.16
27KiyokawaH.NagaiT.YamauchiY.KimJ.2023The perception of translucency from surface glossVis. Res.20510814010.1016/j.visres.2022.108140, 12 pages
28HayashiH.UraM.MiyataK.2016The influence of human texture recognition and the spatial frequency of texturesITE Tech. Rep.40131613–6(in Japanese)
29SawayamaM.DobashiY.OkabeM.HosokawaK.KoumuraT.SaarelaT. P.OlkkonenM.NishidaS.2022Visual discrimination of optical material properties: A large-scale studyJ. Vis.221241–24
30FuG.ZhangQ.LinQ.ZhuL.XiaoC.2020Learning to detect specular highlights from real-world imagesProc. 28th ACM Int’l. Conf. on Multimedia, MM ’20187318811873–81Association for Computing MachineryNew York, NY, USA
31MeSSrro, “A close up of a cream colored surface,” https://unsplash.com/photos/a-close-up-of-a-cream-colored-surface-8aTZDhvHaVM/. Accessed: 2025-05-07
32BorbaJ.A black and white photo of a rock formation. https://unsplash.com/photos/a-black-and-white-photo-of-a-rock-formation-K1PnqvYYMUI. Accessed: 2025-05-07
33StobbeC. P.white angel statue on brown wooden floor. https://unsplash.com/photos/white-angel-statue-on-brown-wooden-floor—ZRdZ6z3Ok. Accessed: 2025-05-07
34DragoF.MartensW.MyszkowskiK.SeidelH.-P.“Perceptual evaluation of tone mapping operators with regard to similarity and preference,” Research Report MPI-I-2002-4-002, (Max-Planck-Institut für Informatik, Saarbrücken, Germany, 2002), p. 35
35KadyrovaA.PedersenM.WestlandS.2022Effect of elevation and surface roughness on naturalness perception of 2.5D decor printsMaterials (Basel)15337210.3390/ma15093372
36Van NgoK.StorvikJ. Jr.DokkebergC. A.FarupI.PedersenM.2015QuickEval: a web application for psychometric scaling experimentsProc. SPIE939693960O
37WangZ.BovikA. C.2009Mean squared error: Love it or leave it? A new look at signal fidelity measuresIEEE Signal Process. Mag.269811798–11710.1109/MSP.2008.930649
38WangZ.BovikA. C.SheikhH. R.SimoncelliE. P.2004Image quality assessment: from error visibility to structural similarityIEEE Trans. Image Process.13600612600–1210.1109/TIP.2003.819861
39WangZ.SimoncelliE. P.BovikA. C.2003Multiscale structural similarity for image quality assessmentThe Thirty-Seventh Asilomar Conf. on Signals, Systems & Computers, 20032139814021398–402IEEEPiscataway, NJ
40ZhangL.ZhangL.MouX.ZhangD.2011FSIM: a feature similarity index for image quality assessmentIEEE Trans. Image Process.20237823862378–8610.1109/TIP.2011.2109730
41VaiopoulosA. D.2011Developing Matlab scripts for image analysis and quality assessmentProc. SPIE8181607160–71
42ReisenhoferR.BosseS.KutyniokG.WiegandT.2018A Haar wavelet-based perceptual similarity index for image quality assessmentSignal Process.: Image Commun.61334333–4310.1016/j.image.2017.11.001
43MobiniM.FarajiM. R.2024Multi-scale gradient wavelet-based image quality assessmentVis. Comput.40871387288713–2810.1007/s00371-024-03267-9
44CreteF.DolmiereT.LadretP.NicolasM.2007The blur effect: perception and estimation with a new no-reference perceptual blur metricProc. SPIE6492196206196–206
45NarvekarN. D.KaramL. J.2011A no-reference image blur metric based on the cumulative probability of blur detection (CPBD)IEEE Trans. Image Process.20267826832678–8310.1109/TIP.2011.2131660
46MittalA.MoorthyA. K.BovikA. C.2012No-reference image quality assessment in the spatial domainIEEE Trans. Image Process.21469547084695–70810.1109/TIP.2012.2214050
47MittalA.SoundararajanR.BovikA. C.2012Making a ‘completely blind’ image quality analyzerIEEE Signal Process. Lett.20209212209–1210.1109/LSP.2012.2227726
48VenkatanathN.PraneethD.ChannappayyaM. C. Bh. S. S.MedasaniS. S.2015Blind image quality evaluation using perception based features2015 21st National Conf. on Communications (NCC)161–6IEEEPiscataway, NJ10.1109/NCC.2015.7084843
49CardilloG.Fleiss’es kappa: compute the Fleiss’es kappa for multiple raters. https://se.mathworks.com/matlabcentral/fileexchange/15426-fleiss, (2007). Accessed: 2025-05-09
50MahmoudiA.AbbasiM.YuanJ.LiL.2022Large-scale group decision-making (LSGDM) for performance measurement of healthcare construction projects: Ordinal priority approachAppl. Intell.52137811380213781–80210.1007/s10489-022-04094-y