Back to articles
Work Presented at CIC31: Color and Imaging 2023
Volume: 67 | Article ID: 050408
Image
Characterization of Wood Materials Using Perception-Related Image Statistics
  DOI :  10.2352/J.ImagingSci.Technol.2023.67.5.050408  Published OnlineSeptember 2023
Abstract
Abstract

An efficient computational characterization of real-world materials is one of the challenges in image understanding. An automatic assessment of materials, with similar performance as human observer, usually relies on complicated image filtering derived from models of human perception. However, these models become too complicated when a real material is observed in the form of dynamic stimuli. This study tackles the challenge from the other side. First, we collected human ratings of the most common visual attributes for videos of wood samples and analyzed their relationship to selected image statistics. In our experiments on a set of sixty wood samples, we have found that such image statistics can perform surprisingly well in the discrimination of individual samples with reasonable correlation to human ratings. We have also shown that these statistics can be also effective in the discrimination of images of the same material taken under different illumination and viewing conditions.

Subject Areas :
Views 151
Downloads 19
 articleview.views 151
 articleview.downloads 19
  Cite this article 

Jiří Filip, Veronika Vilímovská, "Characterization of Wood Materials Using Perception-Related Image Statisticsin Journal of Imaging Science and Technology,  2023,  pp 1 - 9,  https://doi.org/10.2352/J.ImagingSci.Technol.2023.67.5.050408

 Copy citation
  Copyright statement 
Copyright © Society for Imaging Science and Technology 2023
 Open access
  Article timeline 
  • received May 2023
  • accepted August 2023
  • PublishedSeptember 2023
jist
JIMTE6
Journal of Imaging Science and Technology
J. Imaging Sci. Technol.
1062-3701
1943-3522
Society for Imaging Science and Technology
1.
Introduction
Digital representations of materials are widely used in various applications. However, automatically interpreting the visual properties of captured materials remains an ongoing research challenge. To achieve automatic material assessment matching human-level performance, researchers often resort to intricate image filtering based on models of human perception. In the past decade, there has been an increasing trend in employing generative machine learning networks to extract latent information about material appearance. These networks have been applied to tasks ranging from material classification, style transfer to appearance synthesis [1]. While current deep learning models excel in image evaluation and synthesis, they heavily rely on large training datasets. This becomes a major bottleneck when it comes to human ratings, as acquiring large-scale training data for this purpose is difficult. Additionally, interpreting the latent parameters of deep learning methods, i.e., understanding their relationship to visual features, poses another challenge.
This paper adopts a different perspective to address this challenge, focusing on the utilization of image statistics to enhance material discrimination. Our primary motivation is to propose an easily interpretable parametric description of material appearance, focusing on a limited number of parameters with directly interpretable meanings. We have selected specific statistics inspired by low-level mechanisms of human vision, capable of explaining major visual attributes of material appearance. These statistics are also compact and easy to evaluate on images or videos.
Our goal is to identify a concise set of well-defined image statistics that can serve as features for assessing visual similarities between materials. This set should offer the option to focus on user-selected visual features. Once we identify such descriptive features, highly correlated with human ratings, they can act as visual fingerprints for materials. This parametric description could be applied for sorting or retrieval based on material similarity.
To assess human visual ratings of materials one can use either real specimens or their digital representations. Currently, one of the best approaches to digitally representing of real-world materials is the bidirectional texture function (BTF) [2]. BTF captures material appearance by a collection of photographs taken under varying illumination and viewing positions. While BTF allows for interactive viewing of materials on arbitrary shapes, it does have some quality limitations, such a limited size of the captured area, interpolation from data, and texture mapping on 3D shapes. As a result, we opted for captured videos showing the genuine material appearance of flat specimens under different viewing conditions [3]. These dynamic material appearance data allowed us to obtain human ratings on a preselected set of visual attributes. In this follow-up paper, we correlate human visual ratings of dynamic presentations of wood materials with basic image statistics averaged across all frames of the image sequence. The main contribution of this work is comparing human ratings of ten wood-related visual attributes with eleven selected computational statistics. These ratings and statistics were obtained from video stimuli featuring thirty wood veneer samples. Through correlation analysis and linear regression, we have demonstrated that the statistics perform well in predicting human ratings. Our experiments also revealed that the statistics can be effectively used as a global measure for inter- and intra-material comparison, going beyond pixel-wise assessments.
The following sections provide an overview of past research in material appearance understanding, describe the process of obtaining the human rating data, and discuss the selected image statistics. These statistics are then compared to the ratings and applied to inter-material and intra-material comparison tasks.
2.
Related Work
The analysis of human visual perception of material appearance has been extensively studied in the past [4]. Several studies have attempted to establish a connection between perceptual texture space and computational statistics. Tamura et al. [5] proposed a computational form of six basic texture properties and evaluated their performance through a rank ordering psychophysical experiment on 16 textures. The best results were found for coarseness, contrast, and directionality, which were also considered prominent global texture descriptors. However, line-likeness, regularity, and roughness showed lower correspondences between computational and psychological measurements. Rao and Lohse [6] identified a perceptual texture space by grouping grayscale textures. They analyzed the resulting data using hierarchical cluster analysis, multi-dimensional scaling, classification and regression tree analysis, discriminant analysis, and principal component analysis. The authors concluded that the perceptual texture space could be represented by a three-dimensional space with axes describing repetitiveness, contrast/directionality, and coarseness/complexity. Heaps and Handel [7] conducted an image grouping experiment to obtain the most relevant discriminative features. Their results indicated that similarity is context-dependent, and natural textures appear to be organized based on family resemblances. This suggests that models of preattentive segregation and attentive cognition may be incommensurable. Mojslovic et al. [8] performed a visual experiment to obtain a pattern vocabulary governed by grammar rules, incorporating previously suggested features and extending the scope to color textures. Their findings generally supported Rao’s and Lohse’s conclusions [6] concerning the perceptual dimensions. Malik and Perona [9] presented a model of human preattentive texture perception based on low-level human perception. Vanrell and Vitria [10] suggested a texton-based four-dimensional texture space, with perceptual textons’ attributes along each of the dimensions.
Another branch of research focused on the analysis of predefined visual and subjective attributes. Fleming et al. [11] presented an extensive analysis of human perception of materials. In the first study, nine subjects judged nine perceptual qualities. The stimuli images featuring materials in various shapes were taken from MIT-Flickr database. In the second study, 65 subjects assigned 42 adjectives describing material qualities to six classes of materials. The authors revealed that the distribution of material classes in the visual and semantic domains is similar and concluded that perceptual qualities are systematically related to material class membership. In a follow-up study, Tanaka et al. [12] analyzed subject rating of the same perceptual qualities as a function of visual information degradation. They assessed the qualities of 34 low chroma specimens divided into 10 material categories. Ten subjects judged real examples, their images in the same environment, and their gray-scale and down-sampled versions. The authors concluded that the general perceptual quality decreased with image-based reproduction, and perceptual qualities of images decreased when using their gray-scale variant, while qualities of hardness and coldness increased when the image resolution was reduced. Martin et al. [13] analyzed the visual, aural, and tactile attributes of materials and their mutual contribution to the perception of characteristic material parameters. Filip and Kolafova [14] analyzed 93 material samples in a psychophysical study, assessing 12 visual, tactile, and subjective attributes, and evaluated the relationship between these attributes and six material categories.
Computational features relating to visual attributes were also widely studied. A related research in material recognition identifies local material properties, so called visual material traits [15], encoding the appearance of characteristic material properties by means of convolutional features of trait patches. In follow-up work, researchers discovered a space of locally-recognizable material attributes from perceptual material distances by training classifiers to reproduce this space from image patches [16, 17].
The analysis of mutimodal perception of three different modalities—vision, audition, and touch—using wood as the target object was performed in [18]. Fifty participants evaluated 12 perceptual and 11 affective attributes of 22 wooden samples and concluded that affective property evaluations of wood were similar in vision, audition, and touch. Additionally, affective properties of wood were at least partly represented supramodally, and perceptual and affective properties were shown to be associated. Sharan et al. [19] studied judgments of high-level material categories with a diverse set of real-world photographs. There we have shown that observers can categorize materials reliably and quickly. Performance of the tasks cannot be explained by simple differences in color, surface shape, texture, or by performing shape-based object recognition. The authors argue that fast and accurate material categorization is a distinct, basic ability of the visual system. Instead of studying individual visual attributes separately, Gigilashvili et al. [20] conducted experiments using physical objects, asking observers to describe the objects and carry out visual tasks. The process has been videotaped and analyzed qualitatively using qualitative research methodology from social science. The obtained qualitative model is then compared with material appearance models, and in combination with a set of research hypotheses, can be used for generalization of the model predictions.
This work uses rating data obtained in Ref. [3], where perceptual dimensions of wood were analyzed by a combination of similarity and rating studies. In this work, we represent the obtained rating data using computational statistics and demonstrate to what extent computational statistics can be used to characterize visual properties on an on additional test dataset. The performance of the selected statistics is demonstrated on inter-material (between different materials) and intra-material (between images of the same material) comparison tasks.
3.
Human Ratings of Wood Materials
We used thirty wood veneers (SET 1) carefully selected from a catalog of over one hundred wood veneers to provide as broad and uniform a range of appearances as possible (see Figure 1). For the purpose of results validation, we also prepared an additional test dataset of 30 wood samples (SET 2). The rating study was performed for each dataset independently. Forty-five observers participated in the online rating study [3]. All participants were undergraduate students and naive to the purpose of the study, and their demographics data were not collected. All participants reported normal or corrected-to-normal vision and no colour vision impairments. On average, the experiment took 22 minutes (SD = 17.6). Participants were presented with 30 trials, each showing one video of wood sample illuminated by a fixed point light source, while the camera azimut changed in the range 0–90, showing the material in both specular and non-specular configurations (see a supplementary movie). The polar angles of the light and camera were set to 45. The resolution of each stimulus image was 920 × 600 pixels. To facilitate setting up visual scales of visual attributes, all other materials were simultaneously presented for comparison at a smaller scale at the top of the screen, as shown in Figure 2.
Figure 1.
Two sets of wood veneer samples used in our experiments shown in specular condition (light is opposite to camera).
Figure 2.
An example of rating stimulus shown to the observers. Note that stimulus is dynamic due to rotating viewpoint around the sample’s surface.
Based on a review of previous studies identifying visual dimensions of materials [5, 6, 8, 11] and those specifically targeting wood materials [21], ten visual appearance attributes were selected: brightness, glossiness, colorfulness, directionality, complexity, contrast, roughness, patchiness/regularity, line elongation, spatial scale. At the beginning of the study, participants were informed that they would evaluate the visual appearance attributes of wood materials. Participants used a slider-controlled visual analog scale with the range 0–100. The meaning of each visual attribute was explained with a short sentence (e.g., brightness: “How bright is the material in comparison with the others?”). Also, the endpoints of each scale were labeled (e.g., brightness: “dark” and “bright”). Participant did not have the opportunity to revise their ratings. For more details on the study, refer to [3]. This paper reuses the rating data and relate them to selected statistics outlined in the next section.
Figure 3.
Dendrograms obtained by hierarchical clustering of samples on both datasets: (a,c) human ratings, (b,d) computational statistics.
Figure 4.
Similarity matrices for both datasets for (a,d) rating data, (b,e) computational statistics, (c) regression of rating using statistics, (f) ratings prediction of SET 2, using statistics and regression coefficients from SET 1. R and R2 scores compare similarity matrices values without diagonal.
We considered normalization of the rating scores (z-scoring), but eventually decided to keep the original scale 0–100 as it yielded significantly better results. The standard deviation across subjects, averaged across all attributes, was 20.54.
To evaluate agreement among observers, we used the Krippendorff’s alpha [22], a statistical measure of the agreement generalizing several known statistics designed to indicate their reliability on the scale 0-1. The mean value across all attributes was αK = 0.371, while the highest values were obtained for brightness/colorfulness/directionality—line (0.678/0.426/0.480/0.495) and the lowest values for complexity/patchiness/spatial scale (0.233/0.251/0.178).
Additionally, hypothesis testing of attributes means using repeated measures. ANOVA confirmed significant differences between attributes means with p-values below 0.0005, except complexity, patchiness and spatial scale having p-values 0.0018, 0.0100 and 0.0194, respectively.
4.
Selected Computational Statistics
When selecting a narrow set of image statistics, we preferred those that could be evaluated quickly, had a limited total number of parameters, and had the ability to explain all the tested rating attributes.
We were inspired by statistics used in image synthesis approaches [23], which have been shown to share the same principles as the human vision system [24]. Thus, we selected minimum, maximum, and mean values of material images across the entire sequence of sixty video frames. These are expected to account for the visual attribute brightness. As the minimum and maximum values might be prone to noise in image data, impacting results robustness, we used 1st and 99th percentile instead. All remaining statistics should be sufficiently robust with regards to noise in the data. The variance of pixel values across the image is expected to correlate with contrast and roughness. Next, we used higher-orders image statistics such as skewness and kurtosis as they are used as measures of effective image synthesis [23] and may be related to high-level visual attributes. To obtain computational information on visual directionality, we resorted to binning contributions of azimuthal directions in the amplitude spectrum of the Fourier domain [25, 26] to form a discrete Fourier polar-coordinate matrix. Texture structure size-related information, such as patchiness/regularity, complexity, spatial scale, was approximated by the power spectral distribution of the the amplitude FFT spectrum divided into three bins containing low (0–4 cycles per image), middle (5–49 cycles per image) and high frequencies (50–127 cycles per image). All these features were computed on the luminance channel of the CIELAB colorspace. To account for sample colorfulness, we evaluated the mean chroma value obtained by a2+bb. In total, we used eleven image statistics computed independently for each frame of the image sequence and averaged across all sixty video frames. Prior to further processing, all the data were normalized using z-scoring, which is essential as the ranges vary significantly across individual statistics.
5.
Similarity Analysis of Ratings and Statistics
To identify clusters of similar wooden materials, we performed hierarchical clustering. Since combining individual attributes into a single clustering distance (e.g., using Euclidean distance) does not make much sense, we used Pearson correlation to compare sets of eleven attributes of two material samples as a similarity measure between ratings/statistics of samples pair. Dendrogram plots in Figure 3 provide insights into hierarchy of the samples based on their similarities for both datasets. Here (a,c) show results of the ratings, while (b,d) show results of the proposed statistics. For rating data, we observe three main clusters for both datasets. These can be interpreted as non-directional (blue), directional (red,green), smooth/less contrast (magenta) for (a) SET 1. In (c) SET 2 majority of samples are directional, so the samples seem to be divided into clusters based on their brightness/color. The statistics (b,d) provide quite similar clusters distribution. In both cases, the samples are distributed into clusters similarly to the rating data.
To assess overall similarities between materials, we computed aggregated similarity matrices for all human ratings and statistics, again using the correlation of ratings/statistics vectors as a similarity measure for the matrix computation. Similarity matrices (30 × 30 samples) are shown in Figure 4, where (a) corresponds to ratings, and (b) corresponds to statistics of the first dataset. The same results for the second dataset are shown in (d) and (e). While in the SET 1 we observe the three similarity clusters, for the SET2, there are rather two larger clusters, shown in different colors. Clusters along the similarity matrix diagonal visualize the results of hierarchical clustering in Fig. 3. Note that the materials in the similarity matrix are sorted based on the similarity of original ratings evaluated by the correlation of two ratings vectors.
In Ref. [3], we computed the similarity of individual attributes’ ratings using the correlation of their similarity matrices. It was shown that colorfulness was very similar to contrast, complexity to regularity, directionality to line segments, and brightness to glossiness and spatial scale.
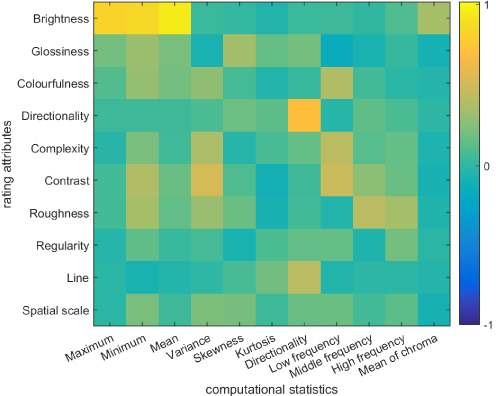
In the next step, we computed correlations between visual ratings and computational statistics. The correlation was computed on similarity matrices obtained independently for each rating attribute and statistic by differentiating values for different samples. The similarity matrix diagonal was excluded during the correlation computation. The correlation plot is shown in Figure 5. We observe a strong relation of brightness with maximum, minimum and mean. Glossiness has a more complex positive correlation, mainly with the minimum and skewness. Surprisingly, colorfulness was not strongly related to chroma, but instead to minimum, variance and mainly low frequencies. Moreover, mean chroma was correlated mainly with brightness, which might suggest that bright samples are more chromatic. Very similar results were obtained for complexity and contrast. Roughness gave similar results, but instead, low frequencies provided higher responses for middle and high frequencies. As expected, directionality and line segments were strongly related to computational directionality. Glossiness, regularity and spatial scale have, in general, low correlations with our statistics. This could be due to high-level nature of these attributes, relying on combined contributions of statistics.
Figure 5.
Correlation between the visual ratings and suggested statistics computed on the similarity matrices.
In order to evaluate contribution of individual statistics to rating representation, we performed leave-one-out analysis, removing individual statistics and evaluating changes in rating prediction. Results shown in Figure 6 indicate that removing directionality had a major impact on the correlation between ratings and their predictions, therefore, indicating importance of this statistic. Other statistics showing a slight drop in the correlation are kurtosis, chroma, skewness, and maximum. The importance of directionality might be due to the directional structure, which is present in some form in the majority of samples, and its strength might be one of the major distinguishing factors.
Figure 6.
Correlation drop obtained for leave-one-out analysis of individual statistics.
As our stimuli are dynamic, we also analyzed whether adding time-variable statistics improves our results. We found that adding the standard deviation of individual statistics as additional parameters did not improve the correlation of prediction, even when we added them one by one. A higher improvement in performance was obtained by using statistical values for distinct frames from the sequence instead of their average. This resulted in twice so many parameters, i.e., one set for the specular and the other the non-specular frame. Such a configuration increased the correlation of predicted values on SET1 from 0.83 to 0.98; however, we consider this model to be over-fitted as the correlation of prediction on SET2 dropped from 0.74 to 0.51. Therefore, we consider using the mean values if statistics as a good balance between prediction accuracy and model generalization abilities.
6.
Predicting Ratings Using Statistics
Our statistics demonstrated promising descriptive performance, and we expect that even better fit to the rating data can be obtained by modelling their mutual relationship. To this end, we used linear regression model with intercept, taking each rating dimension as the dependent variable and statistics as the independent variables. Analysis of linear model coefficients in Figure 7 showed that the highest absolute coefficients loadings were obtained for the statistics; mean, followed by minimum, maximum, variance and middle frequency. It is also clear that mean is the main factor for representation of the majority of attributes apart from roughnees, regularity, and spatial scale.
Figure 7.
Loadings of linear regression coefficients obtained for individual rating attributes.
First, regression on SET 1 provided rating predictions with Pearson correlation to human ratings R = 0.92 (R2 = 0.85) (computed on all 30 ⋅ 10 = 300 values). Results of performance for individual rating attributes are shown as blue bars in Figure 8. All attributes were represented similarly well, with the worst results for spatial scale, which is a challenging attribute for participants as they might provide confused results for samples with both fine and large scale structures. Next, we used coefficients obtained for SET 1 to predict, in combination with computed statistics, the ratings of the SET 2. This prediction yielded a correlation with human ratings R = 0.74 (R2 = 0.55) as shown by the yellow bars in Fig. 8. Here, we observe a drop in correlations for the majority of attributes. However, reasonably good performance is obtained for brightness, colorfulness, contrast, and directionality. The model was not able to generalize, especially for high level attributes glossiness, regularity, and spatial scale.
Figure 8.
Pearson correlation between visual the ratings (rows) and computational statistics (columns).
Figure 9.
t-SNE visualization of material samples computed from similarity matrix for both datasets: (a,d) for human ratings, (b,e) computational statistics, (c) linear regression of ratings by the statistics, (f) linear regression of ratings by the statistics using regression coefficients from (c).
Fig. 4(c,f) shows the similarity matrices computed based on the predicted rating data with correlations to the reference similarity matrix computed directly from visual ratings. In comparison to the similarity matrices obtained directly from computed statistics in Fig. 4(b,e), we observe an improvement especially for the training SET 1. However, for the test set SET 2, we observe similar performance, also indicated by similar correlation values. This suggests that in our test set, the linear regression did not significantly improve the results, and one can use the computational statistics directly to obtain similar results. In this case, the computational statistics can still represent 64% of variability in the data (obtained by R2 score in Fig. 4(e)).
Although the linear model with an intercept was used, we still risk collinearity between individual statistics. Therefore, we tested ridge regression as an alternative to linear regression, which should be more robust in terms of independent variables (i.e., image statistics) collinearity. We used ridge regression with an intercept and regularization parameter obtained for each attribute independently. Unfortunately, the predicting performance gain of this model was negligible.
In the next subsections, we demonstrate how our statistical description performs in applied tasks related to inter- and intra-material comparison.
6.1
Inter-material Comparison
In this section, we compared the similarity of thirty materials in both datasets using t-distributed stochastic neighbor embedding (t-SNE) [27]. This method uses dissimilarity matrix to visualize high-dimensional data by giving each datapoint a location in a two or three dimensions. To achieve better alignment, linear transformation of datapoints using Procrustes analysis was applied. Figure 9 shows the alignment of materials in a similar manner to the panels as in Fig. 4, i.e., the first row shows results obtained from similarity matrices of SET 1: (a) human ratings, (b) computational statistics, and (c) prediction using linear regression of statistics. The second row shows results for SET 2: (d) human ratings, (e) computational statistics, and (c) prediction using regression coefficients computed for SET 1. In both cases, one can observe a similar distribution of samples along the t-SNE dimensions, though the results for prediction based on the linear regression model (c,f) are closer to the reference.
6.2
Intra-material Comparison
The descriptive performance of our statistics can be used also for similarity assessment of the same material observed for variable illumination and viewing conditions. One example of such a dataset can be the bidirectional texture function (BTF) [2]. We captured BTF data of the first wood sample used in the experiment, as a collection of pixel-wise registered 6561 material HDR photographs obtained for 81 illumination and 81 view positions over a hemisphere above the captured sample [28]. The resolution of the photographs was 256 × 256 pixels, corresponding to the physical sample’s area 40 × 40 mm. Similarly to [29], we performed data quantization to reduce the number of images to three levels: 2000, 100, and 10. We used two reduction metrics: (1) the mean square error for pixel-wise ΔE difference in the CIELAB colorspace and (2) the correlation of the proposed statistics. Based on these metrics, similar images in BTF dataset were represented by only one of them. We used different quantization thresholds to obtain the required numbers of images. An overview showing which images are preserved for are shown in Figure 10. Rows/columns of each map represent lighting/viewing directions starting from the pole of the hemisphere and spiraling to its bottom. The change of light/view polar angle (0, 15, 30, 45, 60, 75) is denoted by the change of background intensity (rectangular pattern). Patterns of the preserved images (green dots) suggest that ΔE metric is very sensitive to changes of brightness and accumulates most of the samples along specular reflections (diagonal stripes), especially at large polar angles. In contrast, the proposed metric scatters the samples across different viewing and illumination directions more uniformly.
Figure 10.
Maps of the preserved BTF images for two tested metrics and their three different thresholds preserving 2000, 100, and 10 images. The preserved images are shown as green dots in BTF space of 81 illumination (rows) and 81 viewing (columns) directions.
Figure 11 compares rendered images for both metrics and all three levels of compression. The results demonstrate that our statistical representation can perform similarly to the pixel-wise difference metric.
Figure 11.
A comparison of BTF renderings for all images with their reduced variants for three reduction thresholds (columns) and two different reduction metrics (rows). Attached are the difference images from the reference.
7.
Discussion and Future Work
Our statistical similarity representation has several advantages. First, it is fast to evaluate as its values are global for the image and thus do not depend on pixel-wise comparison. Second, it is fully parametric, allowing a comparison only on a selected subset of attributes. For example, we can disregard image directionality and compare similarity only based on the other statistics.
Our material dataset set comprised of a limited number of 30 wooden samples. Although the samples were carefully selected to span variances within the category of wood materials, it is not sufficient for covering all variability in natural woods. Additionally, our work reports results obtained for one of the initial selection of image statistics used as material texture similarity criteria. Although it showed promising descriptive and discriminative performance, we expect its further extension to better discriminate colorful materials and materials with multidirectional patterns, common for fabrics. We plan to extend the number of tested statistics to account for the best representation of human ratings. Concerning the application to BTF data reduction, we plan to improve its performance by introducing linear scaling when the image is replaced by its similar counterpart.
We plan to extend our analysis on a larger set of materials spanning over different material categories, to identify a unified material statistical description acting effectively as material visual fingerprint.
A source code for statistics computation is available athttp://staff.utia.cas.cz/filip/pub.html.
8.
Conclusions
This paper investigates the extent to which basic image statistics can reproduce human rating of visual attributes. We collected visual rating responses for two sets of 30 wood veneers shown as image sequence under variable illumination and viewing conditions. We selected a set of eleven image statistics that were averaged across all frames of the sequence. The similarity between human ratings, image statistics, and rating predictions using linear regression of image statistics was analyzed by means of using hierarchical clustering, correlation of ratings and similarity matrices. Our results suggest that basic image statistics perform well for both inter- and intra-material comparison, as demonstrated by comparing different materials using t-SNE. Additionally, they prove effective for compressing BTF datasets based on a comparison of images of the same material taken under different illumination and viewing conditions. By leveraging image statistics and their relationship to human-rated attributes, we have demonstrated a promising avenue for automatic material assessment, and more streamlined and efficient material characterization techniques in various domains.
Acknowledgment
This research has been supported by the Czech Science Foundation grant GA22-17529S. We thank Jiri Lukavsky and Filip Dechterenko from Psychology Institute of CAS for help with rating data collection in the online study. The authors have no competing interests to declare that are relevant to the content of this article.
References
1DongY.2019Deep appearance modeling: a surveyVis. Inform.3596859–6810.1016/j.visinf.2019.07.003
2DanaK.van GinnekenB.NayarS.KoenderinkJ.1999Reflectance and texture of real-world surfacesACM Trans. Graph.181341–3410.1145/300776.300778
3FilipJ.LukavskyJ.DechterenkoF.FlemingR.SchmidtF.Perceptual dimensions of wood materials, PsyArXiv, doi:10.31234/osf.io/3qkz9 (2023)
4FlemingR. W.2014Visual perception of materials and their propertiesVis. Res.94627562–7510.1016/j.visres.2013.11.004
5TamuraH.MoriS.YamawakiT.1978Textural features corresponding to visual perception, systems, man and cyberneticsIEEE Trans.8460473460–7310.1109/TSMC.1978.4309999
6Ravishankar RaoA.LohseG.1996Towards a texture naming system: identifying relevant dimensions of textureVis. Res.36164916691649–6910.1016/00426989(95)00202-2
7HeapsC.HandelS.1999Similarity and features of natural texturesJ. Exp. Psychol. Hum. Percept. Perform.25299320299–32010.1037/0096-1523.25.2.299
8MojsilovicA.KovacevicJ.KallD.SafranekR.Kicha GanapathyS.2000The vocabulary and grammar of color patternsIEEE Trans. Image Process.9417431417–3110.1109/83.826779
9MalikJ.PeronaP.1990Preattentive texture discrimination with early vision mechanismsJ. Opt. Soc. Am. A7923932923–3210.1364/josaa.7.000923
10VanrellM.VitriaJ.RocaX.1997A multidimensional scaling approach to explore the behavior of a texture perception algorithmMach. Vis. Appl.9262271262–7110.1007/s001380050047
11FlemingR. W.WiebelC.GegenfurtnerK.2013Perceptual qualities and material classesJ. Vis.139:19:209:1–9:2010.1167/13.8.9
12TanakaM.HoriuchiT.2015Investigating perceptual qualities of static surface appearance using real materials and displayed imagesVis. Res.115246258246–5810.1016/j.visres.2014.11.016
13MartínR.IseringhausenJ.WeinmannM.HullinM. B.2015Multimodal perception of material propertiesProc. ACM SIGGRAPH Symposium on Applied Perception, SAP ’15334033–40ACMNew York, NY10.1145/2804408.2804420
14FilipJ.KolafováM.2019Perceptual attributes analysis of real-world materialsACM Trans. Appl. Perception (TAP)161191–1910.1145/3301412
15SchwartzG.NishinoK.2013Visual material traits: Recognizing per-pixel material context2013 IEEE Int’l. Conf. on Computer Vision Workshops883890883–90IEEEPiscataway, NJ10.1109/ICCVW.2013.121
16SharanL.LiuC.RosenholtzR.AdelsonE. H.2013Recognizing materials using perceptually inspired featuresInt. J. Comp. Vis.103348371348–7110.1007/s11263-013-0609-0
17SchwartzG.NishinoK.2015Automatically discovering local visual material attributes2015 IEEE Conf. on Computer Vision and Pattern Recognition (CVPR)356535733565–73IEEEPiscataway, NJ10.1109/CVPR.2015.7298979
18FujisakiW.TokitaM.KariyaK.2015Perception of the material properties of wood based on vision, audition, and touchVis. Res.109185200185–20010.1016/j.visres.2014.11.020
19SharanL.RosenholtzR.AdelsonE. H.2014Accuracy and speed of material categorization in real-world imagesJ. Vis.1412:112:2412:1–12:2410.1167/14.9.12
20GigilashviliD.ThomasJ. B.PedersenM.HardebergJ. Y.2021On the appearance of objects and materials: qualitative analysis of experimental observationsJ. Int. Colour Assoc. (JAIC)27265526–55
21NordvikE.SchütteS.BromanN. O.2009People’s perceptions of the visual appearance of wood flooring: a kansei engineering approachForest Prod. J.59677467–7410.13073/0015-7473-59.11.67
22HayesA. F.KrippendorffK.2007Answering the call for a standard reliability measure for coding dataCommun. Methods Meas.1778977–8910.1080/19312450709336664
23PortillaJ.SimoncelliE. P.2000A parametric texture model based on joint statistics of complex wavelet coefficientsInt. J. Comp. Vis.40497049–7010.1023/A:1026553619983
24VacherJ.BriandT.2021The Portilla–Simoncelli texture model: towards understanding the early visual cortexImage Process. on Line11170211170–21110.5201/ipol.2021.324
25Hagh-ShenasH.InterranteV.Hee-ParkC.2006A closer look at texture metrics for visualizationProc. SPIE605760570@10.1117/12.643150
26MaskeyM.NewmanT. S.2021On measuring and employing texture directionality for image classificationPattern Anal. Appl.24164916651649–6510.1007/s10044-021-01013-8
27Van der MaatenL.HintonG.2008Visualizing data using t-SNEJ. Mach. Learn. Res.9257926052579–605
28FilipJ.VavraR.HaindlM.ZidP.KrupickaM.HavranV.2013BRDF slices: accurate adaptive anisotropic appearance acquisitionConf. on Computer Vision and Pattern Recognition, CVPR432143264321–6IEEEPiscataway, NJ10.1109/CVPR.2013.193
29FilipJ.ChantlerM.GreenP.HaindlM.2008A psychophysically validated metric for bidirectional texture data reductionACM Trans. Graph.27138:1138:11138:1–138:1110.1145/1457515.1409091