Back to articles
Work Presented at CIC31: Color and Imaging 2023
Volume: 67 | Article ID: 050406
Image
Color Performance Review (CPR): A Color Performance Analyzer for Endoscopy Devices
  DOI :  10.2352/J.ImagingSci.Technol.2023.67.5.050406  Published OnlineSeptember 2023
Abstract
Abstract

Color performance is an important safety and performance attribute of endoscopes. An endoscope that exhibits poor color performance inadequately reproduces color images and may make it difficult for the endoscopist to visualize features needed for diagnostic or therapeutic tasks. Various color performance testing methods have been developed to evaluate color fidelity of endoscopes since 1987. However, these testing methods have limited utility because most endoscopes cannot and do not intend to reproduce the original color faithfully. In this work, endoscope color performance is reviewed by evaluating preservation of color contrast between patches and preservation of the patch order in lightness, hue, and chroma. The analysis method was implemented as the Color Performance Review (CPR) tool and is available in the catalog of Regulatory Science Tools published by FDA/CDRH/OSEL.

Subject Areas :
Views 227
Downloads 68
 articleview.views 227
 articleview.downloads 68
  Cite this article 

Wei-Chung Cheng, "Color Performance Review (CPR): A Color Performance Analyzer for Endoscopy Devicesin Journal of Imaging Science and Technology,  2023,  pp 1 - 9,  https://doi.org/10.2352/J.ImagingSci.Technol.2023.67.5.050406

 Copy citation
  Copyright statement 
Copyright © Society for Imaging Science and Technology 2023
 Open access
  Article timeline 
  • received May 2023
  • accepted August 2023
  • PublishedSeptember 2023
jist
JIMTE6
Journal of Imaging Science and Technology
J. Imaging Sci. Technol.
1062-3701
1943-3522
Society for Imaging Science and Technology
1.
Introduction
1.1
Endoscope
Endoscope is a general term for medical imaging devices used to examine internal organs via orifices of the human body to conduct diagnostic, therapeutic, and observational tasks [1]. Different types of endoscopes have been designed to gain access to the ear (otoscope), nose (rhinoscope), throat (nasopharyngoscope), larynx (laryngoscope), tracheobronchial tree (bronchoscope), gastrointestinal tract including esophagus, stomach and small bowel (gastroscope), duodenum (duedenoscope), bile duct (cholesdoscope), urinary track (cystroscope, ureteroscope), cervix/uterurs (hysteroscope), colon/rectum (colonoscope), etc.
A video endoscope delivers the light and imaging components into the human body near the region of interest (RoI) for image acquisition and then transmits the image data from RoI for image display. A rigid endoscope transmits the light and image through optical paths such as fiber optics. A flexible endoscope uses a flexible tube to manually control the scope’s position, shape, and angle while conveying the image data through electrical conduits. Both rigid and flexible endoscopes allow the endoscopist to control the device to view the image in real time, so the RoI can be revisited from different angles to get a better view, if needed. In contrast, a capsule endoscope is passively propelled by the gastrointestinal tract and stores the images wirelessly in an external recorder. The stored images will be processed and viewed offline after the device is excreted to conclude the session [24]. The endoscopist cannot control the view unless the device can be remotely controlled [5] as in the case of a magnetically maneuvered capsule endoscope. Unlike most flexible endoscopes, capsule endoscopes do not have the water/air channel for rinsing or the instrument channel for biopsy. Due to the limited form factor and single-use nature, capsule endoscopes usually do not have the capability to deliver imaging quality equivalent to flexible endoscopes.
The visualization capability of an endoscope is the foundation for safely conducting diagnostic and therapeutic tasks, which may pose risks to the patient depending on the intended use. A video endoscope can be considered as a complete color imaging system that is usually divided into three cascaded components as shown in Figure 1: the scope that includes optical components (e.g., imaging sensor, lens system, and light source/guide) for image acquisition, the video processor for processing the image data, and the display for reproducing the image for the human user. The interface between the scope and the video processor is usually a well-defined proprietary interface such that different scopes can operate with the same video processor. Single-use scopes provide a convenience option that eliminates the burden of sterilization or reprocessing. However, single-use scopes’ disposable imaging components do not deliver the same image quality as re-usable flexible scopes. Depending on the design of a flexible endoscope, the light source can be either built in the distal end of the scope, or housed inside the video processor. The display can be built in the video processor as a closed system, or it can be an external medical-grade monitor in an open system. Some endoscope systems use a desktop or tablet computer to implement the hardware and software functions of a video processor.
Figure 1.
An endoscope system consists of the scope, video processor with light source, and display. A color test target with a reference white patch is the scene to be imaged. The display output is optically measured by a spectroradiometer/colorimeter to obtain the CIEXYZ data.
Most endoscopes use white light to provide the basic white light imaging (WLI) mode. Some endoscopes use specific light spectra to enhance color contrast for certain features such as blood vessels, called optical chromoendoscopy. The narrow band imaging (NBI) mode uses narrow-band color filters and a broad-band white light source to generate the specific spectra. When individually controlled red, green, and blue light-emitting diodes (LED) are used to mix white light in modern endoscopes, new illumination modes can be easily populated [6, 7]. Other endoscopes achieve similar effects by digitally processing white light-illuminated images, called digital chromoendoscopy. Such digital chromoendoscopy modes can be implemented in software without additional hardware and multiplied quickly by changing the mix ratio between different color channels.
1.2
Color Performance Testing
Color performance is an important safety and performance attribute of endoscopes. An endoscope that exhibits poor color performance inadequately reproduces color images and may make it difficult for the endoscopist to visualize features needed for diagnostic or therapeutic tasks. Unfortunately, there is not a standard, well-adopted color performance testing method dedicated to endoscopes yet. Endoscopes are frequently tested with methods that measure optical characteristics with monochrome test patterns. The drawback is that such grayscale-based testing results do not represent the actual color performance. For example, a black/white test pattern is suitable for measuring the grayscale contrast of an endoscope. However, in colonoscopy, the image is rendered not in gray shades but in pink shades. A colonoscope with higher grayscale contrast may have lower contrast between pink shades. Using grayscale contrast to estimate the color performance may be misleading.
Since the first commercial video endoscope marketed in 1983 [8, 9], color performance has been an important characteristic to be tested [1019]. The first colorimetry-based, quantitative color performance testing was reported in 1987 [12]. To assess accurate color reproduction of mucosal and biological fluids, Knyrim et al. used six color patches to test four pioneering video endoscopes. The device output was measured from the display with a colorimeter to obtain the CIEXYZ values. The measurement results were plotted on the CIE chromaticity diagram to compare their color gamut areas against the ground truth. Test results showed that all endoscopes exhibited color shift and reduced color gamut in addition to non-uniformity issues. Although the devices were quantitatively measured, the inter-device comparison was qualitative and limited to chromaticity (i.e., lightness excluded) evaluation only.
Three decades later, the same testing framework is still being used in recent endoscope studies, and more colorimetry models and tools have been developed and utilized to evaluate endoscopes. For example, the perceptually uniform CIELAB color space was used to predict the perceived color [7]. The CIE 1976 color difference model (ΔE76) was used to evaluate color difference between color shades [6]. The improved CIEDE2000 color difference model (ΔE00) was used to predicate the perceived color difference [18, 19]. Fig. 1 depicts such a testing framework, which is described as follows.
Prepare the device under test according to the user’s manual. Conduct the white balance procedure and adjust illumination power if applicable. The testing should be conducted in a light-proof environment such that the test target is illuminated by the device’s light source only.
Document the test conditions, including the hardware components and software settings, such as the imaging mode (e.g., white light mode or color enhancement mode), custom settings (e.g., image enhancement or color enhancement), etc.
The ground truth is obtained by using a spectroradiometer/colorimeter to measure the color target as well as the reference white patch illuminated by the device’s light source. Record the results in the CIEXYZ color space.
The device output is obtained by using a spectroradiometer/colorimeter to measure the device output from the designated display. Record the results in the CIEXYZ color space.
If the designated display uses a standard color space (e.g., sRGB [20], Adobe RGB [21], or DCI-P3 [22]), the digital RGB signals can instead be measured electronically from the display interface [18] for calculating the optical output of an ideal display.
1.3
Color Performance Versus Color Fidelity
All of the aforementioned testing methods evaluate the absolute color difference between the ground truth and the device output. For example, absolute color errors measured by CIEDE2000 are used to define “color fidelity” in [18]. Evaluating absolute color difference is suitable for color imaging devices that are intended to accurately reproduce the original color. However, in practice, most endoscopy devices cannot and do not intend to faithfully reproduce the original color. As a medical device, an endoscope is intended to be used to visualize biological features. Many endoscopes are not color-calibrated accurately, and some employ intensive image and color processing algorithms. As a result, the absolute color errors may not represent the actual color performance according to its intended use. When interpreting the test results, small absolute color errors can indicate a well-calibrated endoscopy device. But large absolute color errors do not always indicate an inadequate endoscope. It is not uncommon for clinical endoscopes to generate absolute color errors greater than 20 ΔE00. Thus, comparing two endoscopes that both have excessive absolute color errors will not help determine whether they have equivalent color performance.
In this work, we describe alternative methods for evaluating endoscopes that do not intend to reproduce the original color.
2.
Methods
Two properties of the inter-patch relations are considered in this study.
2.1
Preservation of Color Contrast Between Patches
Although an endoscopy device may not intend to reproduce the original color faithfully, the color contrast present in the ground truth should be preserved in the image reproduced by the device. In other words, two visually discernible color shades in the original scene should still be discernible in the reproduced image. The CIE color difference formulas are used to measure how well two color shades can be visually discerned.
Let truthi and devicei be the CIELAB coordinates of patch i measured from the color target and device output, respectively.
Each truthi and devicei can be represented as a datapoint (L, a, b) in the three-dimensional CIELAB color space. ΔE is a function calculating the color difference between two color shades based on either the ΔE00, ΔE94, or ΔE76 formulas. The color contrast enhancement (CCE) between two color patches i and j is defined as:
(1)
CCE =ΔE(devicei,devicej)ΔE(truthi,truthj),
where i and j are different numbers iterating all pairs of different color patches on the color target. Figure 2 illustrates the difference between color fidelity and color contrast.
Figure 2.
Two color shades truthi and truthj are reproduced by an endoscope as devicei and devicej. Color fidelity evaluates ΔE(truthi, devicei) or ΔE(truthj, devicej). Color contrast evaluates the ratio of ΔE(devicei, devicej) to ΔE(truthi, truthj).
The CCE measures the degree to which the color difference between two patches will be changed by the device. When CCE > 1, the color difference is increased by the device. When CCE < 1, the color difference is reduced by the device. When CCE = 1, the color difference remains the same regardless of whether or not the color transformation is faithful. High-quality endoscopy systems are expected to have CCE > 1 since the color contrast will be preserved or more visible. The CCE can also be used to compare two endoscopy systems when both have CCE < 1.
When the color differences of all n(n1)2 pairs of n patches are graphed on a scatter plot as shown in Figure 3, the identity line x = y can help judge whether a patch-pair has CCE > 1, CCE < 1, or CCE = 1. The identity line can also help calculate the percentage of patch-pairs that have CCE > 1.
Figure 3.
Preservation of color contrast between patches. The CCE values are calculated based on the ΔE00 formulas. Each colored cross represents a patch-pair where the horizontal and vertical bars are colored separately according to the patch-pair. The percentage indicates patch-pairs that have CCE ≥ 1.
2.2
Preservation of the Patch Order in Lightness, Hue, and Chroma
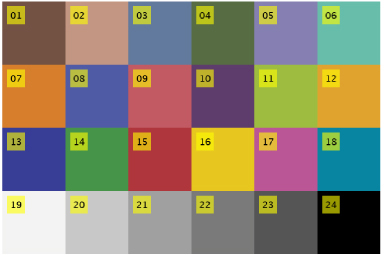
Although an endoscopy device may have specific rendering intent to enhance certain color features, the color order in a perceptual color space should still be preserved. For example, considering the lightness attribute of the patches shown in Figure 4, a lighter patch (#21) should always look brighter than a darker patch (#22) regardless of the devices’ rendering intent. Similarly, the order of the hue attribute should be preserved. For example, an orange patch (#7) should always look more reddish than an orange-yellow patch (#12). Finally, the order of the chroma attribute should be preserved. For example, a red patch (#15) should always look more colorful than a moderate red patch (#9).
Figure 4.
Color test target. The 24 color patches in the X-Rite ColorChecker.
In this study, the CIELCH color space is used to analyze the patch order in lightness, chroma, and hue. CIELCH is the cylindrical polar coordinate representation of CIELAB, which is the Cartesian coordinate representation of the same color space. The patches in the CIELCH color space should preserve the patch order in lightness, chroma, and hue defined by the ground truth.
Figure 5 shows the patch order in lightness, chroma, and hue in two-dimensional charts. The linear regression result is included in each chart. Ideally, all datapoints should be on a straight line to exhibit perfect linearity. These charts can be used to identify any out-of-order color shades.
Figure 5.
Preservation of the patch order in lightness/hue/chroma—linearity. The top two charts show the patch order in lightness for gray patches (#19–#24) and chromatic patches (#1–#18). The lower left chart shows the chromatic patches in the hue order, and the lower right in the chroma order.
If perfect linearity cannot be achieved, monotonicity should be preserved. Figure 6 shows the one-dimensional views of the patch order in lightness, chroma, and hue. The Kendall Tau-a rank correlation coefficients are calculated to quantitatively represent the concordance of the patch order. These charts can be used to identify any out-of-order color shades that may not be visually discerned clearly.
Figure 6.
Preservation of the patch order in lightness/hue/chroma—monotonicity. The charts show the patch order in lightness, chroma, and hue. In each chart, the top row is the reference, the bottom row is the device output, and each yellow line connects the same patch. The top chart shows the patch order in lightness for gray patches (#19–#24). The remaining three charts show the chromatic patches in the lightness, hue, and chroma order. Use these charts to identify any out-of-order patches.
3.
Implementation
The color performance review (CPR) tool was developed in Matlab to analyze color performance of an endoscopy device. The user provides two sets of measurement data for the ground truth and the device output.
3.1
User Interface
As shown in Figure 7, the CPR tool provides a user interface of three sections for the user to interact.
Figure 7.
User interface of the CPR tool. (a) In the Input section, the user chose the ColorChecker target and provided the reference data in CIELAB in “LAB24Reference.txt” and the device output data in CIEXYZ in “XYZ24Device.txt”. (b) In the Convert section, the app listed the users reference data and device output data in the upper left and upper right quardarnts, respectively. The app then converted the users data into CIELAB and listed them in the lower left and lower right quardarnts. The upper left and lower left quadrants show the same data because the users reference data were already in CIELAB. For each table, the corresponding charts were plotted and placed next to each other for visual comparison. (c) In the Output section, the user entered 4 labels that will be included in the report file “one_pager.png.”
In the Input section, the user enters the following data:
The test target: the supported test targets are the 24-patch ColorChecker, 30-patch ColorGauge, and 42-patch RezChecker.
The color space for the ground truth and the device output: the supported color spaces are CIELAB, CIEXYZ, and sRGB.
The data form: the user can choose to either use a text file or copy-and-paste the measurement data.
The data content: the user enters the file name or conducts a copy-and-paste action on the measurement data arranged as a table.
In the Convert section, the CPR tool utilizes four quadrants to facilitate the user’s verification of the measurement data. The left and right quadrants present the input data for the reference and device output, respectively. The top quadrants display the original input data, while the bottom quadrants exhibit the converted data in CIELAB. Each quadrant includes a table presenting the measurement data and a chart reconstructing the test target. To ensure the integrity of the input data, users can perform numerical verification using the tables and visual verification using the charts as a sanity check.
In the Output section, the user enters a file name for the CPR tool to generate the analysis report. The user can optionally enter four labels to identify the device under test.
3.2
Test Report
Figure 8 shows a sample test report generated by the CPR tool. The report contains three columns of plots.
Figure 8.
Test report generated by the CPR tool. See Section 3.2 Test Report for details.
3.2.1
Visual Verification and Absolute Color Error
The left column contains eight plots for visual verification (Figs. 8(a1)–(a6)) and absolute color errors (Figs. 8(a7),(a8)).
Fig. 8(a2) shows the original color target with each patch numbered. The image is generated based on digital data provided by the target manufacturers that are usually obtained under uniform illumination. It can be used to confirm that the testing data were entered in the correct order.
Figs. 8(a3) and (a4) show the color target based on the converted CIELAB data for the reference and reproduced data, respectively. These images can be viewed on a well-calibrated display to visually assess how the endoscopy device would reproduce the color target and observe the differences.
Since the reference data were measured and provided by the user, the user can verify whether the reference target and the original target appear the same by comparing the original target (Fig. 8(a2)) with the reference target (Fig. 8(a3)). Any obvious difference may suggest discrepancies in the test target, lighting, or measurement process. For example, the original target in Fig. 8(a2) is usually measured under uniform illumination and may differ from the reference target in Fig. 8(a3) if the endoscope does not produce a uniform illumination pattern.
By comparing Figs. 8(a2) and 8(a4), the user can observe the differences between the uniformly illuminated color target and the reproduced color target.
If the reproduced data were provided in the CIEXYZ color space (i.e., tristimulus), an optional Fig. 8(a1) shows the color target by using CIE D65 as the reference white. The purpose is to check any excessive color shift caused by the endoscope light source and/or the device.
In addition to the color target, the user can provide an endoscopic image (Fig. 8(a5)) for the tool to predict the device’s output (Fig. 8(a6)). The prediction is based on linear interpolation of the patches. The purpose is to provide a quick visual assessment of the color reproduction of a real scene.
Fig. 8(a7) is a bar chart showing the absolute color errors between the device output and the ground truth for each patch. The descriptive statistics (mean, standard deviation, minimum, median, and maximum) are also provided. The purpose is to evaluate how faithfully the device can reproduce the original color. Fig. 8(a8) is a boxplot showing the color differences calculated by using the ΔE00, ΔE94, and ΔE76 formulas.
3.2.2
Preservation of the Patch Order in Lightness, Hue, and Chroma
The center column contains eight plots for evaluating the linearity (Figs. 8(b1)–(b4)) and order (Figs. 8(b5)–(b8)) in lightness, hue, and chroma.
Figs. 8(b1) and 8(b5) show lightness order of the gray patches.
Figs. 8(b2) and 8(b6) show lightness order of the chromatic patches.
Figs. 8(b3) and 8(b7) show hue order of the chromatic patches.
Figs. 8(b4) and 8(b8) show chroma order of the chromatic patches.
3.2.3
Color Transfer and CCE
The right column contains eight plots (Figs. 8(c1)–(c8)) for the color transfer and CCE.
Figs. 8(c1)–(c6) allow the user to visually examine the three-dimensional color transfer as vectors in the CIELAB color space. For each color patch i, a vector from truthi (circle) to devicei (cross) indicates how the color was reproduced by the device. The length of the vector indicates the color difference (ΔE76). A longer vector indicates a larger error from the ground truth. The direction of the vector indicates how the color was shifted in the CIELAB color space. For example, for a device intended to increase the color contrast between hemoglobin and oxyhemoglobin, the two corresponding vectors may point in opposite directions.
Fig. 8(c7) is a scatter plot showing the relationship between the input ΔE, output ΔE, and CCE. Fig. 8(c8) is a box plot showing the CCE distributions using the ΔE00, ΔE94, and ΔE76 formulas.
4.
Case Study
Figure 9 shows the CPR test report of an inadequate endoscope. The input is CIELAB data from the 30-patch ColorGauge color target. From the left column, since the original test target and the reference test target are the same, the user did not measure the test target but used the data provided by the test target manufacturer. By comparing the reference and reproduced targets, it shows that the color contrast is reduced, the gray shades shift to pink, and the four brightest gray shades are not discernible. By comparing the original and reproduced endoscopic images, the device increases the image brightness but decreases the color contrast so that the blood vessels are less apparent. The average color difference of the 24 color patches is 20 ΔE, while the maximum color difference is greater than 40 ΔE. From the center column, the lightness of most gray and chromatic patches are above the identity line, which confirms the increased brightness and agrees with the “Lightness gray” plot in the right column. The slopes of the linear regression for the gray and chromatic patches are 0.70 and 0.42, respectively, which confirms the reduced contrast in lightness. Three of the 12 gray patches are out of order in lightness, which confirms the poorly exhibited grayscale ramp. The red shift (i.e., increased CIE a) of the gray patches is confirmed by the “Chromatic gray” plot in the right column. Although the hue values of most chromatic patches are in order, the chroma values are decreased, which confirms the reduced contrast in chromaticity and agrees with the “Hue Chroma” plot in the right column. Finally, the observed color contrast reduction is confirmed by the CCE value of 0.76.
Figure 9.
CPR test report of an inadequate endoscope. See Section 4 Case Study for details.
5.
Discussion
The CPR tool deals with data analysis only and is reliant on correctly measured ground truth. The ground truth of the test target should be obtained at the acquisition stage under the same illumination conditions.
The device under test is presumed to have a deterministic, global color transformation. Some devices may apply local color enhancement to certain features (e.g., edges) or use different color transformation depending on the image content. In those cases, the color performance cannot be characterized by regular bench testing methods.
As shown in Fig. 8(c8), the CCE value of the same device may vary depending on whether the ΔE00, ΔE94, or ΔE76 formulas are used. For future work, more devices should be tested to investigate whether different ΔE00 formulas could generate inconsistent conclusions about the relative color performance between two devices. In addition, psychophysical studies should be conducted to investigate the correlation between the color contrast perceived by human users and the color contrast predicated by the CCE metric.
6.
Conclusion
The color performance review tool for endoscopy devices is intended for analyzing color performance measurement data to quantitatively evaluate the color performance of an endoscopy device. The tool converts acquired, raw color performance measurement data into the human perceptual domain such that color performance concerns can be readily identified. Intended users are device developers and testing labs intending to analyze the color performance testing data of their devices. The software can also be used to compare different devices for regulatory purposes. The software is available in the catalog of Regulatory Science Tools published by FDA/CDRH/OSEL.
Acknowledgment
The mention of commercial products, their sources, or their use in connection with material reported herein is not to be construed as either an actual or implied endorsement of such products by the Department of Health and Human Services. This is a contribution of the U.S. Food and Drug Administration and is not subject to copyright.
The author thanks Andrew Fales, Eshan Dahal, Andreu Badal-Soler, and the anynomous reviewers for reviewing the software and the manuscript. The author thanks the members of the Color Performance Review team, Ryan Beams, Paul Lemaillet, Andreu Badal-Soler, Andrea Kim, Eshan Dahal, Andrew Fales, and Quanzeng Wang, for their work on endoscopy device review.
References
1OgilvieJ.HicksL. M.KallooA.Johns Hopkins Manual of Gastrointestinal Endoscopic Procedures2008SLACK IncorporatedThorofare, NJ
2IddanG.MeronG.GlukhovskyA.SwainP.2000Wireless capsule endoscopyNature405417417417–10.1038/35013140(in English)
3FisherM.MackiewiczM.2013Colour image analysis of wireless capsule endoscopy video: A reviewColor Medical Image Analysis129144129–44SpringerDordrecht
4AshourA. S.DeyN.MohamedW. S.TrompJ. G.SherrattR. S.ShiF.MoraruL.2020Colored video analysis in wireless capsule endoscopy: a survey of state-of-the-artCurr. Med. Imaging16107410841074–8410.2174/1573405616666200124140915
5ThanT. D.AliciG.ZhouH.LiW.2012A review of localization systems for robotic endoscopic capsulesIEEE Trans. Biomed. Eng.59238723992387–9910.1109/TBME.2012.2201715
6DohiO.YagiN.OnozawaY.Kimura-TsuchiyaR.MajimaA.KitaichiT.HoriiY.SuzukiK.TomieA.OkayamaT.YoshidaN.2016Linked color imaging improves endoscopic diagnosis of active Helicobacter pylori infectionJ. Gastroenterol. Hepatol.31281281281–10.1111/jgh.13114
7KanzakiH.TakenakaR.KawaharaY.KawaiD.ObayashiY.BabaY.SakaeH.GotodaT.KonoY.MiuraK.IwamuroM.2017Linked color imaging (LCI), a novel image-enhanced endoscopy technology, emphasizes the color of early gastric cancerEndoscopy Int. Open5E1005E1013E1005–1310.1055/s-0043-117881
8De GroenP. C.2017History of the endoscope [scanning our past]Proc. IEEE105198719951987–9510.1109/JPROC.2017.2742858
9EdmonsonJ. M.1991History of the instruments for gastrointestinal endoscopyGastrointest. Endosc.37S27S56S27–5610.1016/S0016-5107(91)70910-3
10ClassenM.PhillipJ.1984Electronic endoscopy of the gastrointestinal tractEndoscopy16161916–910.1055/s-2007-1018518
11ClassenM.KnyrimK.SeidlitzH.HagenmüllerF.1987Electronic endoscopy—the latest technologyEndoscopy19118123118–2310.1055/s-2007-1018255
12KnyrimK.SeidlitzH.HagenmüllerF.ClassenM.1987Color performance of video endoscopes: quantitative measurement of color reproductionEndoscopy19233236233–610.1055/s-2007-1018290
13KnyrimK.SeidlitzH.HagenmüllerF.ClassenM.1987Video-endoscopes in comparison with fiberscopes: quantitative measurement of optical resolutionEndoscopy19156159156–910.1055/s-2007-1018268
14VakilN.KnyrimK.EverbachE. C.1991The appreciation of colour in endoscopyBaillière’s Clin. Gastroenterol.5183194183–9410.1016/0950-3528(91)90011-O
15TaylorJ. M.PiccianoL. D.1994Color imaging in endoscopy perspectives and new directionsProc. IS&T/SID CIC2: Second Color Imaging Conf.196199196–9Springfield, VA
16ConstantinouI.NeofytouM.TanosV.PattichisM.ChristodoulouC.PattichisC.2013A comparison of color correction algorithms for endoscopic camerasIEEE 13th Int’l. Conf. Bioinformatics and Bioengineering (BIBE)IEEEPiscataway, NJ10.1109/BIBE.2013.6701631
17KamarudinN. D.RusliM. S.YeeO. C.MansoorS. B. R. S.AzahariA. M.ZainolZ.Abd GhaniK.MakhtarS. N.2018Performance comparison of colour correction and colour grading algorithm for medical imaging applicationsInt. J. Eng. Technol.7353356353–6
18GeleijnseG.HakkesteegtM.de GrootJ.MetselaarR.2021Measuring image quality of ENT chip-on-tip endoscopesJ. Imaging Sci. Technol.6520503-120503-720503-1–710.2352/J.ImagingSci.Technol.2021.65.2.020503
19GeleijnseG.VederL.HakkesteegtM.MetselaarR.“The objective measurement and subjective perception of flexible ENT endoscopes image quality”, J. Imaging Sci. Technol. 66, 1–6 (2022)
20IEC 61966-2-1: Multimedia Systems and Equipment-Colour Measurement and Management—Part 2-1: Colour Management-Default RGB Colour Space-sRGB1999International Electrotechnical CommissionGeneva, Switzerland
21Adobe Systems Incorporated Corporate Headquarters, “Adobe RGB (1998) Color Image Encoding,” San Jose, CA, 2005
22Digital Cinema Initiatives, “Digital Cinema System Specification V1.0,” Hollywood, CA, 2005