Back to articles
Work Presented at CIC31: Color and Imaging 2023
Volume: 67 | Article ID: 050404
Image
Visualizing Perceptual Differences in White Color Constancy
  DOI :  10.2352/J.ImagingSci.Technol.2023.67.5.050404  Published OnlineSeptember 2023
Abstract
Abstract

Algorithms for computational color constancy are usually compared in terms of the angular error between ground truth and estimated illuminant. Despite its wide adoption, there exists no well-defined consensus on acceptability and/or noticeability thresholds in angular errors. One of the main reasons for this lack of consensus is that angular error weighs all hues equally by performing the comparison in a non-perceptual color space, whereas the sensitivity of the human visual system is known to vary depending on the chromaticity. We therefore propose a visualization strategy that presents simultaneously the angular error (preserved due to its wide adoption in the field), and a perceptual error (to convey information about its actual perceived impact). This is achieved by exploiting the angle-retaining chromaticity diagram, which shows errors in chromaticities while encoding RGB angular distances as 2D Euclidean distances, and by embedding contour lines of perceptual color differences at standard predefined thresholds. Example applications are shown for different color constancy methods on two imaging devices.

Subject Areas :
Views 114
Downloads 44
 articleview.views 114
 articleview.downloads 44
  Cite this article 

Marco Buzzelli, "Visualizing Perceptual Differences in White Color Constancyin Journal of Imaging Science and Technology,  2023,  pp 1 - 6,  https://doi.org/10.2352/J.ImagingSci.Technol.2023.67.5.050404

 Copy citation
  Copyright statement 
Copyright © Society for Imaging Science and Technology 2023
 Open access
  Article timeline 
  • received May 2023
  • accepted August 2023
  • PublishedSeptember 2023
jist
JIMTE6
Journal of Imaging Science and Technology
J. Imaging Sci. Technol.
1062-3701
1943-3522
Society for Imaging Science and Technology
1.
Introduction
Human color constancy has been defined as the ability to recognize the colors of objects independent of the characteristics of the light source [1]. Computational color constancy, hereafter referred to as “color constancy” for brevity, is a technique developed in digital imaging to emulate the process of human color constancy within the context of digital sensors. Its implementation in consumer devices is often referred to as “Automatic White Balance”, in contrast to “Manual White Balance” where the user is in charge of removing (or changing) the color cast from the acquired image.
Color constancy is typically addressed as a two-stage process, with illuminant estimation followed by illuminant correction. The first stage aims at characterizing the illuminant source, and it is the main focus of most algorithms for color constancy. The second stage employs a mechanism for chromatic adaptation to correct the image. The most common and simple solution for illuminant correction consists in applying to tristimulus data a diagonal transformation matrix, referred to as a “wrong von Kries transform” [2]. Color constancy is commonly evaluated in terms of angular errors [35]. The recovery angular error [4] treats the ground truth illuminant and the estimated illuminant as vectors in RGB space, and measures the angle between such vectors, thus comparing only the chromaticities and ignoring their absolute intensities. The reproduction angular error [5] simulates the effect of a possibly-wrong estimation on the correction of a neutral surface; the ground truth illuminant (representing the appearance of a neutral surface) is normalized by the estimation, applying a correction through a wrong von Kries transform. The resulting vector is then compared in terms of its angular distance with the vector of perfect white, defined by RGB = [1,1,1]. Despite the wide adoption of angular error metrics for the evaluation and comparison of color constancy algorithms, there exists no consensus about angular thresholds for acceptability and noticeability. After informal experiments first conducted in 2005, Finlayson et al. [6] considered a 1 perturbation of the image illuminant in any given color direction as not visibly noticeable, while a 3 perturbation was found to be noticeable but “generally acceptable”, as later supported by Fredembach et al. [7] and adopted as a threshold in the comparison of color constancy methods [8]. A 5 perturbation was defined as “generally acceptable, but unacceptable for some images”, thus manifesting the impossibility to assign a unique threshold for acceptability, even within the same experiment. Similarly, in 2006, Hordley [9] conducted another informal analysis, suggesting an angular error of 2 to be acceptable for color constancy. Rather than proposing an absolute threshold, Gijsenij et al. [10, 11] addressed the concept of noticeability in relative terms, determining that the difference in terms of angular error between two methods should be at least 0.06 times the maximum of the two errors, in order for it to be noticeable. This idea was later adopted for method comparison to determine the significance of angular error differences [12]. Gijsenij et al. [10, 11] also conducted a broader analysis of alternative metrics for error evaluation of color constancy, proposing a weighted Euclidean distance, and a corresponding coefficient for the threshold of relative noticeability. Other authors also considered alternative metrics and domains for the definition of color thresholds. Hordley [9] reported a CIELab error of 1 as a just noticeable threshold for two colors viewed side by side in isolation, and a CIELab error of 6 as an acceptable threshold for the assessment of complex scenes.
An intrinsic limitation of defining acceptability and noticeability in RGB space is that such representation is not perceptually uniform, whether it is assumed to be sRGB or a device-specific raw-RGB. A possible solution to the problem lies in measuring the error through perceptual difference metrics, such as the CIE76 ΔEab [13], based on the Euclidean distance between two colors in CIELab color space. One advantage of this solution is the availability of de facto standard thresholds, such as the JND (Just Noticeable Difference) set to 2.3, or the acceptability in complex scenes defined by Hordley to be 6. This approach has, however, two main drawbacks: first, it ignores the reality that the majority of methods comparison in the domain of color constancy is, in fact, performed with angular error metrics, thus raising a retro-compatibility issue. Secondly, any single-value metric will, by definition, remove any information about the chromaticity of the estimation error, thus depriving of an important clue for the analysis of a method’s faults (this limit is shared with the traditional angular error). Furthermore, there exists a disagreement between acceptability thresholds defined in angular error and ΔEab, as manifest in Figure 1: here, three example corrections from the fully convolutional color constancy with confidence-weighted pooling (FC4) method [14] are visualized, together with the corresponding recovery angular error (always under 2, considered acceptable), and the corresponding ΔEab (always above 6, considered unacceptable).
Figure 1.
Sample corrections from FC4 [14]: recovery angular error is below the 2 acceptability threshold, but ΔEab is above the acceptability threshold of 6.
For these reasons, we propose a solution for the visualization of errors in the domain of color constancy, based on embedding contour lines of perceptual color differences at predefined thresholds into a chromaticity diagram that encodes RGB angular distances as 2-dimensional Euclidean distances, called Angle-Retaining Chromaticity (ARC) [15, 16]. First, using a chromaticity diagram enables the visualization of errors’ chromaticities, thus providing an intrinsically richer representation of the errors. Secondly, with this configuration, the errors can be visualized both in terms of the commonly used angular error (represented by the Euclidean distance in 2D space) and in terms of the more informative CIE76 ΔEab (with thresholds represented by contour lines).
2.
Background on Color Error Representation
Let G = {gR, gG, gB} be a ground truth illuminant in device-specific raw-RGB, and let E = {eR, eG, eB} be an estimated illuminant in the same color space. The angular distance between illuminants G and E is the recovery angular error [4]. Alternatively, the reproduction angular error [5] is obtained through the reproduction vector R:
(1)
R=GE=gReR,gGeG,gBeB.
The angular distance between the reproduction vector R and a neutral surface W = {1,1,1} is, by definition, the reproduction angular error.
The ARC diagram [15, 16] is a general-purpose 2D representation of color information, which may be obtained from any given RGB vector {ρR, ρG, ρB} as follows:
(2)
αA=arctan23ρGρB,2ρRρGρB
(3)
αR=arccos ρR+ρG+ρB3ρR2+ρG2+ρB2
(4)
αZ=ρR2+ρG2+ρB2.
Alternatively, the polar chromaticity coordinates {αA, αR} may be represented in Cartesian form {αX, αY } for visualization purposes. When converting a reproduction vector R into ARC, each pair of ground truth and estimated illuminants becomes a single two-dimensional point, whose Euclidean distance from the diagram center corresponds exactly to the reproduction error.
3.
Proposed Methodology for Visualization
Our goal is to assign a perceptual error to every point in the ARC diagram and to eventually visualize this information with contour lines. Such error is always computed between the reproduction vector R and the white vector W, in line with the computation of the reproduction angular error. This strategy entails a reduction of dimensionality that enables data visualization since displaying perceptual errors for all possible illuminant pairs would not be possible. As each illuminant is represented by at least two chromaticity coordinates, in fact, this would lead to four independent variables and one dependent variable (the error value). By contrast, the advantage of always referencing a single point for comparison (W) is that the only independent variable is the two-dimensional ratio vector in chromaticity, thus allowing for error visualization.
Let the coordinate system of the reproduction vector R be called “reproduction-RGB”, which differs from raw-RGB as explained in the following. The procedure used to compute the perceptual error for R is delineated here, which starts by bringing the reproduction vector back into raw-RGB color space.
3.1
Color Space Conversion: Reproduction-RGB to raw-RGB
When the reproduction vector R is computed according to (Eq. (1)), it is brought outside of the original raw-RGB space. This can be shown by observing that, for example, the white point W = {1,1,1} in this RGB space will not be rendered as white using the camera-specific raw-to-CIELab transformation. The necessary conversion is therefore one that first transforms, in our example, the reproduction-RGB W into a raw-RGB that would, in turn, render as a white CIELab. Adhering to the von-Kries-like model that underlies the reproduction error metric, we achieve this goal by multiplying R by a vector D, which simulates the application of an illuminant to a surface. Vector D is computed as:
(5)
D=xyz2raw (lab 2xyz([100,0,0])),
where lab2xyz(⋅) is a standard transformation, and xyz2raw(⋅) is a device-specific transformation matrix.
3.2
Color Space Conversion: Raw-RGB to XYZ
The conversion from raw to XYZ is obtained with a transformation matrix that is specific for the individual camera. This implies that every device will produce its own device-specific set of contour lines.
3.3
Y Normalization
The XYZ-encoded reproduction vector is normalized (i.e. divided) by its Y component, to discard the intensity information. Color constancy is, in fact, traditionally evaluated by ignoring intensity, to the extent that some algorithm implementations directly produce normalized RGB estimations.
3.4
Color Space Conversion: Normalized XYZ to CIELab
The final transformation uses a standard conversion from XYZ to CIELab, assuming D65 as the reference white. The rationale is that we are observing a picture in which the illuminant has been corrected using a given estimation, and our observation of the corrected picture takes place under D65.
Once the reproduction vector R is converted into CIELab, the same procedure is applied to the white RGB vector W = {1,1,1}, and the ΔEab distance is computed between the two. This operation is repeated for all points in the chromaticity diagram, thus producing a dense map of perceptual distances, which can be visualized as overlaid contour lines.
4.
Resulting Visualizations
In this section, we apply the proposed visualization to images from the ColorChecker dataset [17]. This dataset is composed of 86 images acquired with a Canon EOS-1DS camera, and 482 images acquired with a Canon EOS 5D camera. Every image includes a Macbeth ColorChecker target within the scene. From this, the brightest of the six achromatic patches with no oversaturated channels is used to determine the ground truth illuminant for the color constancy task, following Hemrit et al. [18]. For both devices in the dataset, we reference the corresponding model-specific raw-to-XYZ transformation matrices from the DCRAW software (https://www.dechifro.org/dcraw/.), since no calibration data is available and all images include a color target for device-specific illuminant annotation, no absolute reference is provided, thus preventing the definition of a proper color profile.
Table I.
Summary statistics (mean and 99th percentile) of analyzed color constancy methods on the two carmeras of the ColorChecker dataset [17, 18]. Pearson correlation between angular errors and ΔEab is also reported.
CameraMethodRec. Err. ()Rep. Err ()ΔEabPearson corr.
Mean99th p.Mean99th p.Mean99th p.Rec./ΔERep./ΔE
Canon EOS-1DsGE2 [19]3.75414.6684.46416.72911.28040.1030.97430.9533
QU [20]3.64413.5174.49618.07810.43939.8520.98580.9796
FC4 [14]2.3328.3562.9019.8717.13623.5670.97630.9580
Canon EOS-5DGE2 [19]4.12714.3105.24218.22711.93441.4260.97880.9623
QU [20]2.85313.9153.67818.3248.25738.0070.98160.9570
FC4 [14]1.8498.7732.39612.2415.54323.6790.98640.9620
We compare estimations from three methods for computational color constancy, selected as representatives of different categories; the second-order Grey Edge (GE2) in its implementation by van de Weijer et al. [19] as an instance of a statistics-based algorithm, Quasi-Unsupervised color constancy (QU) by Bianco et al. [20] as an instance of semi-supervised machine learning, and FC4 by Hu et al. [14] as an instance of fully-supervised machine learning. The learning-based methods QU and FC4 are designed for full white balancing, i.e. they are trained to identify neutral regions in the scene, and to consequently correct the image so that these regions are rendered as gray. GE, on the other hand, is purely an illuminant estimation method, with no assumptions on how to perform the final correction. Additionally, we note that this selection of methods is to be intended as a use case for the general application of our visualization methodology to any single-illuminant algorithm for the color constancy of white. The relationship between angular errors and ΔEab, visually presented in Fig. 1, is synthesized in Table I. For all combinations of cameras and methods, we report aggregate error statistics as well as the correlation between angular error (recovery or reproduction) and ΔEab. This incomplete correlation is later explored thanks to our visualization.
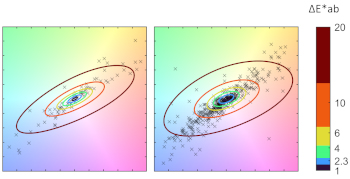
Our proposed visualization is presented in the chromaticity diagrams of Figure 2. Here, Euclidean distances from the center correspond to the reproduction angular error expressed in degrees and can be visually judged from the diagram’s own frame of reference. The rendered ΔEab contour lines visually highlight how the sensitivity of the human visual system is not fully correlated to the absolute angular error, depending instead on the hue of the error itself. Specifically, errors distributed on the correlated color temperatures of a black body radiator, moving from blue to yellow/red, are less perceivable than errors distributed on the orthogonal axis, moving from green to magenta. Both cameras from the ColorChecker dataset lead to similar conclusions, although a difference in sensitivity on the green-magenta axis can be clearly observed. Every cross (×) in the diagram is a reproduction vector computed according to Eq. (1) using the single gray-patch-based ground truth for a given image, and the corresponding illuminant estimation obtained from a given method. The three analyzed methods produce errors distributed in different regions of the chromaticity diagram, with GE2 and QU exhibiting a stronger bias towards blue overcorrections, and FC4 towards yellow overcorrections. In general, they all display an error distribution that roughly follows the blue to yellow/red axis of a black body radiator. While this may be expected of data-driven methods such as QU and FC4, which tend to inherit the bias of their corresponding training datasets, it is a surprising result for the data-free GE2 method. A possible explanation lies in the inherent limitation of annotating a single illuminant in what is actually a multiple-illuminant scenario [21] due, for example, to mutual surface inter-reflections or the coexistence of sun and shadow areas. In this case, the chromaticity of the error is potentially revealing non-annotated illuminant information. This interpretation could be further tested by extending the evaluation to images acquired under non-blackbody illuminants, a feature that is known to be lacking from many of the existing datasets for color constancy [3].
Figure 2.
Visualization of color constancy errors for three methods (GE2, QU, FC4) on two cameras of the ColorChecker dataset. Crosses represent reproduction errors based on single-patch ground truth data. Contour lines represent ΔEab thresholds at steps indicated in the color bars. The dimensionless axes of the ARC diagram represent RGB angular distances as two-dimensional Euclidean distances.
5.
Conclusions and Future Works
We have presented a visualization technique for color constancy errors that visualizes, at the same time, the traditionally-used angular error, its chromaticity, and its perceivability. Our visualization has been applied to three color constancy methods with different levels of complexity and accuracy, on two cameras of the popular ColorChecker dataset, providing a broad overview of its applicability. For future development, we consider expanding this analysis to a wider range of methods, datasets, and perceptual metrics. An inherent difficulty in assigning a perceivability score to color constancy errors derives from the necessity to evaluate the whole image in context, as opposed to only comparing colors “in a void”, which poses an additional challenge in terms of data visualization.
Acknowledgment
This work was partially supported by the MUR under the grant “Dipartimenti di Eccellenza 2023–2027” of the Department of Informatics, Systems and Communication of the University of Milano-Bicocca, Italy. This work was partially funded under the National Recovery and Resilience Plan (NRRP), Mission 4 Component 2 Investment 1.3 - Call for tender No. 341 of 15 March 2022 of Italian Ministry of University and Research funded by the European Union – NextGenerationEU; Award Number: Project code PE00000003, Concession Decree No. 1550 of 11 October 2022 adopted by the Italian Ministry of University and Research, CUP D93C22000890001, Project title “ON Foods - Research and innovation network on food and nutrition Sustainability, Safety and Security – Working ON Foods”.
References
1BuzzelliM.van de WeijerJ.SchettiniR.2018Learning illuminant estimation from object recognition2018 25th IEEE Int’l. Conf. on Image Processing (ICIP)323432383234–8IEEEPiscataway, NJ10.1109/ICIP.2018.8451229
2von KriesJ.Theoretische studien über die umstimmung des sehorgans1902Festschrift der Albrecht-Ludwigs-Universität145158145–58
3BuzzelliM.ZiniS.BiancoS.CioccaG.SchettiniR.TchobanouM. K.2023Analysis of biases in automatic white balance datasets and methodsColor Res. Appl.48406240–6210.1002/col.22822
4HordleyS. D.FinlaysonG. D.2006Reevaluation of color constancy algorithm performanceJ. Opt. Soc. Am. A23100810201008–2010.1364/JOSAA.23.001008
5FinlaysonG. D.ZakizadehR.2014Reproduction angular error: An improved performance metric for illuminant estimationPerception3101261–26
6FinlaysonG. D.HordleyS. D.MorovicP.2005Colour constancy using the chromagenic constraint2005 IEEE Computer Society Conf. on Computer Vision and Pattern Recognition (CVPR’05)1107910861079–86IEEEPiscataway, NJ10.1109/CVPR.2005.101
7FredembachC.FinlaysonG.2008The bright-chromagenic algorithm for illuminant estimationJ. Imaging Sci. Technol.52040906-110.2352/J.ImagingSci.Technol.(2008)52:4(040906)
8BiancoS.CusanoC.SchettiniR.2017Single and multiple illuminant estimation using convolutional neural networksIEEE Trans. Image Process.26434743624347–6210.1109/TIP.2017.2713044
9HordleyS. D.2006Scene illuminant estimation: past, present, and futureColor Res. Appl.31303314303–1410.1002/col.20226
10GijsenijA.GeversT.LucassenM. P.2008A perceptual comparison of distance measures for color constancy algorithmsComputer Vision–ECCV 2008: 10th European Conf. on Computer Vision, Marseille, France, October 12–18, 2008, Proc., Part I 10208221208–21SpringerCham10.1007/978-3-540-88682-2_17
11GijsenijA.GeversT.LucassenM. P.2009Perceptual analysis of distance measures for color constancy algorithmsJOSA A26224322562243–5610.1364/JOSAA.26.002243
12BiancoS.SchettiniR.2014Adaptive color constancy using facesIEEE Trans. Pattern Anal. Machine Intell.36150515181505–1810.1109/TPAMI.2013.2297710
13SharmaG.BalaR.Digital Color Imaging Handbook2017CRC PressBoca Raton, FL
14HuY.WangB.LinS.2017Fc4: Fully convolutional color constancy with confidence-weighted poolingProc. IEEE Conf. on Computer Vision and Pattern Recognition408540944085–94IEEEPiscataway, NJ10.1109/CVPR.2017.43
15BuzzelliM.BiancoS.SchettiniR.2020Arc: Angle-retaining chromaticity diagram for color constancy error analysisJOSA A37172117301721–3010.1364/JOSAA.398692
16BuzzelliM.2022Angle-retaining chromaticity and color space: Invariants and propertiesJ. Imaging823210.3390/jimaging8090232
17GehlerP. V.RotherC.BlakeA.MinkaT.SharpT.2008Bayesian color constancy revisitedin 2008 IEEE Conf. on Computer Vision and Pattern Recognition181–8IEEEPiscataway, NJ10.1109/CVPR.2008.4587765
18HemritG.FinlaysonG. D.GijsenijA.GehlerP.BiancoS.DrewM. S.FuntB.ShiL.2019Providing a single ground-truth for illuminant estimation for the colorchecker datasetIEEE Trans. Pattern Anal. Machine Intell.42128612871286–710.1109/TPAMI.2019.2919824
19Van De WeijerJ.GeversT.GijsenijA.2007Edge-based color constancyIEEE Trans. Image Process.16220722142207–1410.1109/TIP.2007.901808
20BiancoS.CusanoC.2019Quasi-unsupervised color constancyProc. IEEE/CVF Conf. on Computer Vision and Pattern Recognition122121222112212–21IEEEPiscataway, NJ10.1109/CVPR.2019.01249
21ChengD.KamelA.PriceB.CohenS.BrownM. S.2016Two illuminant estimation and user correction preferenceProc. IEEE Conf. on Computer Vision and Pattern Recognition469477469–77IEEEPiscataway, NJ10.1109/CVPR.2016.57