Back to articles
Work Presented at CIC31: Color and Imaging 2023
Volume: 67 | Article ID: 050401
Image
The Exploration of Specific Associations from Words to Colours
  DOI :  10.2352/J.ImagingSci.Technol.2023.67.5.050401  Published OnlineSeptember 2023
Abstract
Abstract

This study mainly focused on exploring the associations between words and colours. Colour association expresses a specific relationship between colour and various concepts or objects. However, it is noticed that when colour association is discussed, it is often in one direction; from colours to concepts. In this study, it is posited that colour association is bidirectional, meaning that we can also start with a word or concept and answer the question which colour or colours are associated with it. A psychophysical experiment was carried out to collect specific colour associations from target words. In the results, the strong similarity of the associated colours for each word was presented, meaning that people selected similar colours for each word. The study also indicated that different word classes have different degrees of association with colours. This study elucidates strong associations from words to colours, an important contribution of this work is to emphasise the direction word– >colour in terms of colour association.

Subject Areas :
Views 183
Downloads 83
 articleview.views 183
 articleview.downloads 83
  Cite this article 

Yun Chen, Jie Yang, Fan Zhang, Kaida Xiao, Stephen Westland, "The Exploration of Specific Associations from Words to Coloursin Journal of Imaging Science and Technology,  2023,  pp 1 - 9,  https://doi.org/10.2352/J.ImagingSci.Technol.2023.67.5.050401

 Copy citation
  Copyright statement 
Copyright © Society for Imaging Science and Technology 2023
 Open access
  Article timeline 
  • received April 2023
  • accepted June 2023
  • PublishedSeptember 2023
jist
JIMTE6
Journal of Imaging Science and Technology
J. Imaging Sci. Technol.
1062-3701
1943-3522
Society for Imaging Science and Technology
1.
Introduction
1.1
Colour Associations
It is established that strong associations exist between colours and concepts [1]. When we are reminded of a specific object, a certain substance, a person, a period or a region by the stimulation of colour, this is referred to as colour association [2]. The term ‘association’ refers to the presenting connection or cooperative link between someone or something [3]. Colour association expresses a specific relationship between colour and concepts or objects. Thus, the association is bidirectional including from colour to concept or concept to colour. In many previous studies, colours are associated with ideas, concepts, meanings, emotions and so on [4]. Many academic studies in the 20th century investigated these relationships [5] which have been occasionally expressed as colour emotions [68], sometimes expressed in terms of semiotics [9] or as colour meanings [10]. Dorcus [11] remarked that colour is often associated with specific objects. For instance, blue is associated with the sky, red is associated with ripe berries and fruits, and brown is associated with faeces and rotten fruit [1]. This concept is related to the associated idea of memory colours. The use of colours to symbolise ideas has been evident in art since the Renaissance, if not earlier [1, 12]. On the other hand, colour can also be associated with feelings [13]. Kaya and Epps (2004) [14] carried out a study to discuss the specific relationship between colours and emotion. Jonauskaite and his colleagues (2020) [15] pointed out the “Universal Patterns” of these associations by linguistic and geographic proximity. Besides, some early studies summarised few general relationships; it is considered that people associate blue with calming, depressing, peaceful, quiet, serious, and nostalgic [13]; associate yellow with serene, gay and softly exciting [13], or warm and sunny [16]; associate green with envy, red with passion, black with death, blue with loyalty etc. [17].
1.2
The Rationale for this Study
Most previous studies present participants with colour (this can be a visual representation or, in some cases, simply a colour name) and ask participants to grade the colour in some way [18]. For instance, in a study assessing colour-emotion pairings, the participants were asked to what extent they associated the colour with anger or happiness [19, 20]. Sometimes the rationale for such studies is to provide a tool for designers since such associations may be useful in the design process or advertising and marketing [21]. Without such a tool, designers may rely upon their subjective ideas or experience to find an appropriate colour scheme for a particular topic [2225]. However, many design processes begin with a design brief and it is here where concepts that define the intended design originate. In these situations, the designer seeks colours that can represent or communicate these concepts [26]. In other words, it is highly unlikely that a designer will think of a colour and then try to find to what extent that colour corresponds with a concept or idea; rather, the designer will start with several concepts or ideas that originate from the design brief and will want to know which colour or colours may be associated with these. Figure 1 shows the distinction between starting with a colour and trying to find the association of this colour with a word and starting with a word and trying to find which colour or colours are associated with that word. This research is concerned with the latter concept. We believe the distinction presented in Fig. 1 is important because it can better provide tools that are aligned with the design process.
Figure 1.
Diagram to show the colour→word and word→colour associations.
Thus, this work focused on exploring associations from words to colours. This work also develops a new methodology that was recently used [27] and can enable the practical approach of determining a colour palette that is associated with a particular word or concept. A psychophysical experiment is described in which specific target words (from different classifications of words) were presented to participants who were asked to select the colours that they associate with each word.
1.3
Research Objective and Questions
This study was mainly focused on exploring the associations from words to colours, one main research question and three sub-research questions are considered (see Table I). The research objectives are summarised according to the research questions:
To explore whether strong associations exist from words to colours;
To gather the associated colours from words and explore the features;
To identify whether obvious differences in associations exist for different types of words;
Table I.
Research questions for this study.
Main research questionSub-research questions
RQ: Are there strong associations from words to colours?RQ 1.1: Are there any significant corresponding relations from words to colours?
RQ1.2: What are the characteristics of associations from different classes of words to colours?
2.
Method
A psychophysical experiment was conducted to collect the associations from target words to colours. Several studies have previously been carried out using psychophysical experiments to collect data about the colour meaning or colour emotions which are from colour to words. Ou et al. [68] published three papers about colour emotion research that described psychophysical experiments in which participants were shown sample colours and asked to select levels of emotional terms for each colour. In this study, similar psychophysical experiments were employed, but the problem is reversed; in those participants are shown a word and asked to select related colours for that word which is from word to colour. It is unlikely that there is a unique 1 to 1 relationship between words and colour. For example, one colour might be able to communicate several different meanings [28]. Thus, for each specific word, there may well be more than one related colour. In the experiments, therefore, participants were asked to choose three related colours for each word.
2.1
Target Words Selection
Assuming that colours are associated with words, is the association equally strong, for example, for nouns and adjectives? Do different types of words generally display stronger associations? To answer these questions, different types of words were employed. Volkova and colleagues [29] presented a colour meaning study that collected concepts from colour and remarked that nouns and adjectives are the main syntactic categories that affected their results. Therefore, in this study, different classes of words were considered.
There are many studies of word classification. Renouf and Sinclair [30] listed ‘noun’, ‘verb’, ‘adjective’, ‘adverb’, ‘pronouns’, ‘determiners’, ‘numeral’, ‘auxiliary’, ‘preposition’ and ‘conjunctions’ as the major word classes. The types ‘pronouns’, ‘determiners’, ‘numeral’, ‘auxiliary’, ‘preposition’ and ‘conjunctions’ could be classified as ‘function words’ [31]. Therefore, the sample words selected were ‘noun’, ‘verb’, ‘adjective’, ‘adverb’ and ‘function word’ (Figure 2). Besides, the ‘noun’ class of words is generally divided into two groups: ‘common noun’ and ‘proper noun’ [30]. Genetti [32] also suggested that nouns can be categorised into three groups: ‘concrete noun’, ‘abstract noun’ and ‘proper noun’ by their particular meanings. However, it is noted that ‘concrete noun’, and ‘abstract noun’ could correspond to ‘common noun’ and ‘proper noun’ in Renouf and Sinclair’s study. Taking this into account, the sample words contain ‘concrete noun’, ‘abstract noun’ and ‘proper noun’.
Figure 2.
The sample words description.
Therefore, in consideration of the motivation of participants and the experiment length, 70 target words were selected which consisted of 7 classes (10 words for each class): ‘concrete noun’, ‘abstract noun’, ‘proper noun’, ‘verb’, ‘adjective’, ‘adverb’ and ‘function word’. The 70 words chosen were amongst the most frequent words in each class from the word frequency websites (Table II).
Table II.
Sample words list.
CategoriesWordsCategoriesWordsCategoriesWordsCategoriesWords
Concrete nouns [1]CatAbstract nouns [2]AbilityProper nouns [3]LondonVerbs [4]Ask
DogConfidenceGoogleBuy
JewelleryFriendshipTomBecome
ShoesGoalMariaBegin
EyesLifeChinaCall
HandHopeBurberryCan
appleSkillSubwayCome
RiceSleepJuneFeel
CarLoveChristmasFind
StoneInformationMondayLook
Adjective [5]ActiveAdverbs [6]MoreFunction words [7]A
CleanStillThis
ColdActuallyIt
DeadProbablyTwo
FreshRecentlyAnd
HotUsuallyOr
NatureSuddenlyNo
RichBetterMy
SafeQuicklyAt
YoungSimplyAlthough
2.2
Participants
In previous psychophysical studies of colour meaning, sample sizes were typically around 30 participants [68]. Therefore, due to the actionability of the Laboratory experiment, a total of 30 participants were recruited in this study (14 females and 16 males; students or staff at the University of Leeds and of various nationalities), all aged above 18 (19–42, mean:33). Each participant’s colour vision was confirmed to be normal using Ishihara’s test. None of the participants was excluded as a result of the test, but people who knew that they have colour deficiencies might not have applied for this experiment because the research purpose was briefly explained to each participant when they were recruited.
2.3
Experimental Procedure
This experiment took place in the Experience Design Laboratory with controlled viewing conditions, lighting conditions and display technology. The display part of the design required the development of a GUI and this was done by writing MATLAB code for the experiment (Figure 3). Colour palettes were displayed on an LCD computer monitor (HP DreamColor LP2480zx—a 24-in. LCD Backlit Monitor) and uniform grey (L = 50) was used as the background. Before the experiment, the display was calibrated by GOG, the average value is between 1–1.3 when the testing sample is MCCC24. The words were presented one at a time (and in a different random order for each participant) on the computer monitor. There were three buttons below each word and by clicking each of them participants could select a colour from a colour picker tool. In order to restrict the experiment to a reasonable length (it took each participant approximately 60 minutes to complete) and to avoid participant fatigue a selection of 70 target words (10 words for each of 7 categories) (see Table II) was used.
Figure 3.
The GUI used in this experiment. Note that several colour picker tools were available on the bottom left part of the GUI and participants were free to select the tool that they felt more comfortable to use.
In total 6300 colours or RGB combinations (30 participants ×  70 words ×  3 colours) were selected by the participants; each of these was subsequently measured using a Konica Minolta CS-2000 spectroradiometer after the experiment. The spectroradiometer measured spectral radiance at each wavelength and these data were converted to CIELAB values (Regarding the display white point: CIE x = 0.3116, y = 0.3184) using standard methods [33], according to the conversion formula of radiation and photometric quantity, for the luminous flux of the standard lamp and the lamp to be tested, the relative spectral power distribution is calculated from the absolute spectral power distribution, and then the photoelectric parameters such as excellent coordinates, chromaticity tolerance, relevant colour temperature, colour rendering index, etc. are obtained by the same method as the spectral photometry.
2.4
Data Analysis Method
In this study, 30 participants were each asked to identify the colours that they associate with each specific word (70 sample words in total). As previously discussed, the similarity of selected colours for each word by different participants could be a measure of the strength of association from word to colour.
In particular, for each word, a colour palette of 90 colours (30 participants ×  3 colours) was collected (70 such colour palettes were collected in total). The colour similarity of each palette was analysed by visual analysis and data calculation. In terms of calculating the self-similarity of each 90-colour palette, each participant’s three-colour palette was compared to each of the other participant’s three-colour palettes (using a colour difference metric). To measure the colour difference within one colour palette; the colour difference between every two colours was calculated and then the mean of these colour differences was calculated. A similarity measurement method was employed which is the Pearson Correlation Coefficient method [34]. The similarity values of the words in different word classes were made a comparison in the end. The process flow in shown in (Figure 4).
Figure 4.
Data analysis process.
2.4.1
Pearson Correlation Coefficient (PCC)
A number of methods to calculate the colour difference between two single colours have been published. For example, the International Commission on Illumination (CIE) has expressed colour difference as distance metric Delta E in CIELAB colour space. The distance between two points in colour space that represent two colours represents the visual difference between the two colours [35] as shown in Eq. (1):
(1)
ΔEab=(ΔL)2+(Δa)2+(Δb)2.
To measure the self-similarity within a colour palette, a current study pointed out that applying the Pearson Correlation Coefficient method to Delta E (Eq. (1)), which is recommended in self-similarity colour difference measurement [34, 36]. It could present the colour difference value which is close to human visual difference. This method is used to measure the direction and the strength of the linear relationship between two variables which is the covariance of variables (x, y) divided by the product of the standard deviations, Eq. (2) (cov: covariance; σ: standard deviation):
(2)
Px,y=cov (x,y)σxσy=Exσxyσyσxσy.
The value of PCC is within − 1 and + 1, which is − 1 ≤  P ≥ +1:
If P < 0, two variables are positive correlated; if P > 0, two variables are negative correlated.
If |P| = 1, two variables have perfect linear correlations which are functional relations.
If P = 0, there is no linear correlation between the two variables.
When the absolute value of PCC is between 0 and 1, it means there is a correlation between the two variables. When |P| is closer to 1, the correlation is high and when |P| is closer to 0, the correlation is low. Correlation can be verbally described by its strength using the guide that Evans [36] suggested for the absolute value:
0 < P < 0.2 “very weak”
0.2 ≤ P < 0.4 “weak”
0.4 ≤ P < 0.6 “moderate”
0.6 ≤ P < 0.8 “strong”
0.8 ≤ P < 1 “very strong”
Therefore, the correlation value was calculated between each set of three colours in each colour palette for each word by PCC algorithms (using the CIELAB values). That is, in each colour palette, each three colour patches (which were selected by one participant) were compared to the other three colour patches respectively to calculate P. There are 30 participants in this study, this resulted in 435P values. These are averaged (ignoring the sign) to generate a value that represents the visual self-similarity between the 90 patches (30 participants ×  3 colour selections) for each word.
3.
Results and Analysis
First, it was noted during the experiment that participants selected related colours easily and quite quickly which suggests that they could easily find related colours for specific words; this, in itself, is some evidence that strong associations exist from words to colours. However, the data from the experiment were analysed by visual analysis and similarity measurement.
3.1
Visual Analysis
For each sample word, every participant selected three related colours so that 90 (3 colours × 30 observers) related colours were collected for each word and organised into 90-colour palettes (Figure 5).
Figure 5.
The visual presenting data for each word.
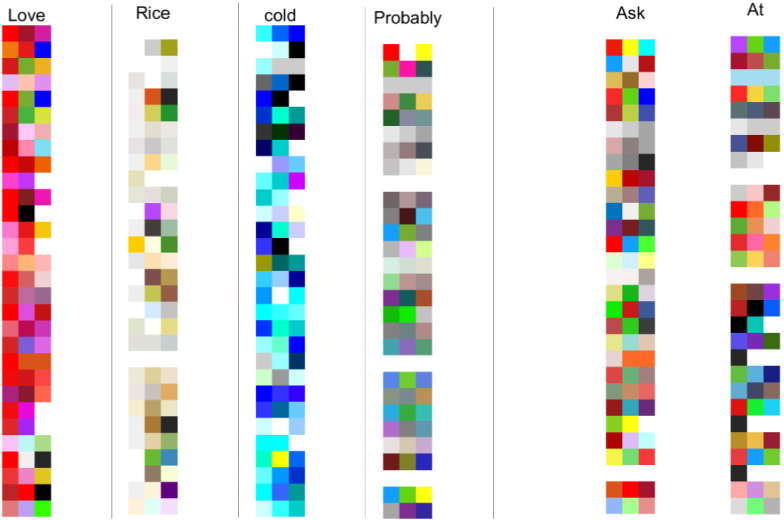
It is evident that there are systematic differences between the colours that were selected for each of the words, the colours that were selected are intuitively what one might expect. In many cases, a clear colour trend can be seen in the palettes which means some specific colours are closely and particularly associated with those words and it could be evidence of strong associations from those words to some specific colours. For instance, note the predominance of pink for ‘love’; the predominance of light colour for ‘rice’; the predominance of blue for ‘cold’; and compare these to the low saturation colours that are associated with ‘probably’. Even when the colours that were collected were less obviously intuitive (such as ‘ask’, ‘at’) there is evidence of some systematic relationship between word and colour (Figure 6).
Figure 6.
The predominance of pink for ‘love’; the predominance of light colour for ‘rice’; the predominance of blue for ‘cold’; the low saturation colours that are associated with ‘probably’. On the contrary, less obvious colour trend of ‘ask’ and ‘at’.
In addition, it can be seen that concrete nouns, proper nouns and adjectives perform better than other groups. Most of the words in these three groups presented evident colour trends. On the contrary, verbs and function words had a less obvious colour trend and the resulting choices were colourful. It could be considered that participants did not have clear related colours for these words and these words are weakly associated with colours.
3.2
Similarity Measurement
To analyse the characteristics of each palette in detail, the PCC value was used to measure the colour similarity in each colour palette for each sample word (Table III). The closer the PCC value to 1, the higher the correlation and closer the PCC value to 0, the lower the correlation.
Overall, it can be seen that the PCC value for most of the 70 words (70%) was above 0.6 and in some cases even reach 0.8 (‘rice’), which means the correlation level of most of the palettes are ‘strong’ or ‘very strong’. Only a few of them are below 0.6 but still above 0.5. Thus, for 70 sample words, the corresponding colour palette presented a strong similarity or an evident colour trend, it indicated that a strong association exists from these words to the colours.
Besides, a difference in the value was presented between different word classes. First, as Table III shows, the mean of the PCC value in each word class was provided. The mean of ‘adjectives’ shows the highest PCC values (0.701), and the mean of ‘concrete nouns’ is also high (0.690). Conversely, ‘function words’ show the lowest mean value (0.587) of the seven classes. The similarity of associated colours for ‘adjectives’ is higher than other word classes and ‘function words’ are the weakest word class in their association with colours.
Specifically, the statistical dispersion of every similarity data for each word was carried out to make a comparison between seven classes of sample words. The boxplot shows (Figure 7) the minimum, maximum and median of each similarity value for each word. The higher position and the smaller dispersion represented the larger similarity of the colours in each palette. Obviously, the words from ‘adjectives’ performed better than the other groups. Note, although some words (‘Hand’, ‘Rice’) show a strong similarity which is not from the ‘adjectives’ group, as a whole, ‘adjectives’ performed best and every word presents a strong similarity of ‘adjectives’.
Table III.
The similarity measure of sample words.
Concrete nounsPCC ValueAbstract nounsPCC ValueProper nounsPCC ValueVerbsPCC ValueAdjectivesPCC ValueAdverbsPCC ValueFunction wordsPCC Value
Cat0.65Ability0.60London0.64Ask0.61Active0.63More0.56A0.56
Dog0.71Confidence0.55Google0.68Buy0.56Clean0.79Still0.65This0.59
Jewellery0.63Friendship0.63Tom0.58Become0.61Cold0.74Actually0.54It0.65
Shoes0.62Goal0.57Maria0.60Begin0.63Dead0.74Probably0.68Two0.61
Eyes0.68Life0.62China0.66Call0.62Fresh0.76Recently0.59And0.59
Hand0.72Hope0.70Burberry0.63Can0.52Hot0.69Usually0.65Or0.60
apple0.73Skill0.55Subway0.70Come0.55Natural0.71Suddenly0.55No0.50
Rice0.80Sleep0.60June0.73Feel0.64Rich0.65Better0.61My0.57
Car0.63Love0.58Christmas0.72Find0.58Safe0.66Quickly0.58At0.56
Stone0.72Information0.64Monday0.58Look0.65Young0.64Simply0.62Although0.62
Mean:0.690 0.604 0.652 0.5980.701 0.601 0.587
The mean of ‘adjectives’ is the highest, ‘concrete noun’ is the second, ‘function words’ are the lowest.
*PCC: Statistical method- Pearson Correlation Coefficient.
Figure 7.
The dispersion of every similarity value for each word. The words which from ‘adjectives’ perform better than the other groups.
Overall, strong associations were evidenced from specific words to colours in this experiment. Generally, the associated colours for each word were highly self-similar., Participants selected similar colours for a word. This study also indicated that different word classes have different degrees of associations with colours. ‘Adjectives’ were considered to be the words most strongly associated with colours in this study. On the contrary, ‘function words’ showed the weakest associations with colours.
4.
Conclusions
The main purpose of this study was to explore whether strong associations exist from words to colours and to explore the characteristic of different types of words. This work identified and evidenced that strong associations exist from specific words to colours. A psychophysical experiment was carried out with 70 target words (from different classifications of words) and participants were asked to identify the colours that they associate with each word. The strong similarity of the associated colours for each word was presented, meaning that people selected similar colours for each word. The study also indicated that different word classes have different degrees of association with colours. Adjectives were found to have the strongest associations with colours in the experiment. On the other hand, verbs showed the weakest associations with colours.
This topic is interesting in itself but may have practical applications in the design field. Colour conveys multiple types of information and is widely used in Art and Design. The critical role of colour in design is widely accepted and colour selection is an important step or process that can affect whether a design is successful or not. The colour association plays an essential role in colour selection in design. It can help designers to create satisfying and useful colour schemes which meet the requirements from consumers, brands and aesthetics. It has long been established that strong associations exist between colours and concepts. The term ‘association’ refers to a connection or cooperative link between someone or something. Colour association expresses a specific relationship between colour and various concepts or objects. However, it can be seen that when colour association is discussed it is often in one direction; that is, from colours to concepts. However, in this study, it is argued that colour association is bidirectional meaning that we can also start with a word or concept and ask the question of which colour (or colours) are associated with it. An important contribution of this work is to emphasise the direction word– >colour in terms of colour association. We hope that this research may encourage more interest in colour association, especially the discussion about colour association from word to colour. We note that it is easier to develop a design tool if the word-to-colour association direction is used. An example of such a design tool is the speakingincolor app by Sherwin-Williams [37]. This app uses machine learning to derive a colour palette based on a word that the user types (or speaks). Advances in technology have led to increased use of machine learning to process data and such advances are quickly emerging in the area of colour. AkzoNobel is another company that has produced a webpage that allows a user to enter a word and produces a colour palette in response [38]. Hue Data is an example of a company that is processing huge amount of data that exists on the internet about colour to generate insights and trends about colour [39]. Similar apps, websites and services will likely emerge as technology evolves. An important contribution of this work is that it provides ground-truth data (and a methodology by which others could collect ground-truth data) with which the validity of some of these new services can be evaluated.
Future Work
This study introduced the existence of the relationship from words to colours at a macroscopic level and provides evidence of strong associations from words to colours. Although the associations from different types of words to colours were compared and discussed, the specific characteristics of the association from a word to colours are not included. Therefore, in the next step of the research, additional studies need to be conducted to provide more data to supplement and explore this problem and the association from word to colour will be discussed at a micro level, and specific characteristics will be analysed and summarised.
References
1GageJ.Colour and Meaning: Art, Science and Symbolism1999Thames and HudsonLondon
2KressG.Van LeeuwenT.2002Colour as a semiotic mode: Notes for a grammar of colourVis. Commun.1343368343–6810.1177/147035720200100306
3The Oxford English Dictionary [online]. Vis. Commun. (2015) Available from http://www.oed.com
4GrieveK. W.1991Traditional beliefs and colour perceptionPerceptual and Motor Skills72131913231319–2310.2466/pms.1991.72.3c.1319
5XinJ. H.ChengK. M.ChongT. F.SatoT.NakamuraT.KajiwaraK.HoshinoH.1998Quantifying colour emotion-what has been achievedRes. J. Textile and Apparel2465446–5410.1108/RJTA-02-01-1998-B005
6OuL.LuoM. R.WoodcockA.WrightA.2004cA study of colour emotion and colour preference. III. Colour preference modellingColor Res. Appl.29381389381–910.1002/col.20047
7OuL.LuoM. R.WoodcockA.WrightA.2004bA study of colour emotion and colour preference. II. Colour emotions for two-colour combinationsColor Res. Appl.29292298292–810.1002/col.20024
8OuL.LuoM. R.WoodcockA.WrightA.2004aA study of colour emotion and colour preference. I. Colour emotions for single coloursColor Res. Appl.29232240232–4010.1002/col.20010
9Kauppinen-RäisänenH.LuomalaH. T.2010Exploring consumers’ product-specific colour meaningsQualitative Market Research: An International Journal13287308287–30810.1108/13522751011053644
10WonS.WestlandS.2017Colour meaning in contextColor Res. Appl.42450459450–910.1002/col.22095
11DorcusR. M.1926Color preferences and color associationsPedagogical Seminary and J. Genetic Psychol.33399434399–43410.1080/08856559.1926.10532367
12T. Lamb and J. Bourriau (eds.) Colour: Art and Science (Cambridge University Press, Cambridge, UK, 1995), Vol. 7
13GoetheJ. W. V.EastlakeC. L.Theory of Colours2006DoverMineola, NY
14KayaN.EppsH. H.2004Relationship between color and emotion: A study of college studentsCollege Student J.38396406396–406
15JonauskaiteD.Abu-AkelA.DaelN.OberfeldD.Abdel-KhalekA. M.Al RasheedA. S.AntoniettiJ.-P.BogushevskayaV.ChamseddineA.ChkoniaE.CoronaV.Fonseca-PedreroE.GriberY. A.GrimshawG.HasanA. A.HavelkaJ.HirnsteinM.KarlssonB. S. A.LaurentE.MohrC.2020Universal patterns in color-emotion associations are further shaped by linguistic and geographic proximityPsychol. Sci.31124512601245–6010.1177/0956797620948810
16WierzbickaA.The meaning of colour terms and the universals of seeingSemantics: Primes and Universals1996287334287–334
17CaivanoJ. L.1998Color and semiotics: A two-way streetColor Res. Appl.23390401390–40110.1002/(SICI)1520-6378(199812)23:6<390::AID-COL7>3.0.CO;2-#
18HanadaM.2018Correspondence analysis of color–emotion associationsColor Res. Appl.43224237224–3710.1002/col.22171
19FugateJ. M. B.FrancoC. L.2019What color is your anger? Assessing color-emotion pairings in English speakersFrontiers in Psychology1171–1710.3389/fpsyg.2019.00206
20ShiraiM.SoshiT.2023Color features continuously represent negative and positive aspects of sadnessJ. Gen. Psychol.1509611996–11910.1080/00221309.2021.1922344
21AresG.DelizaR.2010Studying the influence of package shape and colour on consumer expectations of milk desserts using word association and conjoint analysisFood Quality and Preference21930937930–710.1016/j.foodqual.2010.03.006
22ChenY.YuL.WestlandS.CheungV.2021Investigation of designers’ colour selection processColor Res. Appl.46557565557–6510.1002/col.22631
23HsiaoS.-W.1995aA systematic method for color planning in product designColor Res. Appl.20191205191–20510.1002/col.5080200309
24HsiaoS.-W.1995bA systematic method for color planning in product designColor Res. Appl.20191205191–20510.1002/col.5080200309
25SmithG.WhitfieldT. W. A.2005Profiling the designer: A cognitive perspectiveThe Design Journal83143–1410.2752/146069205789331646
26WonS.WestlandS.2018Requirements capture for colour information for design professionalsColor Res. Appl.43387395387–9510.1002/col.22198
27ChenY.YangJ.PanQ.VazirianM.WestlandS.2020A method for exploring word-colour associationsColor Res. Appl.45859485–9410.1002/col.22434
28OsgoodC. E.SuciG. J.TannenbaumP. H.The Measurement of Meaning1957University of Illinois PressUrbana
29VolkovaS.DolanW. B.WilsonT.CLex: A lexicon for exploring color, concept and emotion associations in languageProc. 13th Conf. European Chapter of the Association for Computational Linguistics2012Vol. 9Association for Computational Linguistics306314306–14
30RenoufA.SinclairJ.1991Collocational frameworks in englishEnglish Corpus Linguistics128143128–43
31SelkirkE.McCarthyJ. J.The Prosodic Structure of Function WordsOptimality Theory in Phonology2004Blackwell Publishing Ltd.Oxford, UK10.1002/9780470756171.ch25[Accessed: 6 April 2020]
32GenettiC.How Languages Work: An Introduction to Language and Linguistics2018Cambridge University PressCambridge, UK
33WestlandS.RipamontiC.CheungV.Computational Colour Science Using MATLAB2012John Wiley & SonsHoboken, NJ
34RenS.ChenY.WestlandS.YuL.2021A comparative evaluation of similarity measurement algorithms within a colour paletteColor Res. Appl.46332340332–4010.1002/col.22591
35HuntR. W. G.PointerM. R.Measuring Colour2011John Wiley & SonsHoboken, NJ
36BenestyJ.ChenJ.HuangY.CohenI.Pearson correlation coefficientIn Noise Reduction in Speech Processing2009SpringerCham141–410.1007/978-3-642-00296-0_5
37https://speakingincolor.app/ (last accessed 28th September 2022)
38https://www.colourmyideas.com/about (last accessed 28th September 2022)
39https://www.hue-data.com/#!/ (last accessed 28th September 2022)