Back to articles
Papers Presented at CIC30: Color and Imaging 2022
Volume: 66 | Article ID: 050405
Image
SVBRDF Estimation Using a Normal Sorting Technique
  DOI :  10.2352/J.ImagingSci.Technol.2022.66.5.050405  Published OnlineSeptember 2022
Abstract
Abstract

Spatially varying bidirectional reflectance distribution functions (SVBRDFs) play an important role in appearance modeling of real-world surfaces. Automatic capture of these surface properties is highly desirable, but many techniques only partially capture these properties or use complicated setups to do so. Micro surface roughness variations are especially difficult to capture using image-based methods. In this paper, we propose a novel approach towards estimating the complete SVBRDFs of surfaces using a portable projector-camera system made of standard consumer-grade components. Our approach uses insights about the relations between the illumination and viewing geometry and captured image statistics to estimate surface reflectance properties. Our technique should be of great value to practitioners seeking to model and render the geometric and reflectance properties of complex real-world surfaces.

Subject Areas :
Views 50
Downloads 12
 articleview.views 50
 articleview.downloads 12
  Cite this article 

Snehal Padhye, David Messinger, James A. Ferwerda, "SVBRDF Estimation Using a Normal Sorting Techniquein Journal of Imaging Science and Technology,  2022,  pp 050405-1 - 050405-11,  https://doi.org/10.2352/J.ImagingSci.Technol.2022.66.5.050405

 Copy citation
  Copyright statement 
Copyright © 2022 Society for Imaging Science and Technology 2022
 Open access
  Article timeline 
  • received May 2022
  • accepted August 2022
  • PublishedSeptember 2022
jist
JIMTE6
Journal of Imaging Science and Technology
J. Imaging Sci. Technol.
1062-3701
1943-3522
Society for Imaging Science and Technology
1.
Introduction
Structured light techniques using projector-camera (procam) systems have been widely used for the 3D modeling of objects and have found application in computer vision, surgery, games, animation, manufacturing, and industrial automation [1, 2]. Often there is a need to capture not only the geometry but also the complex reflectance properties (spatially varying bi-directional reflectance functions (SVBRDFs)) of objects. Since structured light has already proven useful for topography capture [3], the motivation of this project is to develop techniques for enabling the capture of the SVBRDFs of surfaces using a structured light setup (Figure 1).
Figure 1.
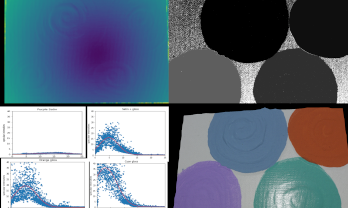
(a) Camera and projector system used to capture sequences of HDR images (b) used to estimate surface characteristics. At this stage fringe projection profilometry is used to estimate surface height and normal maps (c), (d). Cross polarization is used to separate the reflection components into diffuse and specular maps (e), (f). Next, the geometry of the imaging system (from calibration), and the normal map are used to estimate virtual normal orientations (g), and the diffuse map is used to segment the painting into different materials (h). Specular intensities for each of the materials are then sorted with respect to the virtual normals and fitted with Gaussians (i), to estimate the statistics of their specular lobes, which are then used to create a per-material roughness map (j). The final column (k) shows images of the painting rendered using the estimated height (H), normal (N), diffuse (D), specular (S), and roughness (R) maps.
Different parametric models have been used to represent BRDFs. One commonly used physically based model was developed by Ward [4] (Figure 2). The Ward model characterizes the BRDF of a surface into three components: diffuse reflectance, specular reflectance, and micro-scale roughness, which are typically represented as image-based maps. Procam-based structured light systems equipped with linear polarizers can be used to estimate the diffuse and specular components of the BRDF, however capturing the roughness component has been elusive because roughness estimation typically involves measuring surface reflection at multiple directions, which is not possible with a procam system.
Figure 2.
Ward model: The BRDF is represented as the sum of two components: A diffuse (albedo) component with magnitude given by ρd, and a Gaussian specular lobe with magnitude given by ρs and width given by α. Alpha is proportional to the microscale surface roughness.
In this paper, to address this problem, we describe a method to leverage the perspective geometry of the procam system, and the normal and specular maps of a surface produced by the system to estimate the microscale roughness component, leading to a system that can model both the complete geometric (topography) and material (SVBRDF) properties of complex surfaces.
2.
Background
Traditional image-based material capture [5, 6], involves complete sampling of the BRDF using cameras and hemispherical illumination environments. Ghosh et al. [7] showed that polarized second order spherical illumination can be used to estimate BRDFs with sparse samples. Alternatively, image based BRDF measurements can be done with planar lighting [8, 9] where an extended source is used to illuminate a surface from different angles and the sets of images captured can be used to estimate the BRDFs of a surface. These techniques create complete and accurate BRDF measurements, but they either require complex setups or are computationally expensive.
The need for more practical and lightweight setups led to methods that use commercially available hardware to capture surface BRDFs. Francken [10] used an LCD display to project multi-scale gray code patterns onto a target surface. The idea behind the approach is to find the scale at which the contrast of the reflected gray code is reduced to zero. This scale is proportional to the surface roughness. Wang et al. [11] employed a similar method where they imaged a surfaced illuminated with a step-edge pattern from an LCD and then fit the blurred reflection in the image with a Gaussian kernel. Ferwerda [12] used a method similar to Franken et al. to estimate the BRDF of a target surface with a smartphone by illuminating the surface with black/white gratings, and having an observer adjust the spatial frequency of the gratings until the contrast of the reflected gratings became invisible. These approaches allow us to avoid complex physical setups but working with LCDs as structured illumination sources pose several challenges in terms of resolution and dynamic range, as well as the polarized nature of the emitted light.
Another family of image-based surface capture techniques uses single light source for BRDF estimation. These methods take advantage of changing incidence and view angles over a camera’s field-of-view to sparsely sample the BRDF. Aittala et al. [13] used a collocated camera-flash system to acquire flash, no-flash image pairs for measuring the BRDFs of spatially homogenous materials. Riviere et al. [14] showed a similar approach for handheld acquisition of surface properties. Hui et al. [15] also used a collocated camera and flash to sparsely sample the BRDF. In these methods, image samples only represent 1D slice of the BRDF, so the methods typically supplement this information with dictionary-based priors to estimate the multivariate BRDFs. In a similar vein, Romerio et al. [16] used a single camera, light probe and one HDR image to recover general reflectance functions. They required a homogenous surface, known shape, and known illumination environment to perform the BRDF estimates. While, these approaches drastically reduce the need of complicated setups, they either involve a lot of computation (optimization), or additional a priori information such as dictionaries of known materials.
Deep Learning is another emerging approach to estimate material properties with a single or small set of images [17, 18]. Deschaintre et al. [17] designed one such network of an encoder-decoder convolutional track and a fully connected track to generate diffuse, specular, roughness and normal maps of the underlying material. Vecchio et al. [19] used the dataset introduced by [17] to train SurfaceNet, that uses Generative Adversarial Networks (GANs) to estimate material reflectance parameters. There are many more examples of different networks in the literature, but in principle, such techniques are hugely dependent on the quantity and quality of training data. They require a vast number and variety of materials to be trained accurately, which naturally leads to use of synthetically generated materials. But unfortunately, networks trained on synthetic materials may not produce results at par with other optimization techniques. Having said that, there is active ongoing research [20] to tackle these problems that makes deep learning still a promising approach for future when it is mature enough for a generic widespread application.
BRDF and SVBRDF capture has also been implemented using procam systems. Baek et al. [21] used structured light from a projector to measure the rough geometry of a surface, and then used polarimetric images to obtain per pixel diffuse, specular, normal and roughness maps. Rushmeier et al. [22] used three pairs of procams to separate direct and indirect scattered light using high spatial frequency patterns. We draw inspiration from all the techniques to develop a simple method for capturing the topographies and SVBRDFs of complex surfaces using a consumer-grade procam system.
3.
Approach
3.1
Capture Setup
Our procam-based surface capture system is shown in Fig. 1(a). It consists of a camera (Canon Xsi DSLR) and a DLP projector (LG HF60LA) with their optical axes approximately intersecting at the reference/imaging plane. Their baseline is also approximately parallel to the imaging plane. Both devices are fitted with linear polarizers. A surface of interest is placed within the field of view of the procam system on the imaging plane. It then gets illuminated by structured light patterns produced by the projector and images are simultaneously captured by the camera. The captured images are subsequently processed to generate a model of the surface. The modeling process is mainly divided into two steps: estimating surface topography and estimating material properties.
3.2
Estimating Surface Topography
We use three-step fringe projection profilometry [23] to estimate the topography of the surface. An overview of the method is shown in Figure 3. First, a sinusoidal pattern is projected on the surface, and the pattern distortions induced by the surface are captured by the camera. Three images are captured with phase shifts of 0, 120 and 240 as shown in the following equations:
(1)
in=a+bcos(2πfx2πnN)
(2)
In=A+Bcos(φ2πnN),
where in are the projected sine gratings, In are the captured images with n = 0,1,2 and N = 3. ‘a’ represents the bias (mean offset, 0–1) and ‘b’ denotes the amplitude scaling of the projected grating (a = b = 0.5). A and B gives the average intensity and modulation of the captured intensities, respectively. Wrapped phase distortions (Φ), A and B are calculated as:
(3)
φ=tan13(I1I2)2I0I1I2
(4)
A=I0+I1+I23
(5)
B=13(3(I1I2)2+(2I0I1I2)2).
Figure 3.
Topography estimation using fringe projection profilometry overview: Three 120 phase shifted images are captured for the object and the reference plane. The wrapped phase is calculated and is unwrapped. A pixelwise depth map is obtained by subtracting an object’s unwrapped phase from that of the reference plane.
The wrapped phase measurement obtained through the above equations are corrupted by high frequency noise due to system non linearities. Baker et al. [24] showed that the phase shift error is proportional to the number of phase shifts used in the fringe projection profilometry (in our case three):
(6)
Δφtan1sin(3φ)m,
where Δφ is the phase error due to the high frequency noise. To mitigate this error, we use double three-step phase-shifting fringe projection profilometry [25]. For the double phase shift technique, another set of three images is captured with the pattern phase shifted 60 from the previous set:
(7)
ind=a+bcos(2πfx2πnNπ3),
where ind are the projected 60 shifted gratings. The phase error in the captured shifted gratings then becomes:
(8)
Δφtan1sin3φπ3m
(9)
Δφtan1sin(3φπ)m
(10)
ΔφΔφ,
where Δφd is the phase error from the shifted set of grating images.
The final wrapped phase distortions are then estimated as an average of wrapped phase calculated for each set of images:
(11)
φ+φd2=φ0+Δφ+φ0+Δφd2
(12)
φ+φd2=φ0+Δφ+φ0Δφ2
(13)
φ+φd2=2φ02
(14)
φ+φd2=φ0,
where φ and φd are the wrapped phases and Δφ and Δφd are the non-linearity phase errors for two sets of captured phase-shifted images. Φ0 is the original phase that needs to be recovered which is obtained as a result of the double three phase-shifting technique.
The wrapped phase has the principal arctan values in the range [−π, π] and we need to convert them to a continuous natural range of values. Phase unwrapping is performed to recover correct multiple of 2π to be added to the measured wrapped phase. We use an implementation [26] that uses reliability functions to perform phase unwrapping more accurately.
The height map of the surface is estimated by subtracting the unwrapped phase of the surface from that of the reference plane. At this step we acquire the surface variation in radians, and then, we find a relationship to convert these values to mm. We used a set of 30 feeler gauges with heights ranging from 0.04 to 0.88 mm and estimated their heights in terms of radians using the approach discussed above. The results for the 0.3 mm and 0.75 mm gauges are shown in Figure 4. We plotted all the estimated values in radians with respect to their ground truths to obtain a mapping between the height values in radians and millimeters (Figure 5). We used this mapping to calculate height values for each pixel to create a height map (Fig. 1c).
Figure 4.
Two examples of feeler gauge measurements used to calibrate measured height in radians to millimeters. (Left) Measured height map (radians) for gauges with heights 0.3 mm and 0.75 mm. (Right) Their cross sections.
Figure 5.
Relationship between measured height values in radians and ground truth height values in mm for the 30 feeler gauges.
There are several advantages to using this approach to capture surface topography. First, it requires only six images to measure the variation of the surface to a precision of about 0.01 mm. Second, since it depends on phase shifts induced by the surface variations, its precision is not limited by projector resolution, (unlike methods that use procam pixel correspondences). And finally, because no optimization methods are required, computation times are only on the order of a few minutes for surfaces captured with our 12-megapixel Canon Xsi camera.
Next, we differentiate the height map to calculate a surface normal map. If we assume f(x,y) represents the height map, the normal (n) can be calculated as:
(15)
v=δfδx,δfδy,1
(16)
n=v|v|,
where δfδx and δfδy are gradients in x and y axes, respectively. For discrete case like ours, the differentiation reduces to subtracting adjacent pixel across rows and columns to get the gradients across the x and y axes. After this step, we get normal vectors in the range [−1,1]. Each vector is converted to a range [0,1] and multiplied by 255 to create a standard RGB encoded normal map for rendering (Fig. 1d).
3.3
Estimating Material Properties
3.3.1
Diffuse and Specular Components
We use cross polarization to separate the diffuse and specular reflection components. The polarizers on the procam system are oriented perpendicular to each other to block specular reflections and obtain a diffuse map (Fig. 1e). Their orientation is then changed to parallel to obtain a specular + diffuse (Fig. 1b) map. These two maps are then subtracted to obtain the specular map.
Specular intensities of glossy surfaces often have high dynamic range and are difficult to capture with a single exposure. To get a faithful representation of the specular intensities, we capture images of the surface at a range of exposure times and construct high dynamic range (HDR) images [27]. Linear polarizers are used to capture sets of specular + diffuse and diffuse HDR images. The diffuse HDR image is then subtracted from the specular + diffuse HDR image to yield an unclipped map of specular intensities at each pixel (Figure 6).
Figure 6.
(Left) Sequence of multi exposure images of the painting with the polarizers in perpendicular and parallel orientation respectively. HDR for each of the set is calculated and subtracted to get specular intensities in a higher dynamic range.
At this point in our process, we have a model of surface topography in the form of a height map (H) (Fig. 1c), and a normal map (N) (Fig. 1d), and a partial model of surface SVBRDF in the form of the diffuse map (D) (Fig. 1e) and specular map (S) (Fig. 1f). To represent the complete SVBRDF, an important component is the microscale surface roughness, which as mentioned earlier, has not been previously estimated using a procam system. Our novel approach to estimating roughness using our procam system is discussed in detail in the following sections.
3.3.2
Roughness Component
Our roughness estimation method is based on three key observations. We first observe that for a smooth, homogenous surface, the magnitudes, and rates-of-change of specular reflections vary with the microscale surface roughness and the illumination/viewing angles. The greater the roughness, the lower the specular magnitude and rate-of-change and vice versa. We then observe that in a procam-based structured-light system, the perspective geometry of the projector and camera illuminate and view a surface from regular families of angles. Finally, we observe that we can use the geometry of the procam system along with the normal and specular maps estimated by the system to “unscramble” the specular maps associated with different materials and thereby estimate the roughness components of their BRDFs.
For a given surface point, the normal at that location governs the outgoing reflection direction. For a fixed view location (different from the reflection direction), the intensity measured by the camera is lower than the peak intensity reflected by the material. In other words, it represents a sample of the specular lobe off the peak. The sample will have maximum intensity at the peak of the lobe, which will obtain if the reflected and view directions coincide. We call the surface normal under these conditions the virtual normal. The intensity value measured by the camera at a given point gives a sample of the specular lobe, but the location of the sample on that lobe is related to the transformation required to rotate the measured surface normal into the virtual normal (Figure 7). Thus, by sorting the imaged intensities for a given material by the transformations required to rotate the estimated normals for that material into the corresponding virtual normals, yields an intensity-by-angle curve that is a slice of the specular lobe of the material’s BRDF. Fitting a Gaussian to this curve and calculating its standard deviation, produces a value that is proportional to the microscale roughness of the surface.
Figure 7.
(Left) Every point on a similar material gives a sample of the BRDF due to illumination/viewing geometry. (Right) The sample location is related to the orientation of virtual normal with respect to the measured surface normal.
4.
Calibration
To estimate surface roughness, we first must calibrate our system to know the positions and orientations of the reference plane on which the surface sits, and the projective centers of the projector and camera in world coordinates. Traditionally, we can obtain this information by geometric calibration of the procam system (Figure 8). Camera calibration can be done by using the standard checkerboard method to find the intrinsic and extrinsic matrices [28]. These matrices can be used to estimate the camera center in world coordinates. Similarly, the projector can be calibrated by projecting and capturing gray codes and establishing correspondences with the camera pixels [29]. The relationship can be used to estimate the intrinsic and extrinsic parameters for the projector, and to estimate its center in world coordinates.
Figure 8.
Geometric calibration of the setup using traditional method. Correspondences are established between the camera, projector, and reference plane and each can be transformed to other coordinate system using combination of their intrinsic and extrinsic matrices.
Image-based calibration using checkerboards and projected gray codes is prone to errors due to lens distortion, optical vignetting, errors in corner detection, etc. Therefore, we used an alternative approach to estimate the world coordinates of our procam system. We first measured the height of the camera and projector center from the imaging plane, and then simulated the setup (Figure 9) using 3D computer graphics, with the top left corner of the imaging plane as the origin (coincident with the xy plane with z coordinate = 0.0). We then represented this imaging plane as a buffer geometry having 257 × 257 vertices, and stored the world coordinates of each vertex in a file to be used later in the algorithm.
Figure 9.
Geometric calibration of the setup through simulation. (Left) Setup simulated with camera and projector field of view. The camera, projector and imaging plane are placed according to the measured world positions. (Right) Rendered imaging/reference plane. The simulation automatically gives world coordinates at each vertex/pixel of the plane geometry and saves us calculation for each pixel.
5.
Virtual Normal Calculation
Using this information and the previously estimated normal map, we can calculate virtual normals for each pixel. We first calculate the incident, view, and reflection vectors at each pixel. We then interpolate the surface world-coordinate matrix (257 × 257) to match the resolution of the normal map. Now, with the knowledge of a pixel’s world-coordinate, normal, camera center, and projector center, we spawn rays to calculate the incident and view vectors at each pixel. To calculate the reflection vector, we apply the 3D reflection equation across the normal given by
(17)
r=2(in)ni,
where, r, i, n are the reflection vector, incidence vector, and normal vector respectively. The transformation required to align the surface normal with the virtual normal is same as the transformation required to align the reflection vector with the view vector. We calculate the angle between these vectors to estimate the rotation required to transform the surface normal into the virtual normal. The rotation required at each pixel is represented by heat map as shown in Fig. 1(g) and Figure 10.
Figure 10.
Heat map for virtual normal orientation. (a)(b) Heat map for two paintings, (c) zoomed version of painting (b). Notice the minimum values at bumps where highlights would naturally appear.
6.
Segmentation
We then use the diffuse map to segment the surface into different materials using an HSV color-space-based segmentation algorithm (Fig. 1h) [30].
7.
Sorting Normals
We then use this material-wise segmentation to segment the specular map, and then sort the specular intensities in the different segments with respect to the virtual normal. By sorting the intensities, we get a curve that represents the rate of change of specular intensity with respect to the angle off the virtual normal or peak of the specular lobe.
8.
From Surface Statistics to Roughness Maps
As we saw earlier, the Ward model (Fig. 2) represents the specular component of the BRDF by a Gaussian with magnitude given by ρs and width given by α. With the specular intensities representing the magnitude of the lobe, we use a non-linear least squares method to fit Gaussian curves to the distributions produced by the previous sorting operation (Fig. 1i). The standard deviations (SDs) of these distributions are proportional to the micro-scale roughness of the different materials.
We need to relate the estimated standard deviation values to gloss or roughness values to complete our SVBRDF model. To calibrate this process to real-world materials, we used our system to measure the NCS gloss standards [31]. The NCS gloss standards consist of coated samples with varying gloss levels in white, light-grey, mid-grey and black colors. These samples are formulated to match particular ISO/ASTM specular gloss levels. Figure 11 shows Gaussian lobes for NCS white gloss samples for specular gloss value of 95, 75, 50 and 30. Figure 12 shows the estimated SDs of the NCS samples with different diffuse components. As expected, the lobes have diminishing magnitudes and increasing SDs for decreasing gloss values, and these changes are similar across different diffuse component values. Through a regression procedure we derived a relationship between measured SDs and real-world gloss properties which we then used to scale our measured SDs to gloss values which are in turn scaled to BRDF model roughness parameters for rendering. By propagating the roughness values to each pixel in each material segment of the surface, we are able to generate a roughness map (Fig. 1j) of the surface, which along with the height, normal, diffuse, and specular maps generated by the system, for each segmented region, comprise a model of complex surface topography and SVBRDF.
Figure 11.
Specular lobes for (white) NCS gloss standards with different specular gloss levels. Clockwise from top left: measured data and fitted Gaussians for gloss levels 95, 75, 50, and 30 respectively. The magnitudes of the lobes decrease, and the spreads of the lobes increases with the decreasing gloss levels.
Figure 12.
Estimated specular lobes standard deviations for white, light-grey, mid-grey and black NCS gloss standards with different specular gloss values. The data shows a near-linear inverse relationship between estimated lobe statistics and specular gloss values for all the different albedo values.
To confirm the validity of this process, we also measured the NCS gloss standards using an Elcometer 408 glossmeter [32] and compared the measured lobe statistics with those estimated by our system (Figure 13). The near-linear relationship provides support for the accuracy of our approach.
Figure 13.
Estimated specular lobe SDs vs Elcometer-measured (ground-truth) specular lobe SDs for the white NCS gloss samples.
8.1
Rendering
We rendered captured surfaces using a web-based 3D graphics API called Three.js [33]. The height, normal, diffuse and specular maps were assigned to the renderer’s displacement, normal, albedo and specular maps respectively. To create a roughness map compatible with the renderer, we related estimated standard deviations to normalized NCS gloss values (0–1) and then subtracted these values from 1.0 to create a roughness map of the correct sense (high gloss = low roughness). We rendered our surfaces using these maps as shown in Fig. 1(k).
9.
Results
We tested our algorithm on surfaces of increasing complexity (Figure 14). We captured a total of 14 images per object (6 FPP + 8 cross polarized HDR images). We used three types of paints with different gloss levels in each example. First, we created nominally planar painting on smooth white foam core with the strokes of the three types of paints (purple: satin, green, red: glossy, blue: mixture of satin and glossy). This sample tests the complete algorithm for a relatively planar surface. We then increased the surface complexity by creating a painting on foam core where there is significant surface variation in the paint strokes. These paint strokes would add non-uniform variation in the normal orientation across the field of view. Finally, we tested our algorithm by creating a similar painting on a textured canvas substrate. The microscale variation of the canvas creates a wide range of normal variation and makes it difficult to sample the specular lobe. As Fig. 14 shows, in all three cases, our system was able to capture the surface topography and to differentiate between the different paints, which can be seen both the component maps and the realistically rendered images.
Figure 14.
SVBRDF estimation of paintings with increasing complexity. Each column represents a different test object. (a) Original images (b) Diffuse maps (c) Specular maps (d) Height maps (e) Normal maps (f) Roughness Maps (g),(h) screenshots of rendered objects at two viewpoints.
Fig. 1(i) show the distribution for different paints in the painting. The upper left distribution represents specular lobe of a satin paint and has a larger standard deviation compared to the distribution on upper right which is a mixture of satin and gloss paints. The lower two distributions are for glossy paints and have standard deviation smaller than the other two.
10.
Conclusions
In this paper, we presented a method for estimating the topography and SVBRDFs (including surface roughness) of complex surfaces using a procam system made of consumer grade components. It produces height, normal, diffuse, specular and roughness maps of captured surfaces that can be used to model a surface and render realistic images of it. This method should be a great addition to the technological toolkit of researchers and practitioners who want to capture and model complex real-world surfaces and use them in physically based rendering.
While we believe this work represents a significant advance in image-based methods for surface appearance capture, there is still much work to be done. First, since we are currently illuminating and imaging surfaces from fixed directions, at this time we can only estimate the SVBRDFs of isotropic materials. Therefore, adapting the method for anisotropic materials would be valuable. Second, the fringe projection profilometry method is fast and can measure small surface variations, but models sometime have high spatial frequency artifacts which are difficult to completely remove. This may cause errors in normal estimation for surfaces with very small variations. Third, for near-planar surfaces made of many different materials we will need to capture multiple images of the surface at different positions across the system’s field of view to get enough samples of the specular lobe of a given material. Fourth, the accuracy of our approach depends on the segmentation algorithm to cluster pixels of same material, exploring the accuracy of different segmentation algorithms under different conditions would be a useful exercise. Finally, with our single procam system, we are limited to a narrow family of angles that limit our ability to evaluate Fresnel reflectance at grazing angles. Additionally, we have used Gaussian models statistics for inferencing about the material maps that gave us reasonable approximations. In our future work we plan to explore other mathematical distributions and set up configurations to get more complete representations of BRDFs. Future work also involves extending and validating the method for a wider range of surfaces and materials and extending the method to handle translucent materials.
References
1GengJ.2011Structured-light 3D surface imaging: a tutorialAdv. Opt. Photon.3128160128–6010.1364/AOP.3.000128
2TranV. L.LinH.-Y.2018A structured light RGB-D camera system for accurate depth measurementInt’l. J. Opt.201810.1155/2018/8659847
3ZhangS.2018High-speed 3D shape measurement with structured light methods: A reviewOpt. Lasers Eng.106119131119–3110.1016/j.optlaseng.2018.02.017
4WardG. J.1992Measuring and modeling anisotropic reflectionProc. 19th Annual Conf. on Computer Graphics and Interactive Techniques (SIGGRAPH ’92)265272265–72Association for Computing MachineryNew York, NY, USA10.1145/142920.134078
5DanaK. J.WangJ.2004Device for convenient measurement of spatially varying bidirectional reflectanceJ. Opt. Soc. Am. A211121–1210.1364/JOSAA.21.000001
6NamG.LeeJ.WuH.GutierrezD.KimM.2016Simultaneous acquisition of microscale reflectance and normalACM Trans. Graph3518510.1145/2980179.2980220
7GhoshA.ChenT.PeersP.WilsonC. A.DebevecP.2009Estimating specular roughness and anisotropy from second order spherical gradient illuminationComput. Graph. Forum28116111701161–7010.1111/j.1467-8659.2009.01493.x
8GardnerA.TchouC.HawkinsT.DebevecP.2003Linear light source reflectometryACM Trans. Graph22749758749–5810.1145/882262.882342
9AittalaM.WeyrichT.LehtinenJ.2013Practical SVBRDF capture in the frequency domainACM Trans. Graph.32110111110–110.1145/2461912.2461978
10FranckenY.CuypersT.MertensT.BekaertP.2009Gloss and normal map acquisition of mesostructures using gray codesProc. 5th Int’l. Symposium on Advances in Visual Computing: Part II (ISVC ’09)788798788–98SpringerBerlin, Heidelberg10.1007/978-3-642-10520-3_75
11WangC.SnavelyN.MarschnerS.2011Estimating dual-scale properties of glossy surfaces from step-edge lightingACM Trans. Graph.301121–1210.1145/2070781.2024206
12FerwerdaJ.2018Lightweight estimation of surface BRDFsJ. Imaging Sci. Technol.6210.2352/J.ImagingSci.Technol.2018.62.5.050407
13AittalaM.WeyrichT.LehtinenJ.2015Two-shot SVBRDF capture for stationary materialsACM Trans. Graph.3411010.1145/2766967
14RiviereJ.PeersP.GhoshA.2016Mobile surface reflectometryComput. Graph. Forum35191202191–20210.1111/cgf.12719
15HuiZ.SunkavalliK.LeeJ.-Y.HadapS.WangJ.SankaranarayananA. C.2017Reflectance capture using univariate sampling of BRDFs2017 IEEE Int’l. Conf. on Computer Vision (ICCV)537253805372–80IEEEPiscataway, NJ10.1109/ICCV.2017.573
16RomeiroF.VasilyevY.ZicklerT.2008Passive reflectometryECCVLNCS 5305859872859–7210.1007/978-3-540-88693-8_63
17DeschaintreV.AittalaM.DurandF.DrettakisG.BousseauA.2018Single-image SVBRDF capture with a rendering-aware deep networkACM Trans. Graph.3712810.1145/3197517.3201378
18MartinR.RoullierA.RouffetR.KaiserA.BoubekeurT.2022MaterIA: single image high-resolution material capture in the wildComput. Graph. Forum41163177163–7710.1111/cgf.14466
19VecchioG.PalazzoS.SpampinatoC.2021SurfaceNet: adversarial SVBRDF estimation from a single image2021 IEEE/CVF Int’l. Conf. on Computer Vision (ICCV)IEEEPiscataway, NJ10.1109/ICCV48922.2021.01260
20BossM.JampaniV.KimK.LenschH. P. A.KautzJ.2020Two-shot spatially-varying BRDF and shape estimation2020 IEEE/CVF Conf. on Computer Vision and Pattern Recognition (CVPR)IEEEPiscataway, NJ10.1109/CVPR42600.2020.00404
21BaekS.JeonD.TongX.KimM.2018Simultaneous acquisition of polarimetric SVBRDF and normalACM Trans. Graph. (TOG)371151–1510.1145/3272127.3275018
22RushmeierH.LockermanY.CartwrightL.PiteraD.2015Experiments with a low-cost system for computer graphics material model acquisitionProc. SPIE939893980610.1117/12.2082895
23PadhyeS.MessingerD.FerwerdaJ.2021A practitioner’s guide to fringe projection profilometryProc. IS&T Archiving 2021566056–60IS&TSpringfield, VA
24BakerM. J.XiJ.ChicharoJ. F.2008Elimination of non-linear luminance effects for digital video projection phase measuring profilometers4th IEEE Int’l. Symposium on Electronic Design, Test and Applications (delta 2008)IEEEPiscataway, NJ10.1109/DELTA.2008.90
25HuangP. S.HuQ. J.ChiangF.2002Double three step phase-shifting algorithmAppl. Opt.41450345094503–910.1364/AO.41.004503
26HerraezM. A.BurtonD. R.LalorM. J.GdeisatM. A.2002Fast two-dimensional phase-unwrapping algorithm based on sorting by reliability following a noncontinuous pathJ. Appl. Opt.41743710.1364/AO.41.007437
27RobertsonM. A.BormanS.StevensonR. L.1999Dynamic range improvement through multiple exposuresProc. 1999 Int’l. Conf. on Image ProcessingVol. 3159163159–63IEEEPiscataway, NJ10.1109/ICIP.1999.817091
28ZhangZ.2000A flexible new technique for camera calibrationIEEE Trans. Pattern Anal. Mach. Intell.22133013341330–410.1109/34.888718
29MorenoD.TaubinG.2012Simple, accurate, and robust projector-camera calibration2012 Second Int’l. Conf. on 3D Imaging, Modeling, Processing, Visualization & Transmission464471464–71IEEEPiscataway, NJ10.1109/3DIMPVT.2012.77
30BurdescuD. D.BrezovanM.GaneaE.StanescuL.2009A new method for segmentation of images represented in a HSV color spaceAdvanced Concepts for Intelligent Vision Systems606617606–17SpringerCham10.1007/978-3-642-04697-1_57
31NCS. 2022. NCS Gloss Scale, https://ncscolour.com/product/ncs-glossscale/