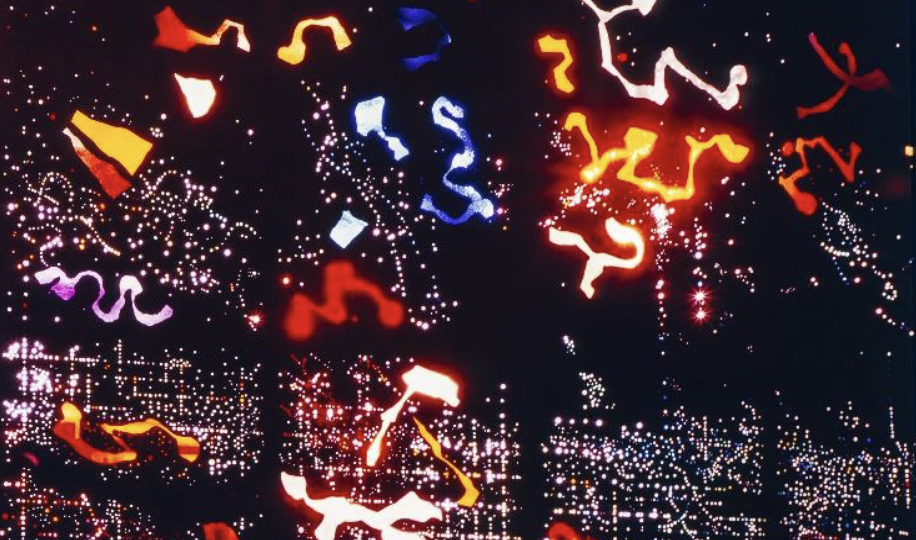
Márton Orosz's keynote lecture unfurls a captivating case study, shedding light on an overlooked precursor of media art and delving into the historical context of achieving a symbiosis between artistic self-expression and the anonymity of science. Focusing on the ``Cold War Bauhaus'' program in the late 1960s and early 1970s, Orosz introduces the revolutionary theories of György Kepes, polymath, and founder of the Center for Advanced Visual Studies (CAVS) at MIT, an early pioneer of exploring the intersection of art, science, and technology. The central question addressed is how to develop an agenda that bridges between aesthetics and engineering, not merely as a gap-filling exercise but as a means to forge a human-centered ecology using cutting-edge technology. Kepes' visionary concept involves offering ``prosthetics'' to emulate nature, providing an alternative for building a sustainable world---a groundbreaking idea in Post-War art history. Kepes' prominence lies in his cybernetic thinking, theories on human perception (evident in the notion of ``dynamic iconography'' from his 1944 textbook Language of Vision), and his antecedent use of the term ``visual culture'' in art literature. Moreover, he stands as one of the earliest to employ nanotechnology in creating artwork. Orosz explores Kepes's insights into visual aesthetics, his concept of the ``revision of vision,'' and the impact of ``the power of the eye'' on human cognition. The lecture scrutinizes Kepes' concrete examples aimed at humanizing science and fostering ecological consciousness through the creative use of technology. The in-depth analysis extends into Kepes' quest to establish a universal visual grammar imbued with symbolic meaning, crafting a novel iconography of scientific images he termed ``the new landscape,'' that extends to community-based participatory works utilizing new media engaging and synchronizing sensory channels within our bodies. The paper contemplates Kepes' recently discovered legacy, emphasizing the democratization of vision, and reflects on its historical context, sources, reception, and enduring impact.
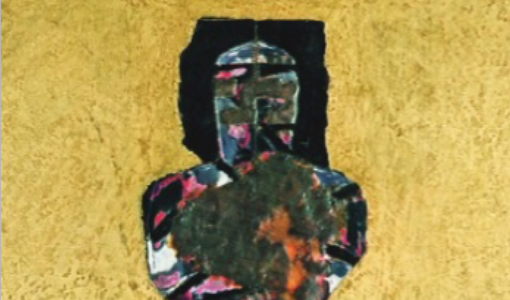
In 2023, the Modern Art Collection of the venerable Vatican Museums celebrated the 50th anniversary of its founding. An anchorpiece chosen for this celebration is a remarkable work in the encaustic technique by Bulgarias most famous artist, Ivan Vukadinov. Entitled In Memory of the Heroes, this work typifies his oeuvre, which is deeply rooted in the rich history of art of the region, Thraciaa region with a cultural legacy predating much of Roman, Greek, and even Egyptian art, while simultaneously being at the cutting edge of modern artistic conceptualizations and inventive techniques. In this work, Vukadinov transcends millennia of existing preconceptions to evoke innovative explorations of deep cultural concepts, both in terms of the iconography and compositional philosophy. It gives the inexorable sense of moving powerfully beyond the bounds of space and time to embody a profound sense of the unstoppable force of the resurrected heroic spirit. Vukadinov transcends millennia of existing preconceptions to evoke highly innovative explorations of deep cultural concepts, both in terms of the iconography and compositional philosophy. The present analysis delves into the extraordinary interpretative range of this evocative work - "In Memory of the Heroes"- uncovering explicit resonances and powerful contrasts that defy traditional interpretations. Moreover, it explores how, as an adept intuitive neuroscientist, Vukadinov also discovers and seamlessly integrates several uncharted perceptuo-cognitive mechanisms, shedding light on the depth and complexity of his artistic vision. Ivan Vukadinov - Wikipedia
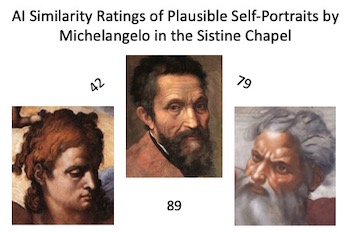
Three of the faces in Michelangelos Sistine Chapel frescos are recognized as portraits: his own sardonic self-portrait in the flayed skin held by St Bartholomew, itself a portrait of the scathing satirist Pietro Agostino, and the depiction of Mary as a portrait of his spiritual soulmate Vittoria Colonna. The first analysis was of the faces of the depictions of God and of the patriarch Jacob, which were rated by AI-based facial ratings as highly similar to each other and to a portrait of Michelangelo. A second set of young faces: Jesus, Adam and Sebastian, were also rated as highly similar to God and to each other. These ratings suggest that Michelangelo depicted himself as all these central figures in the Sistine Chapel frescoes. Similar ratings of several young women across the ceiling suggested that they were further portraits of Vittoria Colonna, and that she had posed for Michelangelo as a model for the Sistine Chapel personages in her younger years.
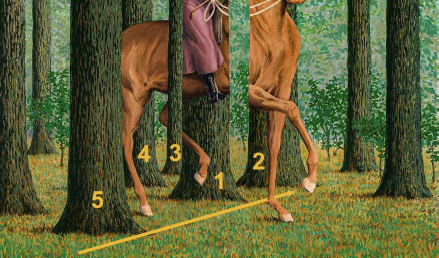
René Magritte (1898-1967), the great Belgian surrealist, once said ``...the function of art is to make poetry visible, to render thought visible''. The poetry emerged on his canvases by meticulous, aesthetically engaging depiction of objects and scenes replete with surprise and apparent perceptual self-contradiction. Visual neuroscience now recognizes that pictorial art can reveal some of the visual brain's ``neural rules'' and processing hierarchies. This article examines two salient exemplars drawn from Magritte's vast oeuvre. The first is his 1933 masterpiece, `La Condition Humaine' (The Human Condition), one of his most philosophical works. We see a room with a painting on an easel that appears to paradoxically reveal exactly what it occludes: a pastoral scene outside the room. I examine in detail the visual cues that elicit an alternation between salient yet mutually exclusive percepts, transparency vs opacity, of the same object. The conflicting percepts are experienced as surreal, drawing us into the heart of the problem: the nature of representation (in art and in the brain), and a meditation on the localization of thought, even the nature of reality. A second masterpiece, `Le Blanc Seing' (1965), is visually stunning, beautifully rendered and, at first glance, otherwise unremarkable. We see a tranquil scene with a woman on a horse passing through a stand of trees. However, Magritte has embedded several jarring effects that induce surreal competition between figure and background, challenging object integrity, including a shocking, apparent interruption of the horse's torso replaced with distant, background foliage. In the course of my research on Le Blanc-Seing, I came upon a plausible pictorial inspiration for the painting in a brief scene from a 1924 German silent film which I illustrate here. This connection had been hinted at before (Whitfield, 1992), but had never been demonstrated pictorially until now. Both of these masterpieces illustrate what I call the power of subtle painterly gesture, i.e. when small details act as `perceptual amplifiers', inducing a strong effect on both our perceptual and cognitive understanding of scene elements across a large region of visual space. In addition to their deep and complex aesthetic appeal, both works are also virtual courses in perception with many elements that direct our attention to the pictorial details that elicit perceptual figure-ground segregation, object identification, cues for depth perception, Gestalt Laws of occlusion-continuation and visual scene organization.
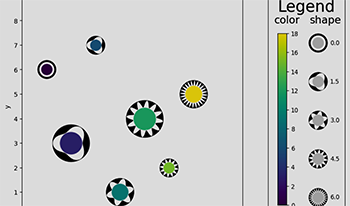
The natural ordering of shapes is not historically used in visualization applications. It could be helpful to show if an order exists among shapes, as this would provide an additional visual channel for presenting ordered bivariate data. Objective—we rigorously evaluate the use of visual entropy allowing us to construct an ordered scale of shape glyphs. Method—we evaluate the visual entropy glyphs in replicated trials online and at two different global locations. Results—an exact binomial analysis of a pair-wise comparison of the glyphs showed a majority of participants (n = 87) ordered the glyphs as predicted by the visual entropy score with large effect size. In a further signal detection experiment participants (n = 15) were able to find glyphs representing uncertainty with high sensitivity and low error rates. Conclusion—Visual entropy predicts shape order and provides a visual channel with the potential to support ordered bivariate data.
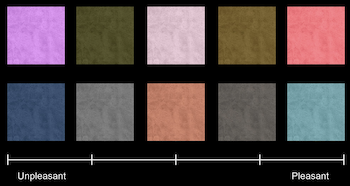
Understanding multimodal interaction and its effects on user experience and behavior is becoming increasingly important with the rapid development of immersive mixed-reality applications. While significant attention has been devoted to enabling haptic feedback in multisensory extended reality systems, research on how the visual and tactile properties of materials and objects interact is still limited. This study investigates how the color appearance of texture images affects observers' judgments of different tactile attributes. For this purpose, we captured images of different texture samples and manipulated the color of the images based on the previously reported consistent mapping of tactile descriptors onto color space. The observers were asked to rate these textures on different haptic properties to test the effects of color on their perception of materials. We found that the effect of changing color is most significant for the perception of heaviness, warmness, and naturalness of textures. For these attributes, a strong correlation between ratings of textures and ratings of uniform color patches of similar colors was also observed, while other attributes, such as hardness, dryness, or pleasantness, showed low or no correlation. The results can increase our understanding of the role of color as a visual cue in estimating material properties of visual textures and for designing and rendering surface properties of objects in 3D printing and virtual and augmented reality applications, including online shopping and gaming.
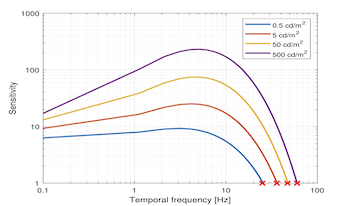
Contrast sensitivity functions (CSFs), which provide estimations of detection thresholds, have far-reaching applications in digital media processing, rendering, and transmission. There is a practical interest in obtaining accurate estimations of spatial and temporal resolution limits from a spatiotemporal CSF model. However, current spatiotemporal CSFs are inaccurate when predicting high-frequency limits such as critical flicker frequency (CFF). To address this problem, we modified two spatiotemporal CSFs, namely Barten’s CSF and stelaCSF, to better account for the contrast sensitivity at high temporal frequencies, both in the fovea and eccentricity. We trained these models using 15 datasets of spatial and temporal contrast sensitivity measurements from the literature. Our modifications account for two features observed in CFF measurement: the increase of CFF at medium eccentricities (of about 15 deg), and the saturation of CFF at high luminance values. As a result, the prediction errors for CFF obtained from the modified models improved remarkably.

A model of lightness computation by the human visual system is described and simulated. The model accounts to within a few percent error for the large perceptual dynamic range compression observed in lightness matching experiments conducted with Staircase Gelb and related stimuli. The model assumes that neural lightness computation is based on transient activations of ON- and OFF-center neurons in the early visual pathway generated during the course of fixational eye movements. The receptive fields of the ON and OFF cells are modeled as difference-of-gaussian functions operating on a log-transformed image of the stimulus produced by the photoreceptor array. The key neural mechanism that accounts for the observed degree of dynamic range compression is a difference in the neural gains associated with ON and OFF cell responses. The ON cell gain is only about 14 as large as that of the OFF cells. ON and OFF cell responses are sorted in visual cortex by the direction of the eye movements that generated them, then summed across space by large-scale receptive fields to produce separate ON and OFF edge induction maps. Lightness is computed by subtracting the OFF network response at each spatial location from the ON network response and normalizing the spatial lightness representation such that the maximum activation within the lightness network always equals a fixed value that corresponds to the white point. In addition to accounting for the degree of dynamic range compression observed in the Staircase Gelb illusion, the model also accounts for change in the degree of perceptual compression that occurs when the spatial ordering of the papers is altered, and the release from compression that occurs when the papers are surrounded by a white border. Furthermore, the model explains the Chevreul illusion and perceptual fading of stabilized images as a byproduct of the neural lightness computations assumed by the model.
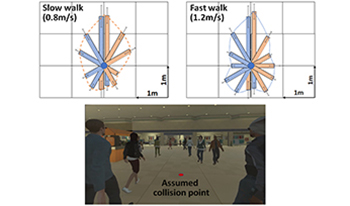
Avoiding person-to-person collisions is critical for visual field loss patients. Any intervention claiming to improve the safety of such patients should empirically demonstrate its efficacy. To design a VR mobility testing platform presenting multiple pedestrians, a distinction between colliding and non-colliding pedestrians must be clearly defined. We measured nine normally sighted subjects’ collision envelopes (CE; an egocentric boundary distinguishing collision and non-collision) and found it changes based on the approaching pedestrian’s bearing angle and speed. For person-to-person collision events for the VR mobility testing platform, non-colliding pedestrians should not evade the CE.
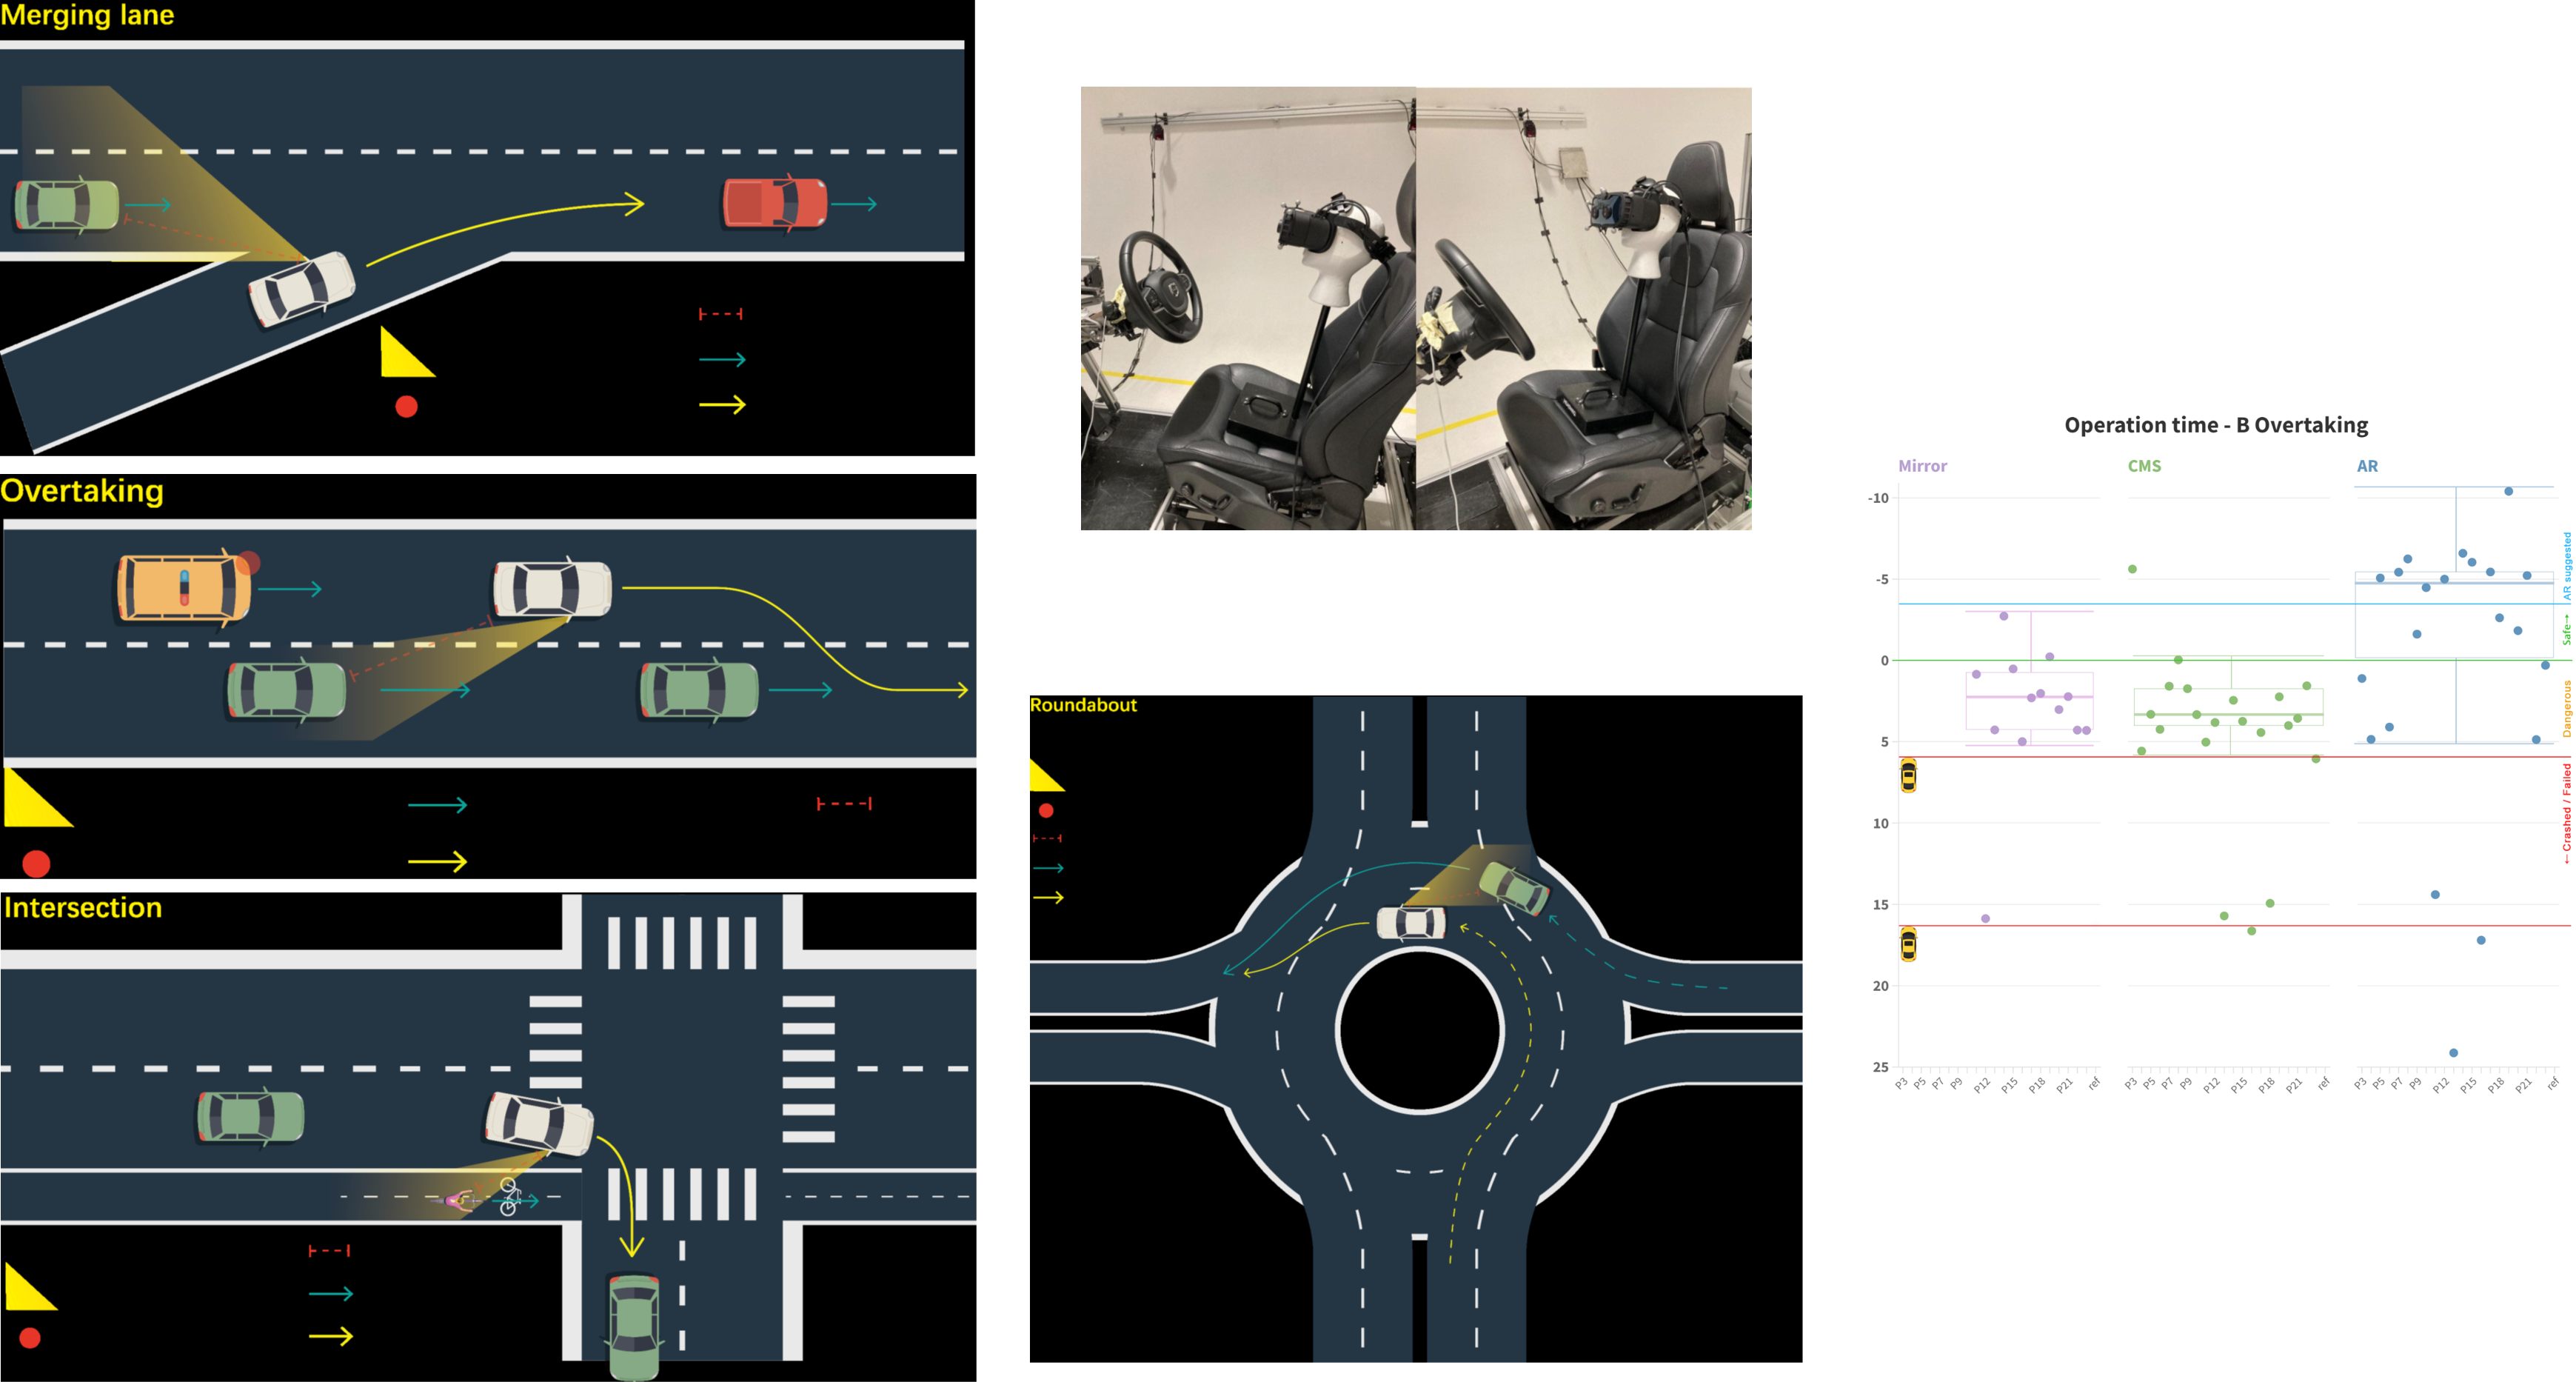
Recently, the traditional rear and side view mirrors have been started to be exchanged with a digital version. The aim of this study was to investigate the difference in driving performance between traditional rear-view mirrors and digital rear view mirrors which is called Camera Monitor System (CMS) in the vehicle industry. Here, two different types were investigated: CMS without or with Augmented Reality (AR) Information. The user test was conducted in a virtual environment, with four driving scenarios defined for testing. The user test results revealed that the participants driving performance using CMS (only cameras and 2D displays without augmented information) did not improve over traditional mirrors.