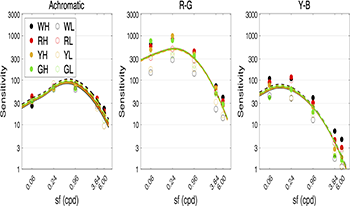
The goals of this work are to accumulate the experimental data on contrast sensitivity functions and to establish a visual model that incorporates spatial frequency dependence. In addition, the experimental results from fixed-size and fixed-cycles stimuli and from different luminance levels were compared. Such a model is highly desired for applications that rely on image quality and to serve the lighting and imaging industries. The detection thresholds have been measured for chromatic contrast patterns at different spatial frequencies. The experimental parameters included: (1) four colour centres (white, green, yellow, and red), which were recommended by the International Commission on Illumination (CIE), at two different luminance levels for each colour centre; (2) three colour directions for each colour centre, namely luminance, red-green and yellow-blue; (3) five spatial frequencies, 0.06, 0.24, 0.96, 3.84, and 6.00 cycles per degree (cpd) for fixed-cycles stimulation, in which two spatial frequencies, 0.24 and 6.00 cpd, were also chosen for fixed-size stimuli. In this experiment, a 10-bit display characterized by GOG model was used to obtain contrast thresholds of different colour centres by 2-alternative forced choice method and stair-case method. The experimental results revealed different parameter effects (colour centres, luminance, colour direction, fixed cycle/size), and also supported McCann's conclusion that the number of cycles affects the comparative sensitivity. Most importantly, a cone contrast model was successfully developed by fitting the visual test data (fixed number of cycles). The model could accurately predict the contrast sensitivity of different color centers, spatial frequencies and stimulus.

The history of cartography has been marked by the endless search for the perfect form for the representation of the information on a spherical surface manifold into the flat planar format of the printed page or computer screen. Dozens of cartographic formats have been proposed over the centuries from ancient Greek times to the present. This is an issue not just for the mapping of the globe, but in all fields of science where spherical entities are found. The perceptual and representational advantages and drawbacks of many of these formats are considered, particularly in the tension between a unified representation, which is always distorted in some dimension, and a minimally distorted representation, which can only be obtained by segmentation into sectorial patches. The use of these same formats for the mapping of spherical manifolds are evaluated, from quantum physics through the mapping of the brain to the large-scale representation of the cosmos.