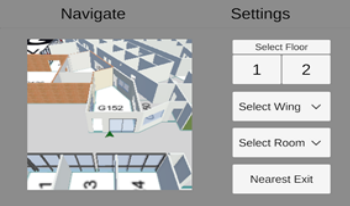
During emergencies, accurate and timely dissemination of evacuation information plays a critical role in saving lives and minimizing damage. As technology continues to advance, there is an increasing need to explore innovative approaches that enhance emergency evacuation and navigation in an indoor environment to facilitate efficient decision-making. This paper presents a mobile augmented reality application (MARA) for indoor emergency evacuation and navigation in a building environment in real time. The location of the user is determined by the device camera and translated to a position within a Digital Twin of the Building. AI-generated navigation meshes and augmented reality foundation image tracking technology are used for localization. Through the visualization of integrated geographic information systems and real-time data analysis, the proposed MARA provides the current location of the person, the number of exits, and user-specific personalized evacuation routes. The MARA can also be used for acquiring spatial analysis, situational awareness, and visual communication. In emergencies such as fire and smoke visibility becomes poor inside the building. The proposed MARA provides information to support effective decision-making for both building occupants and emergency responders during emergencies.

Situational awareness provides the decision making capability to identify, process, and comprehend big data. In our approach, situational awareness is achieved by integrating and analyzing multiple aspects of data using stacked bar graphs and geographic representations of the data. We provide a data visualization tool to represent COVID pandemic data on top of the geographical information. The combination of geospatial and temporal data provides the information needed to conduct situational analysis for the COVTD-19 pandemic. By providing interactivity, geographical maps can be viewed from different perspectives and offer insight into the dynamical aspects of the COVTD-19 pandemic for the fifty states in the USA. We have overlaid dynamic information on top of a geographical representation in an intuitive way for decision making. We describe how modeling and simulation of data increase situational awareness, especially when coupled with immersive virtual reality interaction. This paper presents an immersive virtual reality (VR environment and mobile environment for data visualization using Oculus Rift head-mounted display and smartphones. This work combines neural network predictions with human-centric situational awareness and data analytics to provide accurate, timely, and scientific strategies in combatting and mitigating the spread of the coronavirus pandemic. Testing and evaluation of the data visualization tool have been done with realtime feed of COVID pandemic data set for immersive environment, non-immersive environment, and mobile environment.