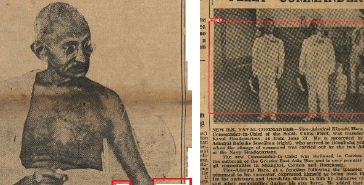
This paper presents the methodologies to extract the headline and illustrations from a historical newspaper for storytelling to support digital scholarship. It explored the ways in which new digital tools can facilitate the understanding of the newspaper content in the setting of time and space, "The Hongkong News" was selected from Hong Kong Early Tabloid Newspaper for the case study owing to its uniqueness in historical value towards the scholars. The proposed methodologies were evaluated in OCR (Optical Character Recognition) with scraping and Deep Learning Object Detection models. Two visualization products were developed to showcase the feasibility of our proposed methods to serve the storytelling purpose.

The Conference on Visualization and Data Analysis (VDA) 2023 covers all research, development, and application aspects of data visualization and visual analytics. Since the first VDA conference was held in 1994, the annual event has grown steadily into a major venue for visualization researchers and practitioners from around the world to present their work and share their experiences. We invite you to participate by submitting your original research as a full paper, for an oral or interactive (poster) presentation, and attending VDA in the upcoming year.

The Conference on Visualization and Data Analysis (VDA) 2022 covers all research, development, and application aspects of data visualization and visual analytics. Since the first VDA conference was held in 1994, the annual event has grown steadily into a major venue for visualization researchers and practitioners from around the world to present their work and share their experiences. We invite you to participate by submitting your original research as a full paper, for an oral or interactive (poster) presentation, and attending VDA 2022.


This publication reports on a research project in which we set out to explore the advantages and disadvantages augmented reality (AR) technology has for visual data analytics. We developed a prototype of an AR data analytics application, which provides users with an interactive 3D interface, hand gesture-based controls and multi-user support for a shared experience, enabling multiple people to collaboratively visualize, analyze and manipulate data with high dimensional features in 3D space. Our software prototype, called DataCube, runs on the Microsoft HoloLens - one of the first true stand-alone AR headsets, through which users can see computer-generated images overlaid onto realworld objects in the user’s physical environment. Using hand gestures, the users can select menu options, control the 3D data visualization with various filtering and visualization functions, and freely arrange the various menus and virtual displays in their environment. The shared multi-user experience allows all participating users to see and interact with the virtual environment, changes one user makes will become visible to the other users instantly. As users engage together they are not restricted from observing the physical world simultaneously and therefore they can also see non-verbal cues such as gesturing or facial reactions of other users in the physical environment. The main objective of this research project was to find out if AR interfaces and collaborative analysis can provide an effective solution for data analysis tasks, and our experience with our prototype system confirms this.