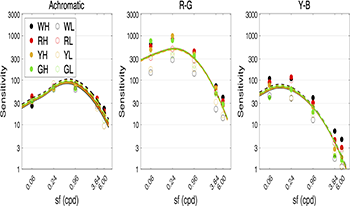
The goals of this work are to accumulate the experimental data on contrast sensitivity functions and to establish a visual model that incorporates spatial frequency dependence. In addition, the experimental results from fixed-size and fixed-cycles stimuli and from different luminance levels were compared. Such a model is highly desired for applications that rely on image quality and to serve the lighting and imaging industries. The detection thresholds have been measured for chromatic contrast patterns at different spatial frequencies. The experimental parameters included: (1) four colour centres (white, green, yellow, and red), which were recommended by the International Commission on Illumination (CIE), at two different luminance levels for each colour centre; (2) three colour directions for each colour centre, namely luminance, red-green and yellow-blue; (3) five spatial frequencies, 0.06, 0.24, 0.96, 3.84, and 6.00 cycles per degree (cpd) for fixed-cycles stimulation, in which two spatial frequencies, 0.24 and 6.00 cpd, were also chosen for fixed-size stimuli. In this experiment, a 10-bit display characterized by GOG model was used to obtain contrast thresholds of different colour centres by 2-alternative forced choice method and stair-case method. The experimental results revealed different parameter effects (colour centres, luminance, colour direction, fixed cycle/size), and also supported McCann's conclusion that the number of cycles affects the comparative sensitivity. Most importantly, a cone contrast model was successfully developed by fitting the visual test data (fixed number of cycles). The model could accurately predict the contrast sensitivity of different color centers, spatial frequencies and stimulus.

Visual noise is a metric for measuring the amount of noise perception in images taking into account the properties of the human visual system (HVS). A visual noise measurement method is specified in Annex B of ISO 15739, which has been used as a useful measurement metric over the years since its introduction. As several issues have been questioned recently, it is now being investigated for revision involving changes to the CSF, color space used for rms noise value measurements, and visual noise formula combining rms values in three color channels. To derive visual noise formula involving color noise weighting coefficients representing HVS sensitivity to noise, subjective experiments using simulated luminance and color noise images were done. The improvement of calculation stability and HVS correspondence was verified using simulation and real camera images under various conditions. Finally, subjective experiments using real camera images were performed to validate the revised method and update the color noise coefficients considering practical measurement cases.