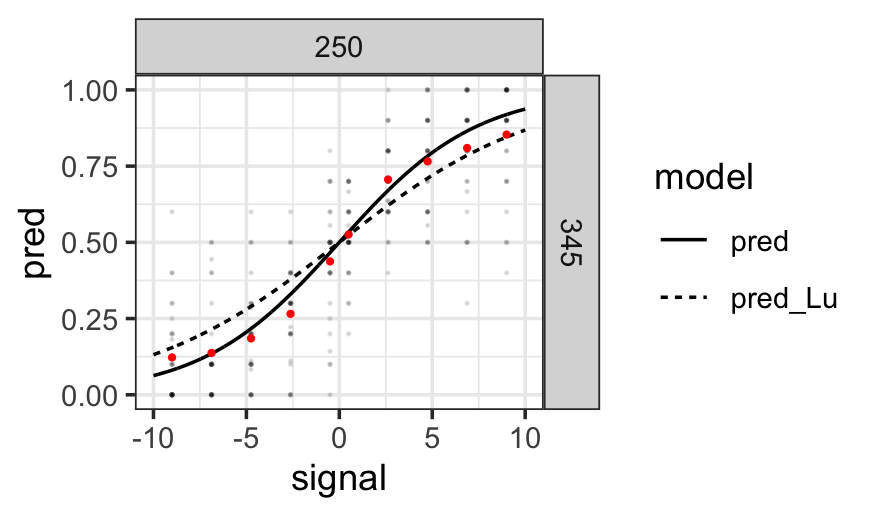
User experiments are essential for informing researchers what an audience is seeing in a chart. User experiments are generally quite expensive in monetary value and in the time spent getting data. It is crucial that we make the most out of the data we get from participants. Statistically, the best practice for data with repeated measurements is the use of (Generalized) Linear Mixed Effects Models (GLME). These models increase the statistical power, produce more reliable estimates, and provide better interpretability for population-level and individual-level effects. However, in the literature, a two-stage approach for analyzing results from user experiments is commonly used. We compare the two approaches with example data from psychophysics experiments. We present a strategy on how to evolve a two-stage analysis to a single GLME model and showcase diagnostics for each step of that process. We adhere to the best practices of open science and reproducible research by providing open access to all of our code and data.

We present VideoSwarm, a system for visualizing video ensembles generated by numerical simulations. VideoSwarm is a web application, where linked views of the ensemble each represent the data using a different level of abstraction. VideoSwarm uses multidimensional scaling to reveal relationships between a set of simulations relative to a single moment in time, and to show the evolution of video similarities over a span of time. VideoSwarm is a plug-in for Slycat, a web-based visualization framework which provides a web-server, database, and Python infrastructure. The Slycat framework provides support for managing multiple users, maintains access control, and requires only a Slycat supported commodity browser (such as Firefox, Chrome, or Safari).