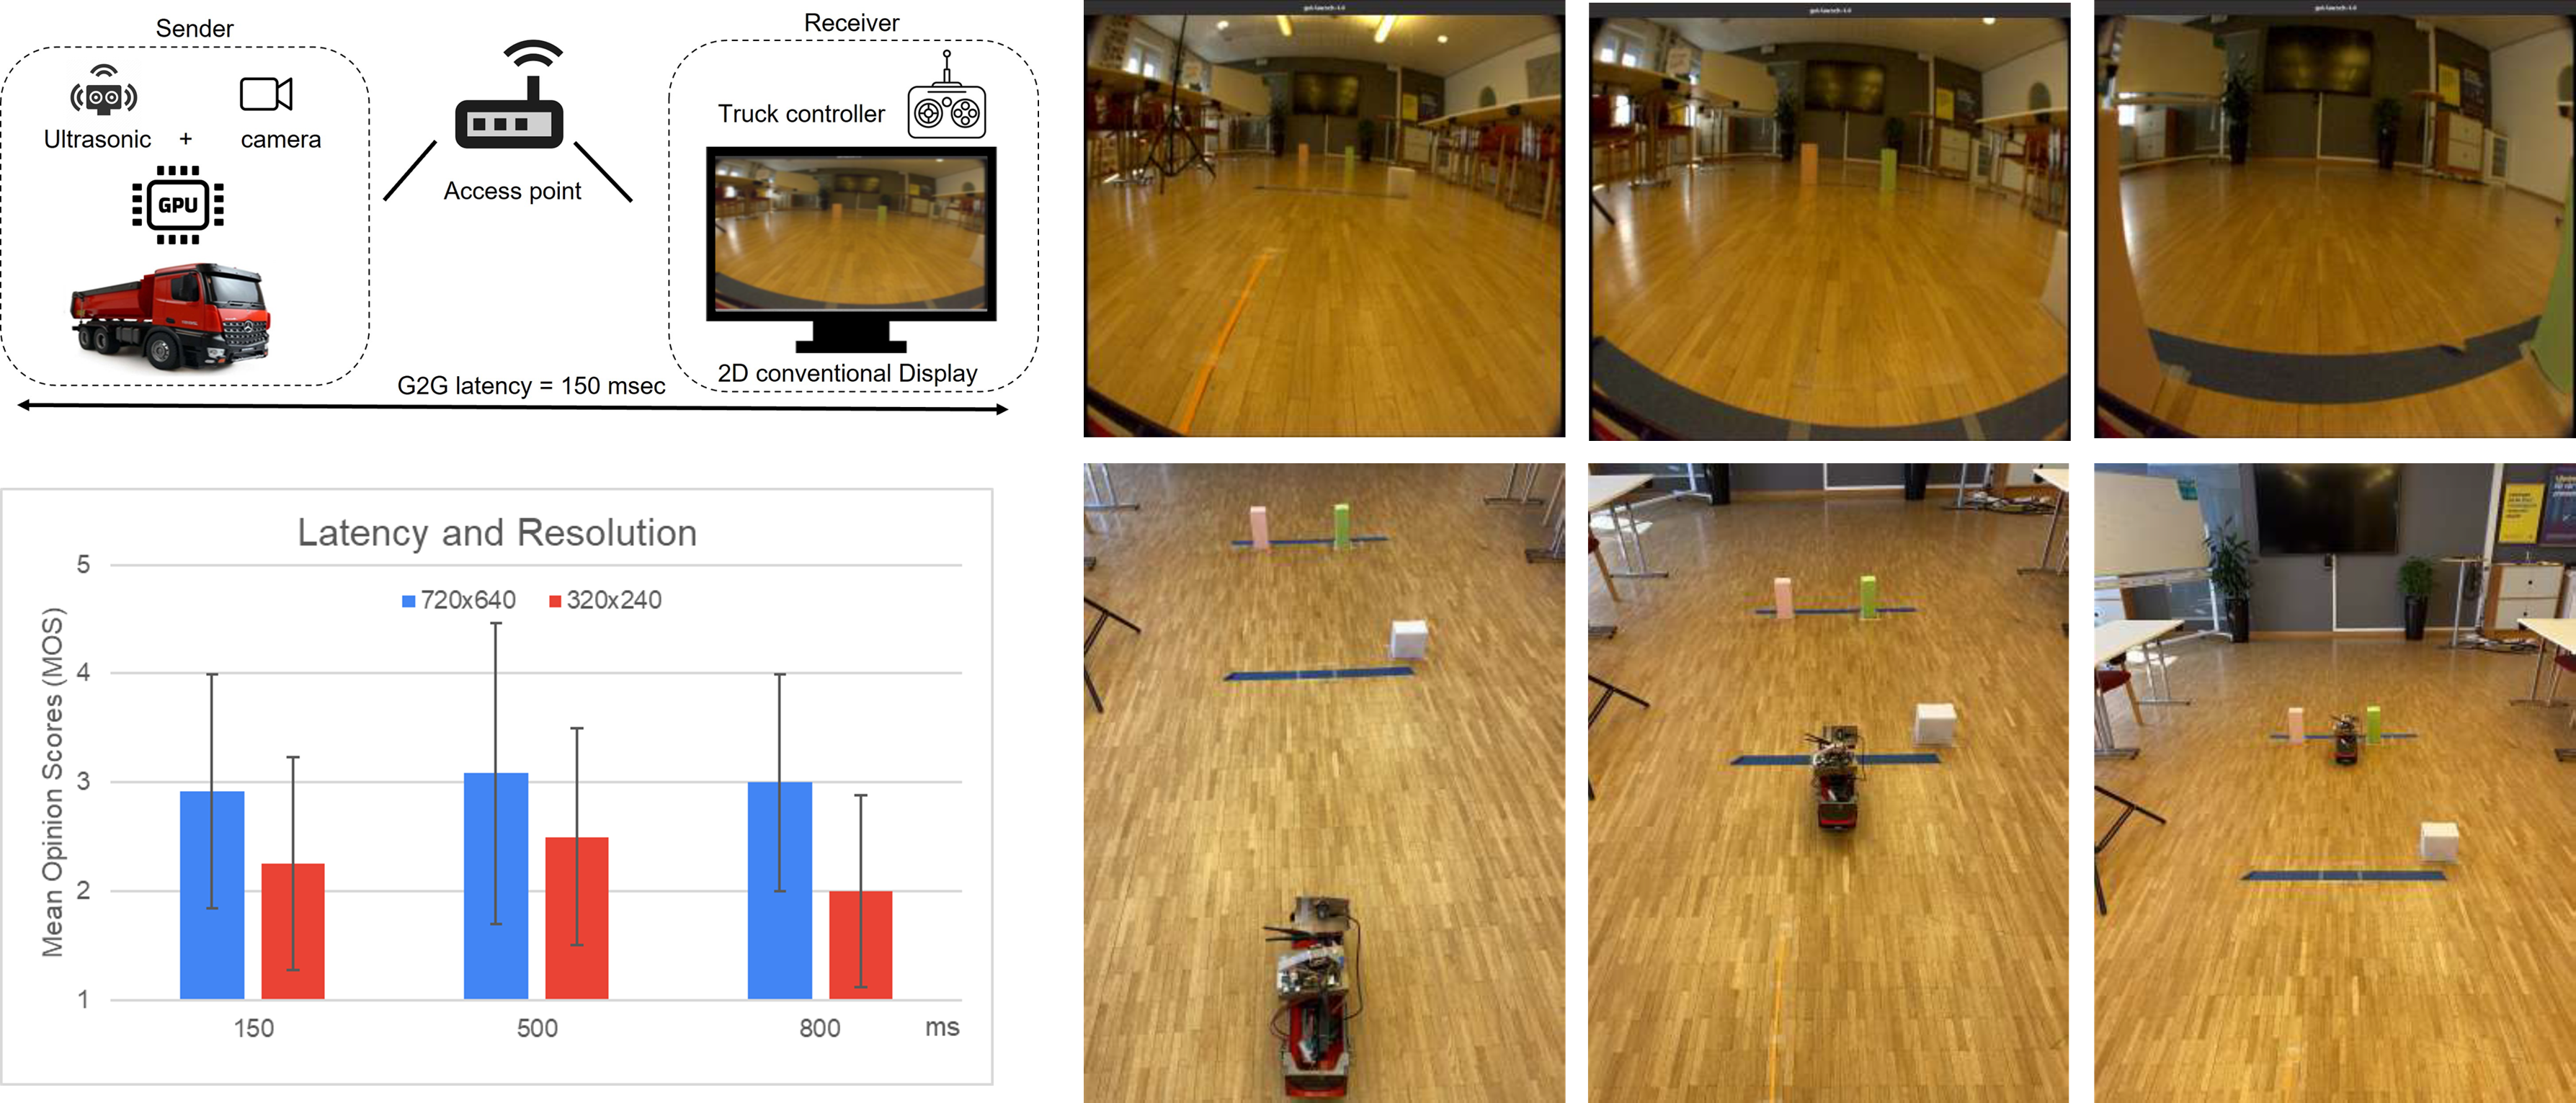
In this study, we designed an experiment using remote-controlled lab based moving platform to evaluate the impact of resolution, latency, and field of view on the Quality of Experience, performance, user experience and depth perception. The experiment involves two tasks: driving the platform to a stop point and parking it between two boxes. Participants provided feedback through questionnaires, and their experiences were analyzed. Seven participants between 30 and 57 (average of 37) years old participated. We used Google Forms for data collection, including pre-experiment and recurring questionnaires as well as a simulator sickness questionnaire. Despite the low number of test participants leading to uncertainty in quantitative analysis, significant effects were observed, albeit with contradictory statistical outcomes. The data suggests that lower latency corresponds to better performance, with participants not always perceiving higher latency accurately. Video quality notably impacts user experience, with higher resolution being preferred.

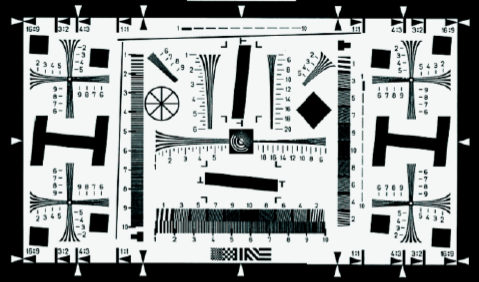
Thirty years ago, ISO/TC42 WG18, a newly created ISO working group on digital photography, began developing a standard to measure the spatial resolution of digital cameras. After years of proposals, testing, and analysis, consensus was reached on a test chart with tilted edge features for measuring spatial frequency response (SFR) and hyperbolic wedges for measuring visual and limiting resolution. The group ensured that the test chart and analysis software would be available internationally. First published in 2000, ISO 12233 is now used to measure cameras in a wide range of applications. It was revised in 2014 to define three new charts, a sine-wave modulated target in polar format, a low contrast e-SFR target, and the CIPA chart with software which computes a “human equivalent visual resolution†value. ISO 12233 is now being revised to provide improved results in challenging applications. This paper describes early resolution measurement approaches, and work in the 1990s to standardize the SFR method. It also describes enhancement made in later editions, including the 4th edition which is nearing publication.

Image quality assessment has been a very active research area in the field of image processing, and there have been numerous methods proposed. However, most of the existing methods focus on digital images that only or mainly contain pictures or photos taken by digital cameras. Traditional approaches evaluate an input image as a whole and try to estimate a quality score for the image, in order to give viewers an idea of how “good” the image looks. In this paper, we mainly focus on the quality evaluation of contents of symbols like texts. Judging the quality for this kind of information can be based on whether or not it is readable by a human, or recognizable by a decoder such as an OCR engine. We mainly study the quality of scanned documents in terms of the detection accuracy of its OCR-transcribed version. For this purpose, we proposed a novel CNN based model to predict the quality level of scanned documents or regions in scanned documents. Experimental results evaluated on our testing dataset demonstrate the effectiveness and efficiency of our method both qualitatively and quantitatively.

Modern scan routines require a predefined scan resolution, whether it is customer-selected or a default value in the scanner’s settings. When the scanning process begins, the resolution cannot be changed. This results in all scanned pages, no matter how much their contents may vary, having output images of the same size. If we can determine an optimal resolution for each scanned document raster content, we can save a lot of storage. In this paper, the resolutions in question are 300 dpi, 150 dpi, and 75 dpi. We define the criteria for optimal scan resolution and propose some new features to help determine it for scanned document raster content. The features proposed are sample power spectrum mean squared error (MSE), edge density, and edge contrast. These features can reflect the truthfulness between high-resolution 300 dpi images (references) and their lowresolution (150 dpi and 75 dpi) counterparts and the intrinsic changes among them. Combining them with spatial activity, tile standard deviation (STDDEV) structural similarity index measure mean (tile-STDDEV SSIM), and tile STDDEV structural similarity index measure STDDEV (tile-STDDEV SSIM STDDEV), we can form a feature vector, which is then fed into an SVM classifier. Test result shows that we can achieve a prediction accuracy of 93.4%.

VCX or Valued Camera eXperience is a nonprofit organization dedicated to the objective and transparent evaluation of mobile phone cameras. The members continuously work on the development of a test scheme that can provide an objective score for the camera performance. Every device is tested for a variety of image quality factors while these typically based on existing standards. Tests include texture loss, resolution, low light performance, shooting time lag, image stabilisation performance and more, all for a variety of different capture conditions. This paper presents that latest development with the newly released version 2020 and the process behind it.

This paper investigates camera phone image quality, namely the effect of sensor megapixel (MP) resolution on the perceived quality of images displayed at full size on high-quality desktop displays. For the purpose, we use images from simulated cameras with different sensor MP resolutions. We employ methods recommended in the IEEE 1858 Camera Phone Image Quality (CPIQ) standard, as well as other established psychophysical paradigms, to obtain subjective image quality ratings for systems with varying MP resolution from large numbers of observers. These are subsequently used to validate image quality metrics (IQMs) relating to sharpness and resolution, including those from the CPIQ standard. Further, we define acceptable levels of quality - when changing MP resolution - for mobile phone images in Subjective Quality Scale (SQS) units. Finally, we map SQS levels to categories obtained from star-rating experiments (commonly used to rate consumer experience). Our findings draw a relationship between the MP resolution of the camera sensor and the LCD device. The chosen metrics predict quality accurately, but only the metrics proposed by CPIQ return results in calibrated JNDs in quality. We close by discussing the appropriateness of star-rating experiments for the purpose of measuring subjective image quality and metric validation.

Currently, a particular scan resolution has to be defined before a scanner starts working. Two problems arise from this process. Firstly, no matter how different two pages contents are, they will be scanned into the same resolution. For example, after scanning, a blank page and a fine-detailed drawing will have the same resolution. Secondly, for one scanned page, every part of its output would have the same resolution, whatever their contents are. These problems will cause unnecessary waste of memory used to store scanned images. So a method to decide the minimum acceptable scan resolution is needed. But current image quality estimators are not suitable for estimating image quality at different resolutions. This paper proposes four features to assess image qualities at different resolutions, namely 75, 100, 150, 200 and 300 dpi. The features are tile-SSIM mean, tile-SSIM standard deviation, horizontal transition density, and vertical transition density. Tests on images containing different contents show that these features are promising in evaluate image qualities across different scan resolutions.