We study the relationship between acceptability/annoyance rating and traditional MOS quality ratings of UGC videos. Acceptability/annoyance is a key concept for evaluating services, as it classify whether the delivered service quality falls into acceptable, annoying but acceptable, or not acceptable. This relates to the willingness of users to use those services. While audiovisual quality estimation models have a long research history, the translation of these quality scores to acceptability and willingness to use the services has only been weakly studied. In this work, a new dataset was then created to evaluate both quality and the acceptability/annoyance of videos. Different state-of-the-art quality prediction models videos were evaluated at predicting quality of UGC videos. Furthermore, performance at predicting acceptability/annoyance of videos was also tested.

In complementary metal oxide semiconductor image sensor (CIS) industry, advances of techniques have been introduced and it led to unexpected artifacts in the photograph. The color dots, known as false color, also appear in images from CIS employing the modified color filter arrays and the remosaicing image signal processors (ISPs). Therefore, the objective metric for image quality assessments (IQAs) have become important to minimize artifacts for CIS manufacturers. In our study, we suggest a novel no-reference IQA metric to quantify the false color occurring in practical IQA scenarios. We propose a pseudo-reference to overcome the absence of reference image, inferring an ideal sensor output. As we detected the distorted pixels by specifying outlier colors with a statistical method, the pseudo-reference was generated while correcting outlier pixels with the appropriate colors according to an unsupervised clustering model. With the derived pseudo-reference, our method suggests a metric score based on the color difference from an input, as it reflects the results of our subjective false color visibility analysis.

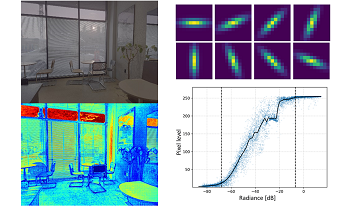
In photography, the dynamic range (DR) is a distinguishable brightness range and is determined by the analog-to-digital converter (ADC) and signal-to-noise (SNR) performance of the sensor. Recently, many various HDR strategies have been introduced to obtain high DR beyond these hardware limitations. However, since camera manufacturers set these HDR algorithms to operate differently by considering the situation, it is necessary to evaluate the quality of images taken in various situations for objective evaluation. In order to quantitatively measure the DR, we should know both the actual luminous intensity and the SNR of the picture. However, it is difficult to measure the two information in general-scene photos without charts. To overcome these problems, in this study, we propose a method to measure the DR of a natural-scene photograph by reconstructing radiance map and specifying the pixel value at which the SNR reaches 12dB. Using the pre-calculated radiation and SNR information, we measured DR of photos without using a chart, and demonstrated that HDR images have higher DR than standard DR (SDR) images.