GPT-4, which is a multimodal large-scale language model, was released on March 14, 2023. GPT-4 is equipped with Transformer, a machine learning model for natural language processing, which trains a large neural network through unsupervised learning, followed by reinforcement learning from human feedback (RLHF) based on human feedback. Although GPT-4 is one of the research achievements in the field of natural language processing (NLP), it is a technology that can be applied not only to natural language generation but also to image generation. However, specifications for GPT-4 have not been made public, therefore it is difficult to use for research purposes. In this study, we first generated an image database by adjusting parameters using Stable Diffusion, which is a deep learning model that is also used for image generation based on text input and images. And then, we carried out experiments to evaluate the 3D CG image quality from the generated database, and discussed the quality assessment of the image generation model.

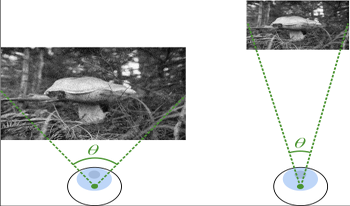
Assessing the quality of images often requires accounting for the viewing conditions - viewing distance, display resolution, and size. For example, the visibility of compression distortions may differ substantially when a video is viewed on a smartphone from a short distance and when viewed on a TV from a large distance. Nonetheless, traditional metrics are limited when applied across a diverse range of users with a diverse range of viewing environments. Metrics that account for these viewing conditions typically rely on contrast sensitivity functions (CSFs). However, it is also possible to rescale the input images to account for the change in the viewing distance. In a recent study comparing these two types of metrics, we did not observe any statistical difference between the metrics. Hence, in this paper, we use Fourier analysis to study the similarities and differences between the mechanisms of CSF-based and rescaling-based metrics. We compare the behavior of each approach and investigate the correlation between their predictions across the viewing distances. Our findings demonstrate a similarity between the two approaches for high-frequency distortions when the viewing distance is increased (the images are downscaled), but not when the viewing distance is decreased (the images are upscaled) or when accounting for low-frequency distortions.

Samsung introduced pixel-merging technologies such as Tetrapixel, and these enabled the mobile image sensors to reproduce colors properly depend on light conditions. High resolution image can be acquired when in well-lit area, by reorganize colors on the color filter array to RGB Bayer pattern. The aforementioned process is called remosaic algorithm, based on estimating direction information. It causes some artifacts on edges with various or unclear direction, for example in text-image, especially at high spatial frequencies. We focused on such artifacts caused by remosaicing, and proposed suitable image quality metric that can measure a degree of the artifacts.

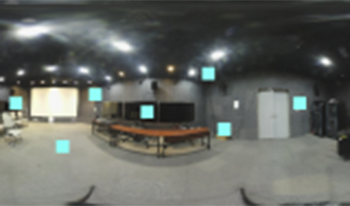
360-degree Image quality assessment (IQA) is facing the major challenge of lack of ground-truth databases. This problem is accentuated for deep learning based approaches where the performances are as good as the available data. In this context, only two databases are used to train and validate deep learning-based IQA models. To compensate this lack, a dataaugmentation technique is investigated in this paper. We use visual scan-path to increase the learning examples from existing training data. Multiple scan-paths are predicted to account for the diversity of human observers. These scan-paths are then used to select viewports from the spherical representation. The results of the data-augmentation training scheme showed an improvement over not using it. We also try to answer the question of using the MOS obtained for the 360-degree image as the quality anchor for the whole set of extracted viewports in comparison to 2D blind quality metrics. The comparison showed the superiority of using the MOS when adopting a patch-based learning.

From complete darkness to direct sunlight, real-world displays operate in various viewing conditions often resulting in a non-optimal viewing experience. Most existing Image Quality Assessment (IQA) methods, however, assume ideal environments and displays, and thus cannot be used when viewing conditions differ from the standard. In this paper, we investigate the influence of ambient illumination level and display luminance on human perception of image quality. We conduct a psychophysical study to collect a novel dataset of over 10000 image quality preference judgments performed in illumination conditions ranging from 0 lux to 20000 lux. We also propose a perceptual IQA framework that allows most existing image quality metrics (IQM) to accurately predict image quality for a wide range of illumination conditions and display parameters. Our analysis demonstrates strong correlation between human IQA and the predictions of our proposed framework combined with multiple prominent IQMs and across a wide range of luminance values.

There are an increasing number of databases describing subjective quality responses for HDR (high dynamic range) imagery with various distortions. The dominant distortions across the databases are those that arise from video compression, which are primarily perceived as achromatic, but there are some chromatic distortions due to 422 and other chromatic sub-sampling. Tone mapping from the source HDR levels to various levels of reduced capability SDR (standard dynamic range) are also included in these databases. While most of these distortions are achromatic, tone-mapping can cause changes in saturation and hue angle when saturated colors are in the upper hull of the of the color space. In addition, there is one database that specifically looked at color distortions in an HDR-WCG (wide color gamut) space. From these databases we can test the improvements to well-known quality metrics if they are applied in the newly developed color perceptual spaces (i.e., representations) specifically designed for HDR and WCG. We present results from testing these subjective quality databases to computed quality using the new color spaces of Jzazbz and ICTCP, as well as the commonly used SDR color space of CIELAB.

Image quality assessment has been a very active research area in the field of image processing, and there have been numerous methods proposed. However, most of the existing methods focus on digital images that only or mainly contain pictures or photos taken by digital cameras. Traditional approaches evaluate an input image as a whole and try to estimate a quality score for the image, in order to give viewers an idea of how “good” the image looks. In this paper, we mainly focus on the quality evaluation of contents of symbols like texts, bar-codes, QR-codes, lines, and hand-writings in target images. Estimating a quality score for this kind of information can be based on whether or not it is readable by a human, or recognizable by a decoder. Moreover, we mainly study the viewing quality of the scanned document of a printed image. For this purpose, we propose a novel image quality assessment algorithm that is able to determine the readability of a scanned document or regions in a scanned document. Experimental results on some testing images demonstrate the effectiveness of our method.

Previous work have validated that the output of retinal ganglion cells in human visual pathway, which can be modeled as an LOG (Laplacian of Gaussian) filtration, can whiten the power spectrum of not only the natural images, but also the distorted images, hence the first-order (average luminance) and the secondorder (contrast) redundancies have been removed when applying the LOG filtration. Considering the fact that human vision system (HVS) always ignores the first-order and the second-order information when sensing image local structures, the LOG signals should be efficient features in IQA (image quality assessment) task and a lot of LOG based IQA models have been proposed. In this paper, we focus on an interesting question that has not been investigated carefully yet: what is an efficient way to represent image structure features that is perceptual quality aware based on the LOG signals. We examine the relationship between neighboring LOG signals and propose to represent the relationship by computing the joint distribution of neighboring LOG signals, and thus propose a set of simple but efficient RR IQA feature and consequently yield an excellent RR IQA model. Experimental results on three large scale subjective IQA databases show that our proposed method works robustly across different databases and stay in the state-of-the-art RR IQA models.