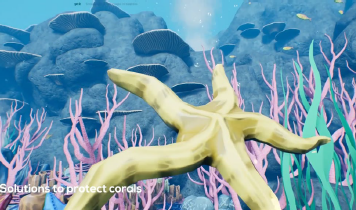
Since 2016 the RCA Grand Challenge is an interdisciplinary event that runs each year across the entire School of Design at the Royal College of Art. Around 400 Master and PhD students with design background participate in this event, focusing on tackling key global challenges through collaboration. In 2022, the Grand Challenge was focusing on elaborating topics in the context of Ocean-driven activities. In this context, a VR workshop was conducted with around 40 students with mostly no background in using VR platforms. In the end – after a 4-week design sprint – 10 UNREAL engine-based projects were presented of which we will discuss a selection here. One of the projects managed to be among the overall winning teams of the Grand Challenge 2022.

Given the amount of data created and available to everyone, there is a gap in consumable everyday data analytic tools for anyone to make sense of their data. At anonymous university, we designed an introductory data visualization course to teach college students how to analyze data. Students enrolled in this six-week summer course and used utilize Trifacta \cite{Trifacta}, Tableau \cite{Tableau}, and ObservableHQ \cite{ObservableHQ} on the IEEE VAST Challenge 2022 dataset. The course emphasized the uncertainty and deception involved in data visualization. We structured the course around ethical design choices. In this paper, we describe an overview of the ethical goals of our six-week data visualization summer course, review example student work on the IEEE VAST Challenge, and provide recommendations for ways to add ethical functionality to visualization tools. The goal is for more data visualization tools which are consumable for novice users and support ethical design choices.

In order to explore the design space of a new, potentially unconventional, sensor or to optimize sensor characteristics for a given computer vision application, an image acquisition process simulator has been designed. Its aim is to be simple and modular, yet complete and accurate enough to match the physical phenomena involved. The approach has been described in this paper to highlight the different steps of the acquisition process and to explain the implementation choices and the hypotheses that were made. The simulator has been tested on images of point sources, on simulated test patterns and on real high definition pictures and has proven realistic.

