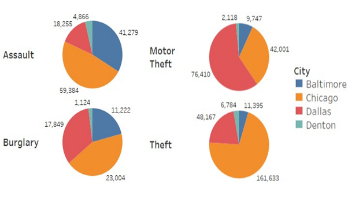
The rise in crime rates over the past few years is a major issue and is a huge source of worry for police departments and law enforcement organizations. Crime severely harms the lives of victims and the communities they live in many places throughout the world. It is an issue of public disturbance, and large cities often see criminal activity. Many studies, media, and websites include statistics on crime and it is contributing elements, such as population, unemployment, and poverty rate. This paper compares and visualizes the crime data for four different cities in the USA, namely Chicago, Baltimore, Dallas, and Denton. We assess areas that are significantly affected based on zip codes and variations in crime categories. As the crime rates have significantly changed both upward and downward throughout time, these changes are compared to their external causes such as population, unemployment, and poverty. The results show crime frequency and distribution across four different cities and supply valuable information about the complex relationship between social factors and criminal behavior. These results and outcomes will help the police department and law enforcement organizations better understand crime issues, map crime incidents onto a geographical map, and supply insight into factors affecting crime that will help them deploy resources and help in their decision-making process.

Situational awareness provides the decision making capability to identify, process, and comprehend big data. In our approach, situational awareness is achieved by integrating and analyzing multiple aspects of data using stacked bar graphs and geographic representations of the data. We provide a data visualization tool to represent COVID pandemic data on top of the geographical information. The combination of geospatial and temporal data provides the information needed to conduct situational analysis for the COVTD-19 pandemic. By providing interactivity, geographical maps can be viewed from different perspectives and offer insight into the dynamical aspects of the COVTD-19 pandemic for the fifty states in the USA. We have overlaid dynamic information on top of a geographical representation in an intuitive way for decision making. We describe how modeling and simulation of data increase situational awareness, especially when coupled with immersive virtual reality interaction. This paper presents an immersive virtual reality (VR environment and mobile environment for data visualization using Oculus Rift head-mounted display and smartphones. This work combines neural network predictions with human-centric situational awareness and data analytics to provide accurate, timely, and scientific strategies in combatting and mitigating the spread of the coronavirus pandemic. Testing and evaluation of the data visualization tool have been done with realtime feed of COVID pandemic data set for immersive environment, non-immersive environment, and mobile environment.