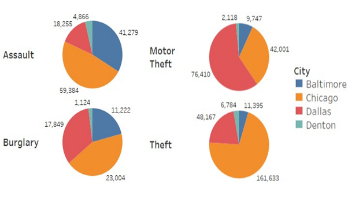
The rise in crime rates over the past few years is a major issue and is a huge source of worry for police departments and law enforcement organizations. Crime severely harms the lives of victims and the communities they live in many places throughout the world. It is an issue of public disturbance, and large cities often see criminal activity. Many studies, media, and websites include statistics on crime and it is contributing elements, such as population, unemployment, and poverty rate. This paper compares and visualizes the crime data for four different cities in the USA, namely Chicago, Baltimore, Dallas, and Denton. We assess areas that are significantly affected based on zip codes and variations in crime categories. As the crime rates have significantly changed both upward and downward throughout time, these changes are compared to their external causes such as population, unemployment, and poverty. The results show crime frequency and distribution across four different cities and supply valuable information about the complex relationship between social factors and criminal behavior. These results and outcomes will help the police department and law enforcement organizations better understand crime issues, map crime incidents onto a geographical map, and supply insight into factors affecting crime that will help them deploy resources and help in their decision-making process.

We propose novel deep learning based chemometric data analysis technique. We trained L2 regularized sparse autoencoder end-to-end for reducing the size of the feature vector to handle the classic problem of the curse of dimensionality in chemometric data analysis. We introduce a novel technique of automatic selection of nodes inside the hidden layer of an autoencoder through Pareto optimization. Moreover, Gaussian process regressor is applied on the reduced size feature vector for the regression. We evaluated our technique on orange juice and wine dataset and results are compared against 3 state-of-the-art methods. Quantitative results are shown on Normalized Mean Square Error (NMSE) and the results show considerable improvement in the state-of-the-art.